ROBUSTNESS OF THE a b SIGNAL DETECTION THEORY MODEL OF. DECISION MAKING. Ernesto A. Bustamante. Brittany L. Anderson. Amy R. Thompson.
PROCEEDINGS of the HUMAN FACTORS AND ERGONOMICS SOCIETY 51st ANNUAL MEETING—2007
1263
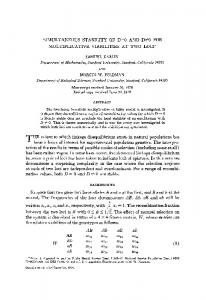
ROBUSTNESS OF THE a b SIGNAL DETECTION THEORY MODEL OF DECISION MAKING Ernesto A. Bustamante Brittany L. Anderson Amy R. Thompson James P. Bliss Mark W. Scerbo Old Dominion University Norfolk, VA Bustamante, Fallon, and Bliss (2006) showed that the a b Signal Detection Theory (SDT) model was more parsimonious, generalizable, and applicable than the classical SDT model. Additionally, they demonstrated that both models provided statistically equivalent and uncorrelated measures of sensitivity and bias under ideal conditions. The purpose of this research was to show the robustness of the a b model for handling extreme responses. We conducted an empirical evaluation of operators’ decision-making and two Monte Carlo simulations. Results from the empirical study showed that the a b model provided equivalent yet independent measures of decision-making accuracy and bias, whereas the classical model failed to provide independent measures in the presence of extreme responses. The Monte Carlo simulations showed a similar trend for the superiority of the a b model. Results from this research provide evidence to support the use of the a b model instead of the classical model. Classical Signal Detection Theory (SDT) The original SDT model proposed by Green and Swets (1966) was based on the assumption of an underlying psychophysical continuum, along which laid two normally distributed probability density functions with equal variances (see Figure 1).
Noise
Signal + Noise d’
-c
+c
Since then, researchers have developed a variety of different measures of sensitivity and response bias (Stanislaw &Todorov, 1999). Today, the most widely accepted measures of sensitivity and response bias are d’ and c, respectively (See, Warm, Dember, & Howe, 1997). The problem with d’ and c is that they are undefined when a person makes extreme responses (e.g., p(HI)=1). Consequently, researchers have had to develop different ways to address extreme scores in their data (Stanislaw & Todorov, 1999). The most widely used method for dealing with this problem is to transform the raw proportions of hits and false alarms using the log-linear transformation before computing d’ and c. The a b SDT Model
Psychophysical Continuum
Figure 1. Noise and Signal + Noise Distributions.
Recently, Bustamante et al. (2006) offered alternative measures of accuracy (a) and response bias (b) that do not rely on the underlying decisionmaking assumptions required for the classical model. Instead, a and b are based simply on the
PROCEEDINGS of the HUMAN FACTORS AND ERGONOMICS SOCIETY 51st ANNUAL MEETING—2007
outcome matrix, defined by the proportion of hits and false alarms (see Formulae 1 and 2). a = .5*p(HI) + .5*p(CR)
(1)
b = .5*p(HI) + .5*p(FA)
(2)
where, p(HI) = hit rate
1264
making accuracy and bias while they interacted with an alarm system. For the purposes of this study, however, we were primarily interested in comparing the a b and classical models. We chose this particular study because the data showed that 10% of participants had a p(HI)=1. Given the limitations of the classical model for handling extreme responses, we hypothesized that the a b model would provide uncorrelated measures of accuracy and bias, whereas the classical model would provide correlated measures.
p(CR) = 1 – p(FA) Method p(FA) = false alarm rate Experimental Design The main theoretical advantages of the a b model are that it is more parsimonious, more generalizable, and more applicable to situations in which people or automated systems do not make decisions based on a single underlying continuum (Bustamante et al. 2006). Furthermore, the main practical advantage of the a b model is that it does not require any transformation of the data, and the accuracy and bias measures are defined even in the presence of extreme responses.
We used a 2 x 2 x 2 x 2 mixed experimental design. We manipulated workload and likelihood information within groups, and task-critical information and session order between groups. Participants Fifty four university students (41 females, 13 males) participated in this study. They ranged from 18 to 42 years of age (M = 22.70, SD = 5.58).
Goals of this research Materials and Apparatus The purpose of this research was threefold. First, we wanted to test the robustness of the a b model for handling extreme responses by analyzing empirical data from a previous study (Bustamante, 2005). Second, we wanted to examine the effects of performing the log-linear transformation before computing the classical measures (i.e., d’, c) under ideal conditions through the use of a Monte Carlo simulation. Third, we wanted to examine the superiority of the a b model over the classical model across a wider spectrum of proportions of extreme responses, also by conducting a Monte Carlo simulation. EMPIRICAL STUDY As previously mentioned, we analyzed empirical data from a study by Bustamante (2005) that examined the effects of workload, task-critical and likelihood information on operators’ decision-
Tasks. Participants performed the tracking and resource-management tasks of the MultiAttribute Task (MAT) Battery (Comstock & Arnegard, 1992) on a primary computer. Also, participants performed an engine-monitoring task on a secondary computer. The purpose of this task was to make corrective actions by responding to alarms that were indicative of dangerous conditions. Workload. Experimenters manipulated workload by automating the tracking task during low-workload conditions and by introducing random pump malfunctions in the resourcemanagement task during high-workload conditions. Task-Critical Information. Experimenters manipulated task-critical information by presenting participants with engine-status information related to the engine-monitoring task through the use of the monitoring display in the MAT Battery.
PROCEEDINGS of the HUMAN FACTORS AND ERGONOMICS SOCIETY 51st ANNUAL MEETING—2007
1265
Likelihood Information. Experimenters manipulated likelihood information following the methodology used by Sorkin, Kantowitz, and Kantowitz (1988). Dependent Measures. For the purposes of this research, we computed participants’ decisionmaking accuracy and bias on the engine-monitoring task using both the a b and classical models.
perhaps the reason for the superiority of the a b model is that in most applied settings, people and automated systems do not make decisions based on a single underlying continuum. Therefore, the fundamental assumptions of the classical model may be inappropriate in many situations.
Procedure
The purpose of the first Monte Carlo simulation was to examine the effects of transforming the data. To accomplish this, we followed an approach similar to that of Bustamante et al. (2006), except that we performed the loglinear transformation prior to computing d’ and c. Based on Stanislaw and Todorov (1999)’s support for the use of the log-linear transformation as the preferred method for handling extreme responses, we hypothesized that under ideal conditions, both models would provide statistically equivalent and independent measures of accuracy and bias, despite the prior transformation of the data.
We randomly assigned participants to either the low or high task-critical information conditions. Participants completed four 30-min experimental sessions, which varied according to the level of workload and likelihood information. Results Results from this study were consistent with our hypothesis. As shown in Table 1, the a b model provided uncorrelated measures of accuracy and bias, whereas the classical model provided correlated measures. Table 1 Correlations ad' bc ab cd’
.98 -.98 -.10 .30
p < .001 p < .001 n.s. p < .001
Discussion These preliminary empirical findings raised two important questions regarding the applicability of the classical SDT model. One possible explanation for the superiority of the a b model over the classical model could be that the classical model requires a transformation of the raw hit and false alarm rates prior to the computation of d’ and c in the presence of extreme responses. However, another explanation could be that the superiority of the a b model is not due to the practical limitation of the classical model, but rather to more theoretical issues. As Bustamante et al. (2006) suggested,
MONTE CARLO SIMULATION 1
Method Using SPSS, we first simulated hit and false alarm rates for 1000 cases randomly sampled from a uniform distribution. We then transformed the raw hit and false alarm rates using the log-linear transformation, assuming a .50 probability of the target signal and 100 trials. We then conducted 100 iterations, and calculated the a and b measures based on the raw hit and false alarm rates, and the c, and d’ measures based on the transformed data. We finally computed the correlations between the measures over the 100 iterations. Results Table 2 shows the average correlations between the measures across and within the two models.
1266
PROCEEDINGS of the HUMAN FACTORS AND ERGONOMICS SOCIETY 51st ANNUAL MEETING—2007
Table 2 Average Correlations M ad' .99* bc -.99* ab .00 cd’ .00 N = 100, *p < .001
SD .02 .03 .00. .00
Discussion Results from the first Monte Carlo simulation showed that despite the use of the loglinear transformation, both models were capable of providing statistically equivalent and independent measures of accuracy and bias. These results were consistent with Stanislaw and Todorov (1999)’s support for the use of the log-linear transformation. Consequently, these findings refuted the first proposed explanation for the superiority of the a b model over the classical model.
and false alarm rates using the log-linear transformation, assuming a .50 probability of the target signal and 100 trials. We then conducted 100 iterations, and calculated the a and b measures based on the recoded hit and false alarm rates, and the c, and d’ measures based on the transformed data. Last, we computed the correlations between the measures over the 100 iterations. Results The results showed a statistically significant two-way interaction between model and proportion of people with p(HI)=1, F(2, 297) = 197.21, p < .001, partial η2 = .57. As shown in Figure 2, both models provided correlated measures of accuracy and bias, particularly when the proportion of people with p(HI)=1 was .50. However, the a b model seemed to be more robust to this problem, and the difference between the two models increased as the proportion of people with p(HI)=1 increased. 1 0.9
MONTE CARLO SIMULATION 2
0.8 0.7 0.6
r
The purpose of the second Monte Carlo simulation was to assess the plausibility of our second proposed explanation for the superiority of the a b model over the classical model in the presence of extreme responses (i.e., p(HI)=1).
ab cd'
0.5 0.4 0.3 0.2 0.1
Method Experimental Design We used a 2 x 3 mixed experimental design and manipulated the proportion of people with p(HI)=1 at three levels: .10, .50, and .90. We also compared the absolute value of the correlations between the measures within each model as a within-groups variable. Using SPSS, we first simulated hit and false alarm rates for 1000 cases randomly sampled from a uniform distribution. Based on the level of the proportion of people with p(HI)=1, we recoded the raw hit rates to obtain the desired proportions (i.e., .10, .50, .90). We then transformed the recoded hit
0 0.1
0.5
0.9
p(HI)=1
Figure 2. Correlations between accuracy and bias measures. Discussion Results from the second Monte Carlo simulation were comparable to the results of the empirical study. The a b model was superior to the classical model across the wider spectrum of the proportion of people with p(HI)=1. Nevertheless, both models seemed to be particularly vulnerable when the proportion extreme responses was .50. Probability theory may offer a potential explanation for these findings. A signal detection-
PROCEEDINGS of the HUMAN FACTORS AND ERGONOMICS SOCIETY 51st ANNUAL MEETING—2007
type task is similar to a series of Bernoulli trials, which form Binomial distributions of hit and false alarm rates. Similarly to a Bernoulli trial, the maximum variance of a Binomial distribution occurs when the probability of a success, or in SDT terms p(HI)=1, equals .50. Consequently, a potential reason why both models provided maximum correlations between their measures might be because the correlation between two variables increases as the variance of each variable increases, ceteris paribus. Conclusions The findings from the set of the studies presented in this paper have both theoretical implications and practical applications for human factors scientists and practitioners. Our findings should raise awareness in the scientific community regarding the justification of the fundamental assumptions of the classical SDT model and offer what could be considered a more parsimonious model. Furthermore, results from this research effort showed support for the superiority of the a b model over the classical model, particularly under the presence of extreme responses, which may be common in many applied settings. References Bustamante, E. A. (2005). A signal detection analysis of the effects of workload, taskcritical and likelihood information on human alarm response. In Proceedings of the 49th Annual Meeting of the Human Factors and Ergonomics Society (pp. 1513-1517). Santa Monica, CA: Human Factors and Ergonomics Society. Bustamante, E. A., Fallon, C. K., & Bliss, J. P. (2006). A more parsimonious approach to estimating signal detection theory measures. In Proceedings of the Human Factors and Ergonomics Society 50th Annual Meeting (pp. 1711-1715). Santa Monica, CA: Human Factors and Ergonomics Society. Comstock, J. R., & Arnegard, R. J. (1992). The multi-attribute task battery for human operator workload and strategic behavior
1267
research (NASA Technical Memorandum No. 104174). Hampton, VA: National Aeronautics and Space Administration, Langley Research Center. Green. D. M., & Swets, J. A. (1966). Signal detection theory and psychophysics. New York: Wiley. See, J. E., Warm, J. S., Dember, W. N., & Howe, S. R. (1997). Vigilance and signal detection theory: An empirical evaluation of five measures of response bias. Human Factors, 39(1), 14-29. Sorkin, R. D., Kantowitz, B. H., & Kantowitz, S. C. (1988). Likelihood alarm displays. Human Factors, 30(4), 445-459. Stanislaw, H., & Todorov, N. (1999). Calculation of signal detection measures. Behavior Research Methods, Instruments, & Computers, 31(1), 137-149.