The Design and Evaluation of a Sonically-Enhanced Tool Palette STEPHEN A. BREWSTER CATHERINE V. CLARKE Glasgow Interactive Systems Group, Department of Computing Science, University of Glasgow ________________________________________________________________________ This paper describes an experiment to investigate the effectiveness of adding sound to tool palettes. Palettes have usability problems because users need to see the information they present but they are often outside the area of visual focus. We used non-speech sounds called earcons to indicate the current tool and when tool changes occurred so that users could tell what tool they were in wherever they were looking. Results showed a significant reduction in the number of tasks performed with the wrong tool. Therefore users knew what the current tool was and did not try to perform tasks with the wrong tool. All of this was not at the expense of making the tool palettes any more annoying to use. Categories and Subject Descriptors: [General Literature - General]: Conference Proceedings General Terms: Experimentation, Human Factors, Performance Additional Key Words and Phrases: Sonically-Enhanced Widgets, Auditory Display, Human-Computer Interaction
________________________________________________________________________ 1. INTRODUCTION Tool (or button) palettes are a common feature of most graphical interfaces. They allow the user access to a set of tools and indicate which tool is currently active (see (a) in Figure 1). Put another way, palettes are mode indicators; they allow the user to set the mode and then indicate what the current mode is [Dix et al. 1993]. Figure 1 (a) shows a set of tools from a graphics package, where tool palettes are common. The currently selected tool (in this case the rectangle drawing tool) is highlighted by changing its border. In some systems (for example the Microsoft Word drawing package) after one rectangle has been drawn the system will change back to the default tool, often the selection tool (the dotted square at the top left of (a) in Figure 1). In other systems (for example Adobe Illustrator) the tool will remain selected until the user changes it. There is a hybrid of these two (for example Claris MacDraw Pro) where the user can single-click a tool for it to be selected once (and then return to the default tool) or double-click for it to remain permanently selected. This method has the advantage that users can choose whether they want to stay in a drawing tool or revert back to the selection tool - it is more flexible. Figure 1 (a) shows an example of the feedback indicating a single click and (b) shows a double click. These different methods of use can cause usability problems. Interaction problems occur because users may not notice the currently active tool. In a graphics package users will be occupied with the drawing task they are doing (perhaps drawing a series of rectangles) which will require their full visual attention. This means that they will not be looking at the palette to see the current tool. If the system switches back to a default tool users may try to draw another rectangle but end up using the selection tool by mistake. If the system remains in the current tool they may draw another rectangle by mistake when they really
This research was supported by the Engineering and Physical Sciences Research Council. Authors' addresses: Department of Computing Science, University of Glasgow, Glasgow, G12 8QQ, UK. Email:
[email protected], Web: www.dcs.gla.ac.uk/~stephen Permission to make digital/hard copy of part of this work for personal or classroom use is granted without fee provided that the copies are not made or distributed for profit or commercial advantage, the copyright notice, the title of the publication, and its date of appear, and notice is given that copying is by permission of the ACM, Inc. To copy otherwise, to republish, to post on servers, or to redistribute to lists, requires prior specific permission and/or a fee. © 2001 ACM 1073-0516/01/0300-0034 $5.00
wanted to position the rectangle just drawn. These problems are exacerbated by the hybrid system because it is less predictable as the user may not remember if the current tool was single or double clicked. This paper will discuss an experiment to solve these problems using sound.
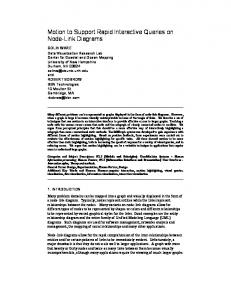
Figure 1: Rectangle tool selection by (a) single click, and (b) double click.
To solve the problems of tool mis-selection users must get the right feedback to ensure that they know what is going on [Reason 1990]. In this paper we suggest using auditory feedback to solve the problems. Why use sound, why not just use extra graphical feedback? It is difficult to solve these problems with extra graphics. Graphics displayed on the palette will not be seen by users because their attention will be on the drawing task they are engaged in. The visual system has a narrow area of focus which means that users cannot look at the palette as well as their main task [Brewster 1994]. Information could be displayed at the mouse location - often the shape of the cursor is changed to reflect the current tool. This has some effect but if the different cursors are too big they will obscure the drawing underneath or if they are too small they will be too subtle to be noticed by users who are concentrating on the drawing they are creating. Non-speech sound has many advantages. It does not take up any screen space, it is good at getting our attention whilst we are looking at something else and it does not disrupt our visual attention. If we give tool information in sound then we do not need to know where users are looking. If users must look at the palette then it forces them to stop what they are doing for their main task and causes the interface to intrude upon the task they are trying to perform, sound does not have such drawbacks. 1.1 Other work in the area Although there has been no other work on the use of sound in tool palettes, there has been some work on the use of sound to improve other graphical interface components. Brewster and colleagues have successfully improved the usability of buttons, scrollbars and menus with sound [Brewster et al. 1997a, 1997b]. They reduced time taken to recover from errors, time taken to complete tasks and workload without any increase in subjective annoyance. Beaudouin-Lafon & Conversey [1996] added sound to overcome usability problems in scrollbars. They used an auditory illusion called Shepard-Risset tones which increase (or decrease) in pitch indefinitely (similar to the Escher drawing of an endless staircase). When the user was scrolling down a continuously decreasing tone was used, when scrolling up an increasing one. If scrolling errors occurred then the user would hear tones moving in the wrong direction. Results from these earlier experiments suggested that sound would be effective in overcoming the problems with tool palettes.
2. EXPERIMENT An experiment was needed to investigate if the addition of sound to tool palettes could solve the problems of tool mis-selection. Twelve participants were used. They were undergraduate students from the University of Glasgow. All were experts with more than three years experience of graphical interfaces and tool palettes. Our main hypotheses were: The extra auditory feedback heard by participants should make the task easier because they will be able to tell they have made errors and recover from them more readily. This should result in an overall reduction in workload. There should be no increase in annoyance due to the sounds as they will be providing information that the participants need to overcome usability problems. The number of tasks performed with the wrong tool should be reduced as users will know which tool is currently active. This will be indicated by a decrease in the number of tasks performed with the wrong tool. 2.1Task Participants were required to perform drawing tasks set by the experimenter in a simple graphics package. Figure 2 shows a screen-shot of the graphics package, the tool palette used is shown in Figure 1. We implemented the hybrid single and double click method for tool selections as this has the potential for the most usability problems. To select a drawing tool the user either single-clicked its icon for one use or double-clicked for multiple uses. If the user single-clicked a drawing tool after it had been used the system changed back to the default selection tool.
Figure 2: Screen-shot of the graphics package used.
The drawing tasks performed involved users drawing a car, tree and sun. The eight car-drawing tasks were described step-by-step; the final two tasks were left more open. The tasks were designed to mimic the standard drawing tasks a user might perform. The tasks also gave the user the opportunity of double and single clicking the tools in the palette. Some tasks required several lines to be drawn one after the other so double clicking would be appropriate, other tasks required frequent changes between tools to draw and move items. 2.2 Sounds
The sounds used were based around structured non-speech audio messages called Earcons [Blattner et al. 1989; Brewster et al. 1993]. Earcons are abstract, musical tones that can be used in structured combinations to create sound messages to represent parts of an interface. The sounds were created using the earcon guidelines proposed by Brewster et al. [1995]. Earcons were needed to indicate the currently active tool. One method of doing this would be to play a continuous sound when a tool was selected. This seems like a good way to solve the problem; A constantly repeating sound is unlikely to be missed by the user so the tool will not be mistaken. The main drawback with this is that it is likely to become annoying for users - something which is very important to avoid [Brewster 1994]. The main problems with the tool palette occur when switching from one tool to another. If the user does not know a switch has occurred (or conversely does not know that the same tool is still active) then errors will result. Therefore we decided to concentrate on this and only play sounds when problems were likely. Tool palette Default tool: Marimba Other tools: Trumpet
Single Click Pitch C2 Single tone, duration 100 msec.
Double Click Pitch C2 Two tones, duration 100 msec. each, with 100 msec. between them
Figure 3: Hierarchy of earcons used.
Figure 3 shows the hierarchy of earcons used. The default selection tool was given a marimba timbre and the other tools a trumpet timbre. Only two instruments were needed because any automatic tool changes would always be from a drawing tool to the default tool. This situation was where errors were likely to occur so we needed to make these changes salient to the user. The difference between these instruments when the earcons were played would grab the users’ attention. For a single-click selection one note at pitch C3, duration 100 msec. was played. When a tool was selected by a double click the user heard the single-click selection sound, to indicate a change in tool, and then two notes at a higher pitch, C2, duration 100 msec., with 100 msec. between them, to indicate a double-click selection. These sounds were heard in the timbre of the tool selected. 2.3 Experimental design and procedure
The experiment was a two-condition, repeated-measures within-subjects design. So each participant used both the silent and sonic tool palettes. The order of presentation was counterbalanced to avoid any learning effects across conditions. One group of six participants performed the auditory tool palette condition first and the other used the standard visual palette first. Ten minutes of training was given before each condition. During each condition the participants had to perform the standard drawing tasks set by the experimenter. A trace was stored of the location and time of each mouse click. Instructions were read from a prepared script. To get a full measurement of usability we used measures of error rates and subjective workload. We used the standard six-factor NASA Task Load Index (TLX) for estimating workload [Hart and Staveland 1988]. To this we added a seventh factor: annoyance. One of the concerns of potential users of auditory interfaces is annoyance due to sound pollution. This is often given as a reason for not using sound at the human-computer interface. In the experiment described here the annoyance was measured to find out if it was indeed a problem. It is important when evaluating systems that use sound to test a full range of subjective factors including annoyance. The area is still in its infancy and it is not yet clear how to design interface or data sonifications that work well. Just evaluating performance time or errors may not be enough to bring up all of the potential problems. We also asked our participants to indicate overall preference, i.e. which of the two interfaces they felt made the task easiest. Participants had to fill in workload charts after both conditions of the experiment. 3. WORKLOAD RESULTS Figure 4 shows the average workload scores for each category. They were scored in the range 0-20. The average raw workload (based on mental and physical demand, effort expended, time pressure, frustration and performance) was 9.29 in the auditory condition and 9.61 in the visual. There was no significant difference in the workload between conditions (T11=0.26, p=0.79). There was no significant difference in terms of annoyance between the conditions ( T11=0.24, p=0.81). Six of the participants felt the visual condition was more annoying, five felt the auditory more annoying and one felt them equal. The average scores for overall preference was 13.67 for the auditory condition and 10.67 for the visual condition. Again, this was not significantly different (T11=1.70, p=0.12). However, nine participants preferred the tool palette with sounds, and three participants preferred it without.
20 18 16
Average Score
14 12 10 8 6 4 2 0 Mental
Time pressure
Frustration
Overall preference
Workload Categories
Figure 4: Average workload scores for the two conditions. In the first six categories higher scores mean higher workload. The final two categories are separated as higher scores mean lower workload.
4. ERROR RESULTS Figure 5 shows the number of tasks performed with the wrong tool (i.e. the participant forgot what the current tool was and used the wrong one). There was a significant reduction in the auditory condition ( T11=3.08, p=0.01). This indicated that the earcons did help participants remember the tool they were using. In total, eight participants never used a wrong tool in the auditory condition with only three in the visual. The average number of tasks performed with the wrong tool fell from 3.25 in the visual condition to 0.83 in the auditory condition. This indicated that participants noticed they were in the wrong tool immediately and in most cases changed to the correct tool straight away. Therefore, if tools changed unexpectedly participants were more likely to notice them in the auditory condition.
9 8 Number of tasks
7 6 5 4 3 2 1 0 1
2
3
4
5
6
7
8
9 10 11 12
Participants
Figure 5: Number of tasks performed with wrong tool.
5. DISCUSSION The workload analysis showed no significant differences in terms of workload. Even though the error results showed that sound reduced the number of times the wrong tools were used, workload was not reduced (as had been hypothesised). One explanation for this is that users were asked to rate the workload of the task as a whole rather than for the tool palette specifically. They may have considered the selection of tools a small part of the whole task so any differences in the workload attributable to tool selection were lost amongst the data for the whole task. The results showed no difference in the annoyance experienced by users. This indicated that if care was taken in the design of the earcons, and they solve specific usability problems, users will find them useful and not annoying. This confirms our previous findings [Brewster 1997a, 1997b]. Analysis of the errors made by participants showed that there were significantly fewer tasks performed with the wrong tool in the auditory condition. This means that the earcons were indicating to the users what tool, or mode, they were in and they did not forget. In fact only four of the twelve participants tried to perform any of the tasks with the wrong tools in the auditory condition. When the system changed back to the default tool automatically (if the user single clicked a drawing tool) then errors were likely; Users might not be expecting a change. The results showed that the auditory feedback did indicate this to users significantly better than the standard graphical feedback. Therefore, the earcons were effective at indicating tool changes. These results showed that sonic-enhancement of a tool palette could significantly increase usability without making it more annoying to use. This, combined with other results reported above, indicates that the sonic enhancement of graphical interfaces is an important way of increasing usability. 6. CONCLUSIONS The use of earcons can overcome usability problems with tool palettes. Many of these problems are due to the narrow area of visual focus; Users are unlikely to see the palette when engaged in a drawing task because drawing
requires their full visual attention. Information about the current tool can be presented with earcons and then the user can hear it wherever he/she is looking. Results from an experimental evaluation showed that significantly fewer tasks were performed with the wrong tool and significantly more tool changes were noticed when sound was used. These advantages were gained without making the interface more annoying to use. This research provides further evidence to show that sonification of human-computer interfaces is an effective method for designers who want to improve the usability of their systems.
ACKNOWLEDGMENTS This work was undertaken by Catherine Clarke as part of her undergraduate honours project at Glasgow University. REFERENCES BEAUDOUIN-LAFON, M., AND CONVERSY, S. 1996. Auditory illusions for audio feedback. ACM CHI'96 Conference Companion, Vancouver, Canada, ACM Press, 299-300. BLATTNER, M., SUMIKAWA, D. AND GREENBERG, R. 1989. Earcons and icons: Their structure and common design principles. Human Computer Interaction 4, 1, 11-44. BREWSTER, S.A. 1994. Providing a structured method for integrating non-speech audio into human-computer interfaces. PhD Thesis, University of York, York, UK. BREWSTER, S.A. 1997a. Using Non-Speech Sound to Overcome Information Overload. Displays 17, 179-189. BREWSTER, S.A. AND CREASE, M.G. 1997b. Making Menus Musical. Proceedings of IFIP Interact'97, Sydney, Australia, Chapman & Hall, pp. 389-396. BREWSTER, S.A., WRIGHT, P.C. AND EDWARDS, A.D.N. 1993. An evaluation of earcons for use in auditory human-computer interfaces. Proceedings of ACM/IFIP INTERCHI'93 (Amsterdam) ACM Press, Addison-Wesley, pp. 222-227. BREWSTER, S.A., WRIGHT, P.C. AND EDWARDS,, A.D.N. Experimentally derived guidelines for the creation of earcons. Adjunct Proceedings of BCS HCI'95, Huddersfield, UK, 1995, pp. 155-159. DIX, A., FINLAY, J., ABOWD, G. AND BEALE, R. 1993. Human-Computer Interaction. Prentice-Hall, London, HART, S. AND STAVELAND, L.1988. Development of NASA-TLX (Task Load Index): Results of empirical and theoretical research. In Human mental workload, Hancock, P. and Meshkati, N. (Eds.), North Holland B.V., Amsterdam, 139-183. REASON, J. 1990. Human Error. Cambridge University Press, Cambridge, UK.