Additional Key Words and Phrases: Fisheye menus, hierarchical menus, menu selection, focus+context interfaces, information visualization ...
Published in ACM Transactions on Computer-Human Interaction, Vol. 14, No. 2 (2007), Article 6. DOI = 10.1145/1275511.1275512. Preprint version.
Untangling the Usability of Fisheye Menus KASPER HORNBÆK University of Copenhagen and MORTEN HERTZUM Roskilde University ________________________________________________________________________ Fisheye menus have become a prominent example of fisheye interfaces, yet they contain several non-fisheye elements and have not been systematically evaluated. This study investigates whether fisheye menus are useful, and tries to untangle the impact on usability of the following properties of fisheye menus: the use of distortion, the index of letters for coarse navigation, and the focus-lock mode for accurate movement. Twelve participants took part in an experiment comparing fisheye menus with three alternative menu designs across known-item and browsing tasks as well as across alphabetical and categorical menu structures. The results show that for finding known items, conventional hierarchical menus are the most accurate and by far the fastest. In addition, participants rate the hierarchical menu more satisfying than the fisheye and multi-focus menus, but do not consistently prefer any one menu. For browsing tasks the menus differ with respect to neither accuracy nor selection time. Eye-movement data show that participants make little use of the non-focus regions of the fisheye menu, though they are a defining feature of fisheye interfaces. The non-focus regions are used more with the multi-focus menu, which enlarges important menu items in these regions. With the hierarchical menu, participants make shorter fixations and have shorter scanpaths, suggesting lower requirements for mental activity and visual search. We conclude by discussing why fisheye menus were inferior to the hierarchical menu and how both may be improved. Categories and Subject Descriptors: H.5.2 [Information Interfaces and Presentation (e.g., HCI)]: User Interfaces— Evaluation/methodology, Graphical user interfaces (GUI), Interaction styles (e.g., commands, menus, forms, direct manipulation), Screen design (e.g., text, graphics, color); I.3.6 [Computer Graphics]: Methodology and Techniques—interaction techniques General Terms: Design, Experimentation, Human factors Additional Key Words and Phrases: Fisheye menus, hierarchical menus, menu selection, focus+context interfaces, information visualization
________________________________________________________________________
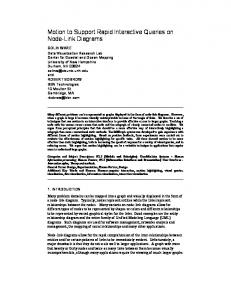
1. INTRODUCTION Fisheye interfaces show part of an information space at high magnification, while other parts are shown at low magnification to provide context (Furnas, 1981/1999, 1986). The simultaneous presence of focus and context information aims to support users in locating needed information by enabling them to scrutinize the focus region while maintaining an overview of the information space. An often-cited example of fisheye interfaces is Bederson’s fisheye menus (Bederson, 2000). Fisheye menus show a region of the menu in focus, gradually shrinking menu items before and after the focus region (see Figure 1). This way fisheye menus accommodate many menu items in a limited amount of screen space. This distortion is intended to be particularly useful for small displays and long menus. Long menus are becoming increasingly common as menus are also used for selecting data items, as opposed to functions. Examples include selection from long lists of fonts and selection of web sites from lists of favourites. On the web, long drop-down lists are frequently used in ways similar to menus, for example for selecting country names. The usability of fisheye menus for accessing these kinds of data has not been systematically evaluated, but a preliminary user study suggests that for browsing tasks, fisheye menus are preferred by users and may be faster than conventional hierarchical menus (Bederson, 2000). Menu selection, as studied in this paper, concerns long menus in which only some items can be shown at a readable size at any one time. Thus, to select a menu item users alternate between visual search to locate the menu item and eye-hand coordination to move the cursor and thereby make selected parts of the menu readable and eventually reach the target item. We expect that fisheye menus enable quick and smooth changes of the focus area while helping users maintain a sense of orientation within the entire menu. Fisheye menus, however, raise questions similar to those raised by other kinds of fisheye interfaces, for example, what is the benefit of gradually shrinking menu items in the transition area surrounding the focus region, do users overshoot objects when approaching and trying to select them (Gutwin 2002), are fisheye interfaces usable at magnifications that 1
yield considerable reductions in screen space (or accommodate much information), and do overview+detail interfaces perform as well or better? Bederson’s implementation of fisheye menus raises even more questions, because it includes non-fisheye elements such as an index of letters and a focus-lock mode. Further, Bederson’s implementation assumes a flat list of alphabetically ordered menu items, while menus are commonly organized into multiple levels. Thus, the determinants of the usability of fisheye menus and their scope of application remain unclear. This paper tries to untangle the impact on usability of various design decisions in fisheye menus. We present a user study on variations of fisheye menus, and use eye tracking to analyse users’ interaction with the menus. The study involves menu selections from both alphabetical and categorical menu structures and selection of both known items and items that must be identified by browsing the menu. We restrict our study to mouse-operated menus, and do not consider repeated selection of a menu item. After presenting detailed empirical evidence on the usability of fisheye menus, we discuss design ideas concerning fisheye interfaces in general. 2. WHEN AND WHY ARE FISHEYE INTERFACES USEFUL? Fisheye interfaces are a kind of focus+context interface that show an information space in a limited amount of screen space by displaying different parts at different magnifications. In Furnas’s original paper (Furnas, 1981/1999) fisheye interfaces were primarily discussed as a means of visualizing hierarchical tree structures, which include hierarchical menus. At about the same time, Spence and Apperley (1982) presented the bifocal display, an idea similar to Furnas’s work, and demonstrated how it could be applied to office workers’ in-trays and journal collections. Since then, fisheye interfaces have been most widely used in visualizations of 2dimensional data such as geographical maps (Sarkar & Brown, 1992; Baudisch, Good, Belotti, & Schradley, 2002; Gutwin & Skopik, 2003; Carpendale, Light, & Pattison, 2004) and graphs (Schaffer et al., 1996; Gutwin, 2002). Other applications include electronic documents (Hornbæk & Frøkjær, 2003; Baudisch, Lee, & Hanna, 2004) and calendars (Bederson, Clamage, Czerwinski, & Robertson, 2004). Usually, the non-linear magnification is defined by a degree-of-interest (DOI) metric consisting of two components: level of detail and distance to focus. Level of detail assigns a priori importance to the information elements, independently of the user’s interactions with them. Distance to focus makes the magnification dependent on the user’s current focus in the information space. When the user navigates the information by moving the focus, the fisheye interface changes dynamically, usually maintaining a smooth transition between the high magnification of the focus region and the lower magnifications used in the context area. In some cases, however, the DOI function uses only distance to focus, essentially changing every part of the information space in a similar manner. Fisheye interfaces with distinctly different visual features can be created by varying the DOI metric, often referred to as the lens (Carpendale & Montagnese, 2001). Leung and Apperley (1994) reviewed early work on the DOI metric; Keahey and Robertson (1997) described how to make complex magnifications with multiple foci. Skopik (2002) investigated the relationship between landmarks, which can be made visually salient by the level-of-detail component, and the level of magnification used in the distance-to-focus component. She found that increased magnification decreases participants’ ability to identify and use landmarks. Gutwin and Skopik (2003) compared a pyramid lens, a hemisphere lens, and a flat-topped hemisphere lens and found no significant differences in completion times at a steering task. However, the level of magnification had a significant effect: participants performed faster at a magnification level of two (twice normal size) than at both lower and higher
2
levels of magnification. Also, the three fisheyes interfaces were significantly faster than two overview+detail interfaces. While fisheye interfaces show the focus region in place, overview+detail interfaces are characterized by showing an overview of the information space separated from the detailed content. Evidence suggests that users react faster and more accurately when the focus region is shown in place, at least for steering tasks (Baudisch et al., 2002). Hornbæk and Frøkjær (2003) compared a fisheye interface and an overview+detail interface for reading electronic documents. With the fisheye interface, participants spent more time gaining an overview of the documents and less time reading the details. In terms of total time spent documents were read faster with the fisheye interface, but participants provided more accurate answers to essay tasks solved using the overview+detail interface. The fisheye and overview+detail interfaces were faster than a linear interface – the most common document interface in practical use – and also superior on most other aspects of usability. Several studies have compared fisheye interfaces with panning or full-zoom interfaces, which have no context region, and found that the context provided by fisheye interfaces is an advantage (Schaffer et al., 1996; Gutwin & Fedak, 2004a, 2004b). However, for some tasks very small context regions have been suggested (Zellweger, Mackinlay, Good, Stefik, & Baudisch, 2003; Baudisch et al., 2004). While the non-linear magnification of fisheye interfaces effectively addresses the space issue, it also distorts the presentation in ways that can cause usability problems. Distortion interferes with layout tasks (Gutwin & Fedak, 2004a), steering tasks (Gutwin & Skopik, 2003), and other tasks that require precise judgements about scale, distance, direction, or alignment. A particular problem is object targeting, which becomes difficult because the dynamic changes of the magnification make objects appear to move as the focus region approaches them. Gutwin (2002) found that participants’ target-acquisition times and error rates in fisheye interfaces increase with the level of magnification. In fact, a non-magnifying lens performed better than the magnifying ones, suggesting that the task was somewhat artificial because the full information space fitted onto the available screen space, making any use of fisheye lenses unnecessary. 2.1 The Case of Fisheye Menus Selecting items from menus is a common task in graphical user interfaces and it is becoming even more common as menus are used to select items such as country names in various web applications. Fisheye menus (Bederson, 2000), see Figure 1, have become a prominent example of fisheye interfaces, often mentioned as a successful application of the fisheye concept (Gutwin & Fedak, 2004b; Gutwin & Skopik, 2003; McGuffin & Balakrishnan, 2004). In Bederson’s implementation fisheye menus use a simple DOI metric that only depends on distance to focus, and thus assigns the same a priori importance to all menu items. This simple DOI metric is probably a result of an emphasis on alphabetically ordered menus. For menus with a categorical structure, Furnas’s original work (Furnas, 1981/1999) suggested a simple level-of-detail function for calculating a priori importance. In Bederson’s implementation, fisheye menus are defined by the position of the mouse and three parameters calculated from the screen height and the number of menu items: minimum font size, maximum font size, and focus-region length. The focus region is centred around the mouse, and all menu items in the focus region are displayed at the maximum font size. The transition from focus region to context is achieved by reducing the font size by one pixel for each menu item until the minimum font size is reached. The remaining menu items, all in the minimum font size, comprise the context. However, fisheye menus also contain two non-fisheye elements: 3
First, index of letters. When the user moves the mouse to a letter in the index on the left-hand side of the menu, the focus region is moved to the first menu item starting with that letter. This index enables users to quickly home in on a given part of the menu, even if the menu items in the context region are too small to be read. Efficient selection is further supported by the vertical position of the index letters; when the mouse is at an index letter, the menu items next to and below the mouse are those starting with that letter. Second, focus-lock mode. When the user moves the mouse to the right-hand side of the menu the focus region is locked, suspending dynamic changes of magnification. This focus lock enables users to freeze the position of a target menu item once they have come close to it and thereby circumvents the target-acquisition problem studied by Gutwin (2002). The focus lock is released when the user moves the mouse to the left-hand side of the menu. Bederson (2000) described an initial user study of fisheye menus, in which the subjective satisfaction and preferences of 10 participants were collected. In terms of satisfaction a hierarchical menu scored better than the fisheye menu, which in turn scored better than a scroll-bar menu and an arrow-bar menu. A ranking of the menus in terms of preference suggested that the hierarchical menu was preferred for goal-directed tasks, while fisheye menus were preferred for browsing tasks. In addition to the user study, timings on selecting targets in a 100-item menu and a 266-item menu were obtained from one expert user. The hierarchical menu was fastest, followed by the fisheye menu, and then the scroll-bar and arrow-bar menus. While these data are suggestive, Bederson noted the need for controlled empirical evaluation. 3. EXPERIMENT The purpose of the experiment is twofold. First, we want to obtain experimental data on the usability of fisheye menus. Second, we aim to untangle the impact on usability of the design choices in fisheye menus. We do this by having participants use four menus, while data on accuracy, selection time, satisfaction, and eye movements are collected. 3.1 Participants Twelve participants (3 female, 9 male) volunteered to take part in the experiment. Participants were on the average 29 years of age and all had normal, or corrected-to-normal, vision. They were either current or recently graduated students in computer science (9 participants) or library and information science (1 participant), or administrative officers at the authors’ institutions (2 participants). While all participants were well acquainted with hierarchical menus, none had previous experience with the three other menus used in the experiment. 3.2 Menu Data Sets In the experiment, two differently structured data sets provided the menu items. Both were taken from the Microsoft Encarta encyclopaedia, used in a previous study of menus (Larson & Czerwinski, 1998). The alphabetical data set contained 100 menu items ordered alphabetically, each containing the name of a randomly chosen entry in the encyclopaedia. The menu items in the alphabetical data set began with 23 different letters. Menus of alphabetically ordered items are similar to often used flat lists such as lists of countries and favourites. In the categorical data set, menu items were organized in three levels: four top-level categories, each with eight sub-menus that each contained eight menu items. Including items at the first and second levels, the categorical data set comprised 292 items. Participants chose among the 256 items at the third level. This data set is typical of tree structures such as web directories, tables of contents, and the start menu in Microsoft Windows. 4
An additional reason for including the categorical data set in the experiment is that Bederson (2000) did not discuss such data sets in the design of fisheye menus, or in the creation of tasks used in his evaluation. Note that the two menu data sets differ along several dimensions, for example with respect to structure as well as size. Thus, any performance differences between the two data sets cannot be attributed to individual dimensions, say their different sizes. Rather the menu data sets should be seen as two instances of menu structures that may be encountered in real-world activities. 3.3 Tasks The experiment involved two kinds of tasks. In known-item tasks, participants received a full description of the menu item they were to find; that is the name of the item and, for the categorical data set, its location in the category structure, for example “History → People in European History → Constantine 1”. This kind of task is similar to those employed in most studies of menu usage (e.g., Larson & Czerwinski, 1998; Aaltonen, Hyrskykari, & Räihä, 1998; Bederson, 2000), and resembles typical selection tasks where users know exactly what they are looking for and select it by navigating a menu. In browsing tasks, participants received a broader description of the target item. In some cases, participants were required to scan the entire menu. Examples of browsing tasks are “a description of a person’s life” (answered by selecting “Biography” in the alphabetical data set) and “Mongolian conqueror and founder of the Mongolian empire” (answered by “History → History of Asia and Australasia → Genghis Khan” in the categorical data set). The text describing each task was taken from either Microsoft Encarta or a dictionary in Danish, depending on which provided the clearest one-line definition. We aimed to find menu items for the browsing tasks that most participants would not know off hand, but would recognize in the menu. Browsing tasks are similar to the scenario tasks used by Norman and Chin (1988), the complex retrievals used by Pirolli, Card, and van der Wege (2003), and the dictionary-definition tasks used by Aaltonen et al. (1998). These tasks frequently occur in situations where users do not know the available choices or the exact labels of individual menu items. For both known-item and browsing tasks, exactly one menu item qualified as an answer to a task. Across tasks, the location of this correct answer was randomly distributed among all items in the menu. Menus as well as task descriptions were translated into the participants’ native language, Danish. 3.4 Menus As suggested above, fisheye menus include several design choices, each of which may impact usability. The experiment makes use of four menus to untangle the positive and negative impacts of those design choices. Figures 2, 3, and 5 show the menus. The fisheye menu works as described by Bederson (2000) and summarized in a previous section. The maximum font size was set at 11, and the focus length was 11. Thus, 11 items were visible at maximum font size. For the alphabetical data set the minimum font size was 5, for the longer categorical data set it was 1. Further, for the categorical data set, the index of letters showed the first two or three letters of the four top-level menu items. The overview menu consists of an overview showing an index of letters identical to that of the fisheye menu and a detail area showing the menu items. In contrast to the fisheye menu the overview menu makes no use of distortion. Thus, it contains no transition region and all menu items are shown at the same font size. Without
5
distortion the overview menu cannot show all menu items at the same time. Instead, the detail area shows menu items reflecting the position of the mouse relative to the length of the menu. If the mouse is, for example, positioned half way down the menu, the detail area shows the items that appear in the middle of the menu. The visual effect of this relationship between mouse position and detail-area content is that the menu items move toward the mouse (i.e., the menu scrolls upward when the mouse is moved downward, and vice versa). The tight coupling between the overview and the detail area is visualized by a field-of-view (Plaisant, Carr, & Shneiderman, 1995). The field-of-view is shown on the overview and indicates the currently visible details. When the mouse is in the left-hand side of the menu, the detail area and field-of-view are dynamically changed as the mouse moves so as to support quick movement among menu items. When the mouse is in the right-hand side of the menu, menu items do not move so as to support precise selection of menu items. This functionality is similar to the focus-lock mode of the fisheye menu. When the user enters the focus-lock mode, the field-of-view and index letters fade away. The principal difference between the overview menu and the fisheye menu is that distortion is replaced with scrolling the menu so that it shows menu items reflecting the current position of the mouse relative to the length of the menu. We expect that participants using the overview menu will do well without the distortion of the fisheye menu; in addition, we expect subjective satisfaction to be lower with the overview menu because of the somewhat counter-intuitive direction of movement of the menu items. The multi-focus menu has a focus region working similarly to that of the fisheye menu, including the focuslock mode. In addition, important menu items outside the focus region are shown at larger font sizes. Thus, the multi-focus menu extends the DOI metric of the fisheye menu with a priori importance. The intent behind the multi-focus menu is to increase the amount of information visible in the context region and thereby dispense with the need for an index of letters. Consequently, the multi-focus menu has no index of letters. For alphabetical menu structures, we assign a priori importance to the menu items marking the transition to items starting with a new letter. Thus, we choose as important those items that appear to the right of an index letter in the fisheye menu. The important items provide an index integrated with the actual menu. In the implementation of the multi-focus menu for the alphabetical data set, we make room for all important items, independently of the current mouse position, see Figure 2. Had screen space been sparser, we could have chosen to make visible only the important items close to the current mouse position. For categorical multi-focus menus, a vast number of design choices are involved in determining the importance of menu items. For example, how important are menu levels relative to each other, how should the importance of items close to the mouse be balanced against the a priori importance derived from the structure of the menu, and how much of the context region should be devoted to readable content? These questions essentially regard the DOI metric and its mapping to a visual structure. In our implementation, see Figure 3, we choose to have top-level items readable at all times, to provide some global context. Due to the large number of menu items, this is not possible for second-level items, so for those items we prioritize items close to the mouse. For third-level items, we use the same DOI calculations as for the fisheye menu. Figure 4 (top) illustrates this for one mouse position: the solid line shows the DOI component for level-one items, the dashed line shows the DOI component for level-two items, and the dotted line shows the DOI component for level-three items. These components are combined with the distribution of menu items to form the actual sizes of menu items shown in Figure 4 (bottom).
6
The principal difference between the multi-focus menu and the fisheye menu is that the index of letters is integrated in the context region by showing important menu items outside the focus region at larger font sizes. We expect the integration of the index of letters into the menu to be particularly useful for the categorical menu data set. The hierarchical menu differs from the fisheye, overview, and multi-focus menus by assuming a menu structured into multiple levels. It works like conventional cascading menus in graphical user interfaces and serves as a baseline in the experiment. Initially the hierarchical menu shows only the items at the top level but when the mouse is moved to one of these menu items a submenu is opened to the right of that menu item. The items in submenus can themselves be opened, until the bottom level of the menu structure is reached. Conversely, a submenu is closed when the mouse is moved to a different menu item at a level above the submenu. Thus, the hierarchical menu shows details along the path from the top level to the user’s current focus and hides all other menu items. This behaviour corresponds to what Furnas (1981/1999) termed a first-order fisheye view. In first-order fisheye views (1) the DOI metric of any menu item is the sum of its distances from the root of the menu and from the menu item that is currently in focus (i.e., DOI(x) = dist(x, root) + dist(x, focus) for any menu item x) and (2) menu items are shown when their DOI is at most dist(focus, root) + 2. In addition to this general familiarity between the hierarchical menu and the three other menus, there are several specific similarities. To fit the hierarchical menu to alphabetical data sets, Bederson (2000) added a top level with one-letter items. This top level resembles the index of letters in the fisheye menu in that the submenu associated with each one-letter item contains the menu items starting with that letter. Further, the menu items at the top level - that is, the items users initially inspect and choose among - are exactly the items that are assigned top a priori importance in the multi-focus menu. The principal difference between the hierarchical menu and the fisheye menu is that it replaces distortion with a top-down view where the content of the menu is revealed gradually through a sequence of choices among small numbers of items. Also, note that the average screen footprint of the hierarchical menu is smaller than that of the three other menus (alphabetical data set: 30000 square pixels; categorical data set: 55000 square pixels; three other menus: 132000 to 170000 square pixels). We expect the hierarchical menu to be more accurate than the fisheye menu, but conversely that participants rate it lower in terms of subjective satisfaction. 3.5 Design The experiment employed a within-subjects design with the factors menu (fisheye, overview, multi-focus, hierarchical), menu data set (alphabetical, categorical), and task (known item, browsing). The experiment was divided into two blocks. In the first block, a participant used each of the menus in turn, with each menu giving access to one of the menu data sets. The combinations of menus and data sets were selected using three GrecoLatin squares, one for each group of four participants. The Greco-Latin squares ensure that each combination of menu and data set occurs only once for a participant, and that each combination of a menu and a data set occurs the same number of times in each column. In the second block, each participant used the combinations of menus and data sets not yet tried, the order determined randomly. Table I shows the design. For each menu in each block, 25 known-item and 5 browsing trials were performed; the rationale for choosing these numbers was that participants would use an equal amount of time on each kind of task. The order of trials was determined at random. Thus, each of the 12 participants performed a total of 4 × 2 × 25 = 200 known-item trials and 4 × 2 × 5 = 40 browsing trials. 7
We do not claim that participants became proficient in using the menus because each participant performed only 60 trials with each menu. The number of trials, however, is similar to that of other studies of menus (Norman & Chin, 1988), and larger than studies of comparable data sets (Larson & Czerwinski, 1998) and of some fisheye interfaces (Bederson et al., 2004; Gutwin & Fedak, 2004a, 2004b; Hornbæk & Frøkjær, 2003; Schaffer et al., 1996). Further, a check of the data shows no effect of block on selection time, F(1, 11) = 3.4, p > .05, and no interaction between block and menu, F(1, 11) = 0.11, p > .05. Below we thus include all trials in the analysis of the data. 3.6 Procedure Upon arriving at the lab, participants were told the nature of the study, asked questions about their background, and introduced to the tasks and the menus. The introduction consisted of an oral explanation of each of the four menus and one to two minutes practice with each menu to complete tasks similar to those used in the experiment. At the beginning of the actual experimental session, the eye tracker was calibrated so that it accurately captured the participant’s line of gaze. After calibration the participants used the four menus, with automatic administration of the tasks. After the first block of selections, participants were allowed a break. After the break, the eye tracker was recalibrated and participants performed the second block of selections. During the second block participants concluded their use of each menu by filling out a questionnaire about their impressions of that menu. The questionnaire consisted of the short form of QUIS (Shneiderman & Plaisant, 2005) and five questions from the ISO 9241-9 standard for testing pointing devices, using the modifications given by Douglas, Kirkpatrick, and MacKenzie (1999). Table II shows the questions. After completing the second block, participants ranked the menus in order of preference. On the average, the entire experiment lasted 70 minutes per participant. 3.7 Dependent Measures and Descriptive Data We used the following dependent measures: •
Accuracy, as determined from the logged menu selections
•
Time, measured as the average time to select a target menu item from the activation of the menu to the selection of a menu item
•
Satisfaction, measured with the questions from QUIS and ISO 9241-9
•
Preference, measured as the average rank of preference expressed by participants at the end of the experiment In addition to the above measures, participants’ eye movements were recorded with an eye-tracker from LC
Technologies (www.eyegaze.com, 2004), sampling at 60 Hz. Acceptable calibration required participants’ eye gaze to be within 0.15 inch of the 13 calibration targets. Eye fixations were identified using a dispersion-based algorithm with a minimum fixation duration of 100 ms and a deviation threshold of 0.5 degrees of visual angle, as in, for example, Hornof and Halverson (2003). At a viewing distance of 60-65 cm this deviation threshold corresponded to an area with a diameter of 38 pixels or about 11 mm on the 1024×768 screen displaying the menus. 4. RESULTS
8
Below we compare the usability of the menus, discuss observations we made during the experiment, describe participants’ eye movements, and analyse usage patterns. 4.1 Usability—Accuracy For known-item tasks participants achieved 97% accuracy, see Figure 6. Before conducting the statistical tests reported below, the average accuracy of trials within a task was arc sine transformed because percentage values cannot be assumed to be normally distributed (Fleiss, 1981). A repeated-measures analysis of variance on these data showed a significant difference between menus, F(3, 9) = 5.76, p < .05. Linear contrasts between menus (a statistical technique for focused comparisons, see Rosenthal & Rosnow, 1985) showed that known-item tasks were solved significantly more accurately with the hierarchical menu (M = 100%, SD = 5) than with the three other menus (fisheye: M = 96%, SD = 20; overview: M = 95%, SD = 22; multi-focus: M = 97%, SD = 18), all p < .05. We found no significant interaction between menu and menu data set, F(3, 9) = 0.21, p > .5; nor a significant effect of menu data set, F(1, 11) = 0.11, p > .5. Participants’ errors in selecting known-item targets seemed mostly to be slips in hitting the target item: 61 of the 75 errors were misses of the target by one menu item. For browsing tasks, 77% of the trials were correctly answered, 13% were incorrectly answered, and participants gave up on 10% of the trials. In the following, only the correctly answered trials qualified as accurate. We did not find a significant difference between menus, F(3, 9) = 0.80, p > .5, see Figure 7. We found a difference between menu data sets, where the alphabetical data set showed higher accuracy (M = 81%, SD = 39) than the categorical data set (M = 73%, SD = 45), F(1, 11) = 9.37, p < .05. This was expected as the number of items and complexity of organization are greater with the categorical data set. 4.2 Usability—Selection Time Before analysing selection times for known-item tasks we removed trials more than three inter-quartile ranges above the upper quartile, that is 22 trials where participants used more than 24s to select the target. Figure 8 shows selection times for the remaining 2378 trials. We found a significant difference in selection time between menus, F(3, 9) = 58.58, p < .001. Linear contrasts showed that the hierarchical menu (M = 4.58s, SD = 2.48) was faster than the three other menus (fisheye: M = 7.10s; SD = 4.49; overview: M = 7.10s, SD = 4.26; multifocus: M = 7.19s, SD = 4.36), all p < .001. The practical significance of this effect is large, as the other menus are around 55% slower than the hierarchical menu (η2 = .95). A significant difference between menu data sets was also found, F(1, 11) = 319.79, p < .001. With the alphabetical data set participants used on average 3.8s (SD = 0.16) to select a target, while for the categorical data set they used on average 9.2s (SD = 0.43). We also found an interaction between menu and data set, F(3, 9) = 38.36, p < .001. The hierarchical menu performed even better compared to the other menus when using the categorical data set (other menus 58% slower), rather than the alphabetical data set (other menus 54% slower). In addition, a Bonferroni-adjusted post hoc test suggested that the fisheye menu (M = 3.82s, SD = 1.66) was faster than the overview menu (M = 4.49s, SD = 2.21) for the alphabetical data set, p < .05. For browsing tasks, we identified and removed nine outliers using the same method as for known-item tasks. Figure 9 shows the selection times. We found no significant overall differences in selection time between menus, F(3, 9) = 0.65, p > .5; and only a marginally significant interaction between menu and menu data set, F(3, 9) = 3.13, p =.08. This marginal difference seemed to cover an important result. Selection times with the
9
hierarchical and overview menus differed only 31% between menu data sets. For the fisheye and multi-focus menus the difference was 89%. This dissimilarity between the menus was significant, F(1, 11) = 7.33, p < .05. 4.3 Usability—Subjective Satisfaction and Ranking Table II, Figure 10, and Figure 11 summarize the answers to the questionnaires administered to participants. An overall multivariate analysis showed a significant difference between menus, Wilks’ λ = 0.16, F(33, 65) = 1.71 , p < .05. With the experiment-wide error thus protected, we performed individual analyses of variance for nine of the questions and compared the menus using linear contrasts. We did not analyse questions g and h in Table II as they do not have end-points with least or most desirable ratings. For the question about how frustrated or satisfied participants were, we found a significant difference between menus, F(3, 9) = 4.03, p < .05, with the hierarchical menu being considered more satisfying than the fisheye and multi-focus menus. For the question about whether the menus were considered rigid or flexible we also found a significant difference, F(3, 9) = 8.39, p < .01. The hierarchical menu was considered more rigid than the three other menus. Finally, the question concerning whether accurate pointing is easy or difficult was also answered differently between menus, F(3, 9) = 4.65, p < .01, showing that the multi-focus menu was considered significantly less accurate than the hierarchical and overview menus (p < .05). The fisheye menu was considered marginally less accurate than the hierarchical and overview menus (p = .07 in both cases). Participants’ preference rankings of the menus showed few differences between menus. The hierarchical and overview menus were given a median rank of 2; the fisheye and multi-focus menus a median rank of 3. Any of the four menus had at least two participants that ranked the menu 1 (i.e., favoured it) and at least two others that ranked it 4 (i.e., disfavoured it). Overall, the rankings of menus were not significantly different, Friedman test χ2(3, N = 12) = 2.14, p > .5. 4.4 Observations Made During the Experiment Three recurring behaviours were observed during the experiment. First, at least eight participants sometime during the experiment made comments like “oops” or “damn—miss click” when they in the final phase of target selection accidentally changed the selection away from the menu item they intended to select. This happened mostly for menus other than the hierarchical menu, supporting the accuracy data described above. Second, the partition of the overview, fisheye, and multi-focus menus into a focus-lock and a normal-section mode posed a number of problems to participants. Although visually indicated, these modes seemed to confuse participants. Especially when in focus-lock mode and accidentally crossing the centre of the menu, at least seven participants expressed confusion when, as a consequence, the focus area was dynamically re-centred to the mouse position. Third, when in focus-lock mode many participants wanted to keep scrolling up or down toward an item they had seen before entering focus-lock mode. However, in the fisheye and multi-focus menus, items visible in small font moved out of the menu as the items in the transition region expanded. 4.5 Eye Movements Before analysing the eye-movement data we removed trials corrupted by noise; that is, 692 trials where participants correctly selected the target menu item but the eye-movement data contained no fixation on this menu item. As in the previous analyses we also removed outlier trials. The remaining 2161 (75%) trials were about evenly distributed across menus as well as other experimental conditions. An overall multivariate analysis 10
of four basic eye-movement measures showed a significant difference between menus for both known-item tasks, Wilks’ λ = .12, F(12, 79.66) = 8.39, p < .001, and browsing tasks, Wilks’ λ = .47, F(12, 79.66) = 2.22, p < .05. With the experiment-wide error thus protected, we performed individual analyses of variance for all four measures: rate of fixation, fixation duration, saccade duration, and scanpath length. For known-item tasks, 1756 trials were included in the analysis, see Table III. As the number of fixations was highly correlated with selection time (r = .94, p < .01), we calculated the rate of fixation to obtain a measure independent of selection time. Rate of fixation, that is the number of fixations per second, differed significantly between menus, F(3, 9) = 40.89, p < .001. Bonferroni-adjusted post hoc tests indicated that participants made more fixations per second with the hierarchical menu than with the three other menus. We found no interaction between menu and data set, F(3, 9) = .16, p > .9. As the hierarchical menu enables participants to fixate at a higher pace while completing trials, fixations with this menu must be shorter or more closely spaced. Fixation duration differed significantly between menus, F(3, 9) = 17.83, p < .001. Bonferroni-adjusted post hoc tests indicated that fixations were shorter with the hierarchical and multi-focus menus than with the fisheye and overview menus. There was no interaction between menu and data set, F(3, 9) = 1.75, p > .2. For saccade duration we found no significant difference between menus, F(3, 9) = 1.14, p > .3. Scanpath length, the sum of the lengths of all saccades in a trial, differed significantly between menus, F(3, 9) = 7.82, p < .01. Bonferroni-adjusted post hoc tests indicated that participants’ scanpaths were shorter with the hierarchical menu than with the multi-focus and overview menus, suggesting that participants engage in less visual search with the hierarchical menu. For scanpath length we found no interaction between menu and data set, F(3, 9) = .11, p > .9. For browsing tasks, 405 trials were included in the analysis, see Table III. We found a marginally significant difference between menus for fixation duration, F(3, 9) = 3.80, p = .05. Bonferroni-adjusted post hoc tests indicated that fixations may be longer with the fisheye menu than with the hierarchical and multi-focus menus. There was no interaction between menu and data set, F(3, 9) = 1.40, p > .3. Also, we found no significant differences between menus for rate of fixation, saccade duration, and scanpath length, Fs(3, 9) = 1.80, 1.55, and 1.67 (all p > .2). This accords with the absence of differences in selection time and suggests that for browsing tasks the manual operation of the menus constitutes a smaller part of task completion. We were particularly interested in comparing participants’ fixations on different regions of the fisheye and multi-focus menus to get an indication of the contribution of these regions to participants’ performance with the menus. For known-item trials, Table IV shows no significant difference between the fisheye and multi-focus menus for number of fixations on the focus region, F(1, 11) = .71, p > .4, but that participants fixated the transition region and the context region more times with the multi-focus menu than with the fisheye menu, Fs(1, 11) = 57.74 and 31.75 (both p < .001). These differences suggest that participants made use of the additional information about the a priori importance of menu items, provided in the transition and context regions of the multi-focus menu. Interactions between menu and data set indicated that both effects were more pronounced for the categorical than for the alphabetical data set (transition region: F(1, 11) = 24.74, p < .001; context region: F(1, 11) = 16.64, p < .01). One reason for these interactions may be that the categorical data set contains more menu items, increasing participants’ need for information about the location of the focus region within the
11
menu. Another reason may be that the categorical data set provides better candidates for items with a priori importance than the alphabetical data set. For browsing trials, Table V shows the same relative distribution of fixations and the same differences as for known-item trials. That is, no significant difference between the fisheye and multi-focus menus for number of fixations on the focus region, F(1, 11) = .68, p > .4, and more fixations on the transition region and context region with the multi-focus than the fisheye menu, Fs(1, 11) = 25.31 and 26.48 (both p < .001). For the transition region an interaction between menu and data set indicated that the effect is more pronounced for the categorical than for the alphabetical data set, F(1, 11) = 9.01, p < .05. For the context region we found no such interaction, F(1, 11) = 2.42, p > .1. The relative distribution of fixations on the focus region, transition region, context region, and index of letters is virtually identical for known-item and browsing tasks (see Figure 12). Interestingly, the transition and context regions of the fisheye menu are used sparingly and account for only 9-10% of the fixations on this menu. While the multi-focus menu has no index of letters, the index of letters accounts for 23% of the fixations on the fisheye menu. We found no significant difference in number of fixations on the index of letters between the fisheye and overview menus (known-item trials: F(1, 11) = .00012, p > .9; browsing trials: F(1, 11) = .71, p > .4). 4.6 Usage Patterns Participants’ use of the menus are further analysed below for correct, non-outlier known-item trials (N = 2305). These analyses are based on logged data about mouse movements and menu selections. Participants’ selection times with the fisheye, multi-focus, and overview menus show a bell-shaped distribution, meaning that items at the beginning and end of the menus were selected much faster than items in the middle, F(2, 10) = 38.28, p < .001. Linear contrasts indicated that the first ten percent of the menu items were selected the fastest (M = 5.23s, SD = 3.62), then the last ten percent of the menu items (M = 6.27s, SD = 4.48), and finally selection of middle items was slowest (M = 7.46s, SD = 4.31), all p < .05. Fast selection of the first menu items is expectable. A reason for the fast selection of the last items may be that these items are in an area that is easy to identify; selecting the menu item ‘Zen’ with the alphabetical data set is almost certain to involve some of the last menu items, facilitating a decision to make a fast coarse movement toward the end of the menu. To study selection times further, each trial was divided into phases of (1) getting close to the target, and (2) trying to select the target while being close to it. Table VI and Figure 13 show how quickly participants got within 20 pixels of the target, and show a significant difference between menus, F(1, 11) = 22.19, p < .001. Participants using the hierarchical menu took longer to get close to the target menu item compared to the other menus (all p < .05). Given the lower selection times for the hierarchical menu reported earlier, this implies that more time was spent on or close to the target menu item using the fisheye, multi-focus, and overview menus (see also Table VI). The time spent close to the target with those menus seems to be used for fine-tuning the position of the mouse in order to acquire the target. Participants on average move 107 pixels (SD = 74) while close to the target with the fisheye, multi-focus, and overview menus, compared to 51 pixels (SD = 31) with the hierarchical menu. The focus lock of the fisheye, multi-focus, and overview menus shifts the balance between facilitating quick movements of the focus area and accurate movements within the focus area. The focus-lock mode was widely 12
used and significantly improved the accuracy of selections; the improvement was around 5% (no focus-lock use: M = 93%, SD = 26; focus-lock use: M = 98%, SD = 13), p < .05. This improvement was, however, associated with longer selection times (no focus-lock use: M = 6.0s, SD = 4.0; focus-lock use: M = 7.9s, SD = 4.4). One reason for the higher selection times appears to be an occasionally ineffective use of the focus lock. In trials (i.e., one individual solution to a task) where participants used the focus-lock mode they did so an average of 1.18 times (SD = 0.52). This finding accords with the observation that participants sometimes had to leave the focus-lock mode because an item of interest was pushed out of view as a result of the expansion of menu items close to the mouse. Another reason is that participants may choose to enter the focus-lock mode only after having faced difficulties in acquiring the target. The time penalty associated with the focus lock suggests that the best time to make the shift to focus-lock mode was not obvious to participants. Finally, note that the distances to targets vary between menus. For the fisheye, overview, and multi-focus menus the average distance to the target menu item is half the height of the menu, 348 pixels. For the hierarchical menu, the distance has both a vertical and horizontal component, and depends on the data set layout as well as the width of menu items. For the alphabetical data set, the average distance is 246 pixels (SD = 121); for the categorical data set it is 331 pixels (SD = 28). 5. DISCUSSION 5.1 The Superior Performance of the Hierarchical Menu The hierarchical menu was intended to form the baseline of the experiment, yet it performed better than the three other menus, especially for known-item tasks. Compared to the other menus, the hierarchical menu was more accurate, participants rated it as being more satisfying, and selection times were shorter. The duration of participants’ fixations and the length of their scanpaths were also shorter with the hierarchical menu. One explanation for these results is that while participants using the hierarchical menu take more time getting close to the target menu item, they take substantially less time selecting it. Getting close to a menu item is slow with the hierarchical menu because of the changes required in the direction of mouse movement, the small delay before menu items at lower levels expand, and the laborious backtracking necessary to correct erroneous selections. With the hierarchical menu, however, participants spend only 22% of the selection time within 20 pixels of the target menu item, and as selection time for the hierarchical menu is shorter than for the other menus the absolute difference in time spent close to the target is about 1:3. This suggests that the larger selection height (i.e., height in motor space) and stable position of menu items are central to the usability of the hierarchical menu. Notably these properties are achieved within a smaller average screen footprint and by a DOI metric that hides many menu items, rather than merely shrinking them. Conversely, the fisheye, overview, and multi-focus menus succeed in facilitating quick, coarse navigation, but at the price of making the final target acquisition more difficult: items are moving and the number of pixels in motor space from which an item must be selected is lower than with the hierarchical menu. With the fisheye, multi-focus, and overview menus participants perform 20-21% of the cursor movement within 20 pixels of the target menu item, but this cursor movement accounts for 41-46% of the selection time. The more critical component of participants’ performance with these menus may thus relate to homing in on and acquiring menu items. Our results concerning the hierarchical menu may be seen as confirming the applicability of Fitts’s law (Fitts, 1954) for modelling performance differences between menus. For the categorical data set, the distance
13
from the top of the menu to the target menu item is similar across menus; for the alphabetical data set the distance is lower for the hierarchical menu compared to the other menus. Further, the width of menu items in the hierarchical menu is always equal to the menu-item height; for the other menus it is given by the relation between the height of the menu and the total number of menu items. This implies a selection height of about one half of the menu-item height for the alphabetical data set and about one fifth for the categorical data set. Taken together the distance to and width of menu items suggest that selection with the non-hierarchical menus has a much higher index of difficulty, usually calculated as log2 (distance / width + 1) (MacKenzie, 1992). While some aspects of participants’ performance thus comply with Fitts’s law, we hesitate to interpret our results in that way. First, visual scanning and deciding where to navigate are important elements of performance, even for known-item tasks, but are not modeled by Fitts’s law. Second, movement in the hierarchical menu consists of both vertical and horizontal components, making a combination of Fitts’s law and the steering law a more apt choice of model for the hierarchical menu (Ahlström, 2005). A final explanation why participants perform well with the hierarchical menu is that it simplifies navigation. With the fisheye and overview menus, participants made longer fixations, suggesting increased mental activity (Goldberg & Kotval, 1999) compared with the hierarchical menu. Also, participants’ scanpaths were longer with the multi-focus and overview menus, indicating more visual search than with the hierarchical menu. Reasons for this could include (a) the need with non-hierarchical menus to determine or remember which part of the menu structure one is currently in and (b) difficulties operating the focus-lock mode. While these explanations are somewhat speculative, they are supported by participants’ comments after the experiment and by their usage patterns. For browsing tasks, the participants’ performance with the hierarchical menu was similar to their performance with the other menus. As the variability of selection times was large across browsing tasks, and because of lower statistical power for comparisons within browsing tasks, it is not surprising that we find few differences between menus for these tasks. Pirolli et al. (2003) investigated the interaction between information scent and browsers, including a hyperbolic tree browser, and found that the hyperbolic browser performed best with high information scent. One could speculate that the multi-focus menu would perform better than the fisheye menu for low-scent tasks (i.e., tasks where the path from the top level of the menu to the target is not obvious) because more information on alternative paths is available. Similarly, the hierarchical menu could do better than the non-hierarchical menus for high-scent tasks (i.e., tasks where the path from the top level of the menu to the target is obvious) because there should be less need for backtracking. Further work is needed to examine this speculation. An argument could be made that our results merely show that inexperienced users of the fisheye menu (and its variants) are slow; they do not show how proficient users would perform. As noted earlier, our experiment is based on 60 trials per menu per participant. Obviously, performance improvements can be expected as participants gain proficiency, in particular for menu types that participants have not previously encountered. Nevertheless, we find that the sweeping differences in task completion times (and the statistical size of these differences) make it improbable that the fisheye menu and its variants would come close to the performance of the hierarchical menu. The remainder of this section will discuss various improvements of fisheye menus and their variants. We believe that such a discussion is useful because it helps determine whether fisheye menus may be substantially improved and what the implications of our findings are for other focus+context interfaces. In
14
terms of general recommendations our results do, however, indicate that practitioners should stick with hierarchical menus. 5.2 Comparing Fisheye, Overview, and Multi-focus Menus Fisheye and multi-focus menus performed similarly in terms of accuracy, selection time, satisfaction ratings, and preference. The eye-movement data show that participants made more use of the context and transition regions with the multi-focus menu than with the fisheye menu, particularly for the categorical data set. In accordance with these findings some participants commented that they appreciated the readable menu items outside the focus region in the multi-focus menu. We believe the multi-focus menu is particularly suited for categorical data sets because the non-leaf menu items provide obvious candidates for items with a priori importance. Note, however, that in this study we cannot unequivocally attribute differences between the categorical and the alphabetical data set to their different structure as the two data sets also differ in terms of length. The usability of fisheye menus rests on their ability to enable users to accomplish two objectives quickly, accurately, and with satisfaction: (1) establishing and maintaining an overview of a menu and (2) homing in on target items. In the fisheye and multi-focus menus, the context region is directed toward the former objective and the focus region toward the latter. We assigned about 25% of the contents of these menus to the focus region, but it is an open and likely task-dependent issue how screen space should optimally be divided between focus and context. For the fisheye menu, the non-focus regions take up much space compared to how little participants looked at them, yet these regions are a defining feature of fisheye menus. The multi-focus menu enriches the context and transition regions by enlarging non-leaf items. Thereby, the multi-focus menu moves beyond the unreadable information making up the context regions of many fisheye interfaces, cf. Hornbæk and Frøkjær (2003). Displaying important menu items at larger font sizes is a versatile solution, which may be used with categorical data sets with any number of levels. In contrast, the index of letters is primarily suited for alphabetical and twolevel data sets. In spite of its lack of an index of letters, the multi-focus menu performed similarly to the fisheye menu, suggesting that the enlarged menu items provide an equally useful overview of the menu. The overview menu investigates a different way of exploiting the fact that participants make little use of the non-focus regions of the fisheye menu. In the overview menu, support for providing an overview is restricted to the index of letters and the focus region is effectively extended to the entire height of the menu. This dispenses with any distortion but does not lead to significant changes in speed and accuracy relative to the fisheye menu. Whether the idea of dispensing with distortion will work in other circumstances (e.g., 2D or for very large data sets) is unclear. Our eye-movement data suggest, however, the possibility that dispensing with just the transition region, but keeping some context, may work in other circumstances. 5.3 Relation to the Study by Bederson (2000) Bederson’s (2000) preliminary user study provides satisfaction data from five computer-science students, roughly similar to the participants in our study, and five administrative staff without programming experience. For computer-science students the average satisfaction rating of the fisheye and hierarchical menus was about the same. The administrative staff rated the hierarchical menu higher than the fisheye menu. In our study participants rated the hierarchical menu more satisfying and marginally more accurate than the fisheye menu,
15
which was in turn rated more flexible than the hierarchical menu. It appears that the satisfaction ratings of the two studies are rather similar. Bederson also obtained timings from one expert user of fisheye menus. An item from the middle of the menus was selected ten times and the fastest time recorded. Bederson found the hierarchical menu slightly faster than the fisheye menu. In contrast, we found the hierarchical menu overwhelmingly faster than the other menus for known-item tasks. One reason that may contribute to explaining this difference in results is that Bederson used the fastest time across 10 trials whereas we used the average time across 50 trials. Another reason may be differences between Bederson’s expert user and our participants who had no prior experience with fisheye menus. Whereas Bederson (2000, p. 224) states that “the Hierarchy menu should be used cautiously if at all, and only when it is clear that users know exactly what they are looking for”, we find that the hierarchical menu provides superior accuracy and selection times for known-item tasks and performs no worse than the other menus for browsing tasks. In terms of satisfaction some participants did, however, express that they considered browsing tasks particularly difficult with the hierarchical menu. 5.4 Improved Designs of the Menus For the four menus included in this study, the larger the selection height of menu items, the lower the selection time. The selection height of menu items that the user can select may be increased for non-hierarchical menus by setting it to zero for non-leaf menu items. These menu items would then move past the mouse if the user tries to select them. With the categorical data set, this would save around 90 pixels (36 menu items, each with a selection height of 2 to 3 pixels) but introduce slight jerks in the motion of the menu items. Because the height of the menu is fixed and all menu items should be selectable within that height it is not easy to increase selection height further, if considering only vertical movements. Any speed-dependent changes of selection height are impossible: If, for example, selection height increases when the user moves the mouse slowly, then items at the end of the menu become unselectable if the user makes a continued slow movement toward the end of the menu. However, it could be possible to use both horizontal and vertical movement for selection, for example by a matrix or cone layout of the menu items (i.e., variants of spatial menus, see Norman 1991). Another improvement of the non-hierarchical menus could be based on hiding rather than shrinking information in the context region. This would make the DOI metric of the non-hierarchical menus more similar to that of the hierarchical menu and free up additional display space for menu items with higher a priori importance. Our data suggests that homing in on and acquiring menu items must be improved for the non-hierarchical menus to perform as well as the hierarchical menu. Finding a better design of the focus-lock mode appears essential to achieving this. Our data shows that the binary nature of this mode caused participants problems. A simple idea would be to use a continuum instead. When the mouse is moved toward the right-hand side of the menu, the selection height of menu items would increase toward a maximum of their visual height. A more elegant solution would utilize a quasimode (Raskin, 2000) by simply entering the focus-lock mode when the user presses the mouse button. This would lessen the possible confusion of modes by turning the focus lock on when users are about to complete their selection, thereby enabling any final adjustments of the mouse position to be made at maximum selection height before users release the mouse button to select the target menu item. The hierarchical menu may be improved in several ways. The Java implementation used in this experiment immediately closes a submenu when the mouse leaves it, and immediately updates which submenu is displayed 16
if the mouse is moved to a new menu item. Microsoft Windows, for example, inserts a small delay before doing so, preventing users from accidentally closing or changing submenus. Perhaps hierarchical menus could also benefit from some of the ideas used for increasing the number of simultaneously visible menu items in the nonhierarchical menus. Submenus could, for example, reveal more of their contents by dynamically expanding two levels of the menu structure in response to cursor movements. McGuffin, Davison, and Balakrishnan (2004) use such an expand-ahead scheme in a tree browser, expanding subfolders and their content as space allows. Expand-ahead could also be applicable to hierarchical menus, probably eliminating some need for backtracking. 5.5 General Implications for Fisheye Interfaces To put our results in perspective, we briefly reflect on the implications of our results for fisheye and focus+context interfaces other than menus. First, many fisheye interfaces in the literature, including fisheye menus, achieve low information densities in their context regions and thus do not provide much global context, contrary to the aims of fisheye interfaces. We suggest making the context region of the interfaces more informative by including more readable or otherwise useful information. Our multi-focus menu is one example of this; the interface presented by Jakobsen and Hornbæk (2006) another. Second, designers of fisheye and focus+context interfaces should consider giving up the widespread idea that the context region must show the entire information space. The hierarchical menu, which may be thought of as a fisheye interface, displays only selected parts of the information space. Eliding some information may entail either simpler interfaces or interfaces with more room for displaying important parts of the context. Third, the distortion of the information in the transition region may be more confusing to users in other fisheye interfaces, compared to fisheye menus in which the distortion merely entails a gradual reduction of the font size. This suggests that the transition region may be used even less for these interfaces and should probably not consume much display space. Fourth, as the information space becomes larger the need for global context is likely to increase. While very high magnifications have been achieved in prototypes (e.g., Carpendale et al., 2004), experiments with fisheye interfaces are usually performed at lower levels of magnification. Whether fisheye menus and other focus+context interfaces perform relatively better at high magnifications (e.g., > 10) remains an object of further study. For magnifications between two and five as in the present experiment, fisheye menus are inferior to the hierarchical menu. 6. CONCLUSION Fisheye menus show a region of the menu at high magnification, while items before and after that region are shown at gradually reduced sizes. While fisheye menus thus provide both detail and context information, they share with other fisheye interfaces a number of potential problems regarding their navigation. In addition, Bederson’s original paper on fisheye menus introduced design choices, such as an index of letters and a focuslock mode, whose impact on usability is unclear. Consequently, the focus of the current paper was to untangle the impact on usability of various design decisions in fisheye menus. This was done by comparing fisheye menus with an overview menu, a multi-focus menu, and a baseline hierarchical menu. The design decisions investigated in this paper concerned three principal aspects of fisheye menus:
17
•
Distortion by means of focus, transition, and context regions (fisheye and multi-focus menus) was compared to an overview+detail design (overview menu) and to gradually revealing successive menu levels (hierarchical menu).
•
Landmarks were made visible by an index of letters (fisheye and overview menus), by showing some items in the context and transition regions at larger font sizes (multi-focus menu), and by dividing the menu into a top-level menu with submenus (hierarchical menu).
•
The balance between coarse-grained navigation and fine-grained positioning was facilitated by a focus lock (fisheye, overview, and multi-focus menus) or needed no facilitation (hierarchical menu). Twelve participants selected menu items using the four different menus and two different data sets. For
known-item tasks, the hierarchical menu was more accurate and faster than the three other menus. While participants had limited time to gain proficiency with the menus, the differences in time used to select an item are so large between the hierarchical menu and the other menus that we expect it to hold also for expert users. Compared to the fisheye menu, participants rated the hierarchical menu more satisfying to use, but also considered it rigid. No menu, however, was consistently preferred by participants. The focus-lock mode, which aims to help users acquire menu items, proved insufficient to facilitate fine-grained movement: participants using the fisheye menu spent about three times as much time close to menu items compared to the hierarchical menu. A further advantage of the hierarchical menu is that its screen footprint is smaller than that of the other menus. For browsing tasks, which are typical of situations where the user is not perfectly familiar with the menu, there were no differences between menus in the speed and accuracy with which menu items were selected. Eye-movement data showed that the transition and context regions of the fisheye menu were not used much. With the multi-focus menu readable menu items in the transition and context regions of the menu were used more. Eye-movement data also showed that with the hierarchical menu participants’ fixations and scanpaths were shorter, suggesting that the mental demands of the hierarchical menu were lower. The difference in selection time and several of the differences in eye movements were more pronounced for the longer, categorically structured data set than for the shorter, alphabetically structured data set. This indicates either that hierarchical and to some extent multi-focus menus are particularly suited to categorical data sets or that fisheye, overview, and to some extent multi-focus menus do not scale well to long data sets. In the present study fisheye menus, as well as our design variations, were inferior to hierarchical menus. A number of further design variations are possible, including that fisheye menus could display more information in the context region and that hierarchical menus could include functions allowing for fast, coarse navigation as in fisheye menus. Unless substantially improved, fisheye menus will, however, remain slower and less accurate than hierarchical menus. ACKNOWLEDGEMENTS Ben Bederson was most helpful in lending us his implementation of fisheye menus and for commenting on a draft of this paper. Kevin Larson and Mary Czerwinski are acknowledged for lending us the data sets from their 1998 study. Special thanks are due to the participants in the experiment.
18
REFERENCES AALTONEN, A., HYRSKYKARI, A., & RÄIHÄ, K. J. (1998). 101 spots, or how do users read menus? In ACM Conference on Human Factors in Computing Systems (pp. 132-139). New York, NY: ACM Press. AHLSTRÖM, D. (2005). Modeling and improving selection in cascading pull-down menus using Fitts' law, the stering law and force fields. In ACM Conference on Human Factors in Computing Systems (pp. 61-70). New York, NY: ACM Press. BAUDISCH, P., GOOD, N., BELOTTI, V., & SCHRADLEY, P. (2002). Keeping things in context: a comparative evaluation of focus plus context screens, overviews, and zooming. In ACM Conference on Human Factors in Computing Systems (pp. 259-266). New York, NY: ACM Press. BAUDISCH, P., LEE, B., & HANNA, L. (2004). Fishnet, a fisheye web browser with search term popouts: a comparative evaluation with overview and linear view. In International Working Conference on Advanced Visual Interfaces (pp. 133-140). New York, NY: ACM Press. BEDERSON, B. (2000). Fisheye menus. In ACM Symposium on User Interface Software and Technology (pp. 217-226). New York, NY: ACM Press. BEDERSON, B., CLAMAGE, A., CZERWINSKI, M. P., & ROBERTSON, G. G. (2004). DateLens: a fisheye calendar for PDAs. ACM Transactions on Computer-Human Interaction, 11, 1, 90-119. CARPENDALE, M. S. T. & MONTAGNESE, C. (2001). A framework for unifying presentation space. In ACM Symposium on User Interface Software and Technology (pp. 61-70). New York, NY: ACM Press. CARPENDALE, S., LIGHT, J., & PATTISON, E. (2004). Achieving higher magnification in context. In ACM Symposium on User Interface Software and Technology (pp. 71-80). New York, NY: ACM Press. DOUGLAS, S. A., KIRKPATRICK, A. E., & MACKENZIE, I. S. (1999). Testing pointing device performance and user assessment with the ISO 9241, part 9 standard. In ACM Conference on Human Factors in Computing Systems (pp. 215-222). New York, NY: ACM Press. FITTS, P. M. (1954). The information capacity of the human motor system in controlling the amplitude of movement. Journal of Experimental Psychology, 47, 6, 381-391. FLEISS, J. (1981) Statistical Methods for Rates and Proportions, New York, NY: John Wiley & Sons. FURNAS, G. W. (1981/1999). The fisheye view: a new look at structured files. (Rep. No. Bell Laboratories Technical Memorandum #81-11221-9). Reprinted in S. K. CARD, J. D. MACKINLAY, AND B. SHNEIDERMAN (1999) Readings in Information Visualization: Using Vision to Think (pp. 312-330). San Francisco, CA: Morgan Kaufmann. FURNAS, G. W. (1986). Generalized fisheye views. In Proceedings of ACM Conference on Human Factors in Computing Systems (pp. 16-23). New York, NY: ACM Press. GOLDBERG, J. H. & KOTVAL, X. P. (1999). Computer interface evaluation using eye movements: methods and constructs. International Journal of Industrial Ergonomics, 24, 6, 631-645. GUTWIN, C. (2002). Improving focus targeting in interactive fisheye views. In ACM Conference on Human Factors in Computing Systems (pp. 267-274). New York, NY: ACM Press. GUTWIN, C. & FEDAK, C. (2004a). A comparison of fisheye lenses for interactive layout tasks. In Proceedings of the 2004 Conference on Graphics Interface (pp. 213-220). Ontario, Canada: Canadian Human-Computer Communications Society. GUTWIN, C. & FEDAK, C. (2004b). Interacting with big interfaces on small screens: a comparison of fisheye, zoom, and panning techniques. In Proceedings of the 2004 Conference on Graphics Interface (pp. 145-152). Ontario, Canada: Canadian Human-Computer Communications Society. 19
GUTWIN, C. & SKOPIK, A. (2003). Fisheye views are good for large steering tasks. In ACM Conference on Human Factors in Computing Systems (pp. 201-208). New York, NY: ACM Press. HORNBÆK, K. & FRØKJÆR, E. (2003). Reading patterns and usability in visualizations of electronic documents. ACM Transactions on Computer-Human Interaction, 10, 2, 119-149. HORNOF, A. J. & HALVERSON, T. (2003). Cognitive strategies and eye movements for searching hierarchical computer displays. In ACM Conference on Human Factors in Computing Systems (pp. 249-256). New York, NY: ACM Press. JAKOBSEN, M. & HORNBÆK, K. (2006). Evaluating a fisheye view of source code. In ACM Conference on Human Factors in Computing Systems (pp. 377-386). New York, NY: ACM Press. KEAHEY, T. A. & ROBERTSON, E. L. (1997). Nonlinear magnification fields. In Proceedings of the IEEE Symposium on Information Visualization (pp. 51-58). Los Alamitos, CA: IEEE Press. LARSON, K. & CZERWINSKI, M. P. (1998). Web page design: implications of memory, structure and scent for information retrieval. In ACM Conference on Human Factors in Computing Systems (pp. 25-32). New York, NY: ACM Press. LEUNG, Y. K. & APPERLEY, M. D. (1994). A review and taxonomy of distortion-oriented presentation techniques. ACM Transactions on Computer-Human Interaction, 1, 2, 126-160. MACKENZIE, I. S. (1992). Fitts' law as a research and design tool in human-computer interaction. HumanComputer Interaction, 7, 1, 91-139. MCGUFFIN, M. & BALAKRISHNAN, R. (2004). Acquisition of expanding targets. In ACM Conference on Human Factors in Computing Systems (pp. 57-64). New York, NY: ACM Press. MCGUFFIN, M. J., DAVISON, G., & BALAKRISHNAN, R. (2004). Expand-ahead: a space-filling strategy for browsing trees. In IEEE Symposim on Information Visualization (pp. 119-126). Los Alamitos, CA: IEEE Press. NORMAN, K. L. & CHIN, J. P. (1988). The effect of tree structure on search in a hierarchical menu selection system. Behaviour and Information Technology, 7, 1, 51-65. NORMAN, K. L. (1991). The psychology of menu selection: Designing cognitive control at the human/computer interface. Norwood, N.J.: Ablex Publishing Corporation. PIROLLI, P., CARD, S., & VAN DER WEGE, M. (2003). The effects of information scent on visual search in the hyperbolic tree browser. ACM Transactions on Computer-Human Interaction, 10, 1, 20-53. PLAISANT, C., CARR, D., & SHNEIDERMAN, B. (1995). Image browsers: taxonomy, guidelines, and informal specifications. IEEE Software, 12, 2, 21-32. RASKIN, J. (2000). The Humane Interface. Boston, MA: Addison Wesley. Rosenthal, R. & Rosnow, R. (1985). Contrast Analysis, Cambridge: Cambridge University Press. SARKAR, M. & BROWN, M. (1992). Graphical fisheye views for graphs. In ACM Conference on Human Factors in Computing Systems (pp. 83-91). New York, NY: ACM Press. SCHAFFER, D., ZUO, Z., GREENBERG, S., BARTRAM, L., DILL, J., DUBS, S., & ROSEMAN, M. (1996). Navigating hierarchically clustered networks through fisheye and full-zoom methods. ACM Transactions on ComputerHuman Interaction, 3, 2, 162-188. SHNEIDERMAN, B. & PLAISANT, C. (2005). Designing the User Interface: Strategies for Effective HumanComputer Interaction. (4th ed.) Boston, MA: Addison Wesley.
20
SKOPIK, A. (2002). The effect of distortion on landmarking in a two-dimensional space (Technical Report, University of Saskatchewan. Saskatoon, Canada). SPENCE, R. & APPERLEY, M. S. (1982). Data base navigation: an office environment for the professional. Behaviour & Information Technology, 1, 1, 43-54. www.eyegaze.com (2004). LC Technologies eye-tracker [Computer software]. ZELLWEGER, P. T., MACKINLAY, J. D., GOOD, L., STEFIK, M., & BAUDISCH, P. (2003). City lights: contextual views in minimal space. In Extended Abstracts of ACM Conference on Human Factors in Computing System (pp. 838-839). New York, NY: ACM Press.
21
Table I: Design of the experiment. The first letter denotes the menu (f – fisheye, o – overview, m – multi-focus, h – hierarchical); the second letter denotes the data set (a – alphabetical, c – categorical). Participant
Block 1
Block 2
1
o+a
f+a
m+c
h+c
f+c
h+a
o+c
m+a
2
f+c
m+c
h+a
o+a
m+a
o+c
f+a
h+c
3
m+c
h+c
o+a
f+a
o+c
m+a
h+a
f+c
4
h+a
o+a
f+c
m+c
h+c
f+a
m+a
o+c
5
o+c
f+c
m+a
h+a
m+c
o+a
f+a
h+c
6
f+a
m+a
h+c
o+c
h+a
f+c
m+c
o+a
7
m+a
h+a
o+c
f+c
f+a
h+c
o+a
m+c
8
h+c
o+c
f+a
m+a
o+a
m+c
h+a
f+c
9
m+c
h+a
o+c
f+a
h+c
o+a
f+c
m+a
10
h+a
m+c
f+a
o+c
m+a
h+c
o+a
f+c
11
f+c
o+a
h+c
m+a
o+c
f+a
m+c
h+a
12
o+a
f+c
m+a
h+c
f+a
m+c
h+a
o+c
22
Table II: Subjective satisfaction measured by QUIS (Shneiderman & Plaisant, 2005), first six questions below (a-f), and by a questionnaire from Douglas, Kirkpatrick, and MacKenzie (1999), last five questions below (g-k). Fisheye
Multi-focus
Overview
Hierarchical
M
SD
M
SD
M
SD
M
SD
a: Terrible (1) — Wonderful (9)
5.83
2.03
4.83
1.70
5.83
1.75
6.25
1.42
b: Frustrating (1) — Satisfying (9)
4.75
2.01
4.58
1.56
5.92
1.44
6.25
1.66
c: Dull (1) — Stimulating (9)
5.73
1.74
5.73
2.28
5.58
1.68
4.09
1.70
d: Difficult (1) — Easy (9)
5.33
2.27
4.67
1.97
6.17
1.99
6.75
2.09
e: Inadequate power (1) — Adequate
6.27
1.35
5.60
1.71
6.67
1.30
6.17
1.47
5.73
1.74
6.20
1.48
5.70
1.64
3.90
1.73
3.67
0.89
3.33
1.15
3.75
0.62
3.50
0.90
3.25
1.22
3.17
0.58
2.67
0.78
2.58
0.67
3.00
0.74
3.33
0.78
2.92
0.67
3.00
0.60
3.42
1.16
3.50
1.09
2.50
0.80
2.17
1.27
3.10
1.00
2.70
0.90
3.40
1.00
3.30
0.80
Overall reactions
power (9) f: Rigid (1) — Flexible (9) More detailed questions g: Smoothness during operation was: very rough (1) - very smooth (5) h: The mental effort required for operation was: too low (1) - too high (5) i: The physical effort required for operation was: too low (1) - too high (5) j: Accurate pointing was: easy (1) – difficult (5) k: General comfort: very uncomfortable (1) – very comfortable (5)
23
Table III. Fixations and saccades during known-item trials, N = 1756, and browsing trials, N = 405. The rightmost column summarizes the significant pairwise differences (f – fisheye, h – hierarchical, m – multi-focus, o – overview). Fisheye
Multi-focus
Overview
Hierarchical
Pairwise
M
SD
M
SD
M
SD
M
SD
differences
Known-item
2.52
.54
2.50
.57
2.48
.62
2.84
.57
f, m, o < h
fixation (s )
Browsing
2.26
.84
2.38
.48
2.81
4.36
2.51
.46
Fixation
Known-item
376
103
353
103
379
136
347
93
duration
Browsing
447
144
385
91
387
103
382
103
Saccade
Known-item
58
61
60
51
64
60
56
39
duration
Browsing
56
45
54
37
66
61
61
56
Rate of -1
h, m < f, o
(ms)
(ms) Scanpath
Known-item
2676
1765
2792
1913
2721
1966
2213
1630
length
Browsing
4498
3754
5450
4822
4950
3752
5054
4845
(pixels)
24
h < m, o
Table IV. Fixations on menu regions during known-item trials, N = 898. Significant differences between the fisheye and multi-focus menus are marked with an asterisk (*). Fisheye
Multi-focus
M
SD
%
M
SD
%
Focus region
9.52
8.83
67
8.15
5.48
61
Transition region *
0.92
3.07
7
2.91
3.15
22
Context region *
0.38
1.88
3
2.31
2.55
17
Index of letters
3.29
4.25
23
-
-
-
Total fixations on menu
14.10
11.68
100
13.36
9.09
100
25
Table V. Fixations on menu regions during browsing trials, N = 199. Significant differences between the fisheye and multi-focus menus are marked with an asterisk (*). Fisheye
Multi-focus
M
SD
%
M
SD
%
Focus region
23.13
25.72
68
25.06
24.19
61
Transition region *
2.35
4.64
7
9.28
10.76
23
Context region *
0.66
1.43
2
6.56
9.26
16
Index of letters
7.96
14.34
23
-
-
-
Total fixations on menu
34.09
31.44
100
40.89
40.74
100
26
Figure 1: Bederson’s fisheye menus (Bederson, 2000).
27
Figure 2: The fisheye (left), overview (middle), and multi-focus menus (right); all displaying the alphabetical data set.
28
Figure 3: The fisheye (left), overview (middle), and multi-focus menus (right); all displaying the categorical data set.
29
Figure 4: The three components of the multi-focus DOI metric (top) and their combination for a particular focus point (bottom). The combination corresponds to the view in Figure 3, right.
font size max
level 1 level 2
min
level 3
item position
focus point
font size max
min item position focus point
30
Figure 5: The hierarchical menus used in the experiment; to the left showing the alphabetical data set, to the right showing the categorical data set.
31
Figure 6: Accuracy for known-item tasks; error bars show standard error of the mean. Alphabetical data set
Categorical data set 100
Accuracy (%)
Accuracy (%)
100
95
90
95
90
Fisheye
Overview
Multi-focus
Hierarchy
Fisheye
32
Overview
Multi-focus
Hierarchy
Figure 7: Accuracy for browsing tasks; error bars show standard error of the mean. Categorical data set 100
90
90
80
80
70
70
Accuracy (%)
Accuracy (%)
Alphabetical data set 100
60 50 40
60 50 40
30
30
20
20
10
10
0
0 Fisheye
Overview
Multi-focus
Hierarchy
Fisheye
Overview
33
Multi-focus
Hierarchy
Figure 8: Selection time for known-item tasks; error bars show standard error of the mean. Alphabetical data set
Categorical data set
5
11 10 9
4
Selection time (s)
Selection time (s)
8
3
2
7 6 5 4 3
1
2 1
0
0 Fisheye
Overview
Multi-focus
Hierarchical
Fisheye
Overview
34
Multi-focus
Hierarchical
Figure 9: Selection time for browsing tasks; error bars show standard error of the mean.
Alphabetical menu data set
Categorical data set
200
350
180 300 160 250
Selection time (s)
Selection time (s)
140
120 100
80 60
200
150
100
40 50 20 0
0 Fisheye
Overview
Multi-focus
Hierarchical
Fisheye
Overview
35
Multi-focus
Hierarchical
Figure 10. Subjective satisfaction as measured by QUIS; error bars show standard error of the mean. See Table 2 for the complete wording of the questions.
Terrible
Wonderful Fisheye Multi-focus Overview Hierarchical
Frustrating
Dull
Satisfying
Stimulating
Difficult
Easy
Inadequate
Adequate
Rigid
Flexible 1
2
3
4
5
6
7
36
8
9
Figure 11. Subjective satisfaction measured by a questionnaire from Douglas, Kirkpatrick, and MacKenzie (1999); error bars show standard error of the mean. See Table 2 for the complete wording of the questions.
Very rough
Very smooth Fisheye Multi-focus Overview Hierarchical
Too low
Too high
Too low
Too high
Easy
Difficult
Very uncomfortable
Very comfortable
1
2
3
4
37
5
Figure 12. Relative distribution of fixations in the fisheye and multi-focus menus. These data were derived from the eye tracking. known item
67%
7%
23%
Focus region Transition region
Fisheye
Context region browsing
68%
7%
23%
known item
61%
22%
17%
browsing
61%
23%
16%
Index of letters
Multi-focus
Fixations 0% 10% 20% 30% 40% 50% 60% 70% 80% 90% 100%
38
Figure 13. Relative distribution of time to select an item in the menus, separated into time to get close to the target item, time spent close to the target item, and further exploration (i.e., moving away from a target item after having been in its vicinity). These data were derived from mouse movements.
76%
Hierarchical
22%
Time to get close Time spent close Further exploration
45%
Overview
40%
Multi-focus
41%
40%
Fisheye
13%
42%
19%
46%
14%
Fixations 0%
10%
20%
30%
40%
50%
60%
70%
39
80%
90% 100%