Journal of Experimental Psychology: Human Perception and Performance 2002, Vol. 28, No. 4, 933–947
Copyright 2002 by the American Psychological Association, Inc. 0096-1523/02/$5.00 DOI: 10.1037//0096-1523.28.4.933
Role of Structure and Component in Judgments of Visual Similarity of Chinese Characters Su-Ling Yeh and Jing-Ling Li National Taiwan University Skilled readers of Chinese participated in sorting and visual search experiments. The sorting results showed that under conditions of conflicting information about structure and component, subjective judgments of the visual similarity among characters were based on the characters’ overall configurations (i.e., structures) rather than on the common components the characters possessed. In visual search, both structure and component contributed to the visual similarity reflected by the search efficiency. The steepest search slopes (thus the most similar target– distractor pairs) were found when the target and the distractor characters had the same structure and shared 1 common component, compared with when they had different structures and/or shared no common components. Results demonstrated that character structure plays a greater role in the visual similarity of Chinese characters than has been considered.
only about 400 (Cheng, 1982). The written versions of these homophones may have very little visual similarity (e.g., both and are pronounced as /feng1/). On the other hand, characters similar is pronounced in shape may have different pronunciations (e.g., /shi1/, and is pronounced /feng1/). Thus, the relationship between the visual properties of written syllables and their phonological properties that characterizes alphabetic systems is weaker in Chinese. This makes written Chinese an excellent candidate for investigation of the effective locus of phonological processing in recognizing visual words. Third, Chinese characters are different from linearly arranged alphabetic words in that each character consists of strokes or stroke patterns that are combined into various structures, and each character occupies a roughly constant square-shaped size, irrespective of its structure and the number of strokes in the character. It has been estimated that more than 80% of Chinese characters are phonetic compounds (Zhou, 1978) that usually consist of two kinds of components1: the radical component and the phonetic component.2 The radical component in a compound character usually conveys the semantic information, and the phonetic component tends to provide the phonetic cue of the compound. For example, the compound character (/yang2/, meaning ocean) consists of the semantic radical component (meaning water) and the phonetic component (/yang2/). In this example, both the semantic mapping from the radical to the compound and the phonetic mapping from the phonetic to the compound are consis-
Studies of visual word recognition have largely drawn on written English for stimulus material. Conclusions based on such studies, however, may be properly applied only to English or, in general, to languages with alphabetic orthographies at best. Recently, researchers have turned to investigations using experimental materials in written Chinese for the following three reasons. First, the Chinese writing system is said to be a logographic system. Many observe that the shape–meaning relationship for a character seems to be much closer than that for an alphabetic word (Biederman & Tsao, 1979; Chen, Flores d’Arcais, & Cheung, 1995; Chen & Juola, 1982; Leck, Weekes, & Chen, 1995; Park & Arbuckle, 1977; Sasanuma, 1975; Sasanuma, Itoh, Kobayashi, & Mori, 1980; Wang, 1973; however, see Liu, 1995; Tzeng & Hung, 1988). A widely held view of lexical processing in this field is the dual-route model (e.g., Coltheart, 1978; Forster, 1976; Morton & Patterson, 1980), in which it is hypothesized that either a direct visual route from orthography to meaning or an indirect, phonologically mediated route can be used for accessing the meaning of a lexical item. In English, if a phonological effect is found, use of the indirect route is inferred; if no such effect is found, use of the direct visual route is then inferred. The logographic nature of written Chinese thus provides a unique opportunity to demonstrate the existence of the direct visual route without inference from negative results (Chen et al., 1995; Leck et al., 1995). Second, homophones are prevalent in Chinese; for the 4,000 – 5,000 syllables encountered daily, the number of possible written syllabic forms (as Chinese characters represent monosyllables) is
1 We adopt a more general term, component, to refer to the subcharacter unit that is formed by a group of strokes and that recurs in different characters. It has been called bujian ( ), radical, constituent, unit, and stroke pattern in other studies (e.g., Chen, Allport, & Marshall, 1996; Chua, 1999; Flores d’Arcais, 1992; Flores d’Arcais, Saito, & Kawakami, 1995; Liu, 1984; Taft & Zhu, 1997; Tan, Hoosain, & Siok, 1996). 2 The radical component defined here is the bushou ( ), which is used to look up characters in a Chinese dictionary. It has been used in the same way in other studies as well (e.g., Chen & Allport, 1995; Chen & Juola, 1982; Fang & Wu, 1989; Feldman & Siok, 1997; Huang & Wang, 1992; Leck et al., 1995).
Su-Ling Yeh and Jing-Ling Li, Department of Psychology, National Taiwan University, Taipei, Taiwan. This research was supported by National Science Council Grant 872413-H-002-027-G5 to Su-Ling Yeh. We thank Laurie Feldman and Denis Pelli for their comments on an earlier version; we especially thank Laurie Feldman for her very constructive advice. Correspondence concerning this article should be addressed to Su-Ling Yeh, Department of Psychology, National Taiwan University, No. 1, Sec. 4, Roosevelt Road, Taipei, Taiwan, 106. E-mail:
[email protected] 933
934
YEH AND LI
tent. Variability exists in the consistency of the mapping for each, however. For example, the semantic mapping can vary from transparent to opaque, and a valid phonetic mapping comprises less than 40% of the simplified script used in mainland China and Singapore (Zhou, 1978) and less than 30% of the complicated script used in Taiwan and Hong Kong (Liu, Su, & Chen, 2001). The distinction between the radical and the phonetic is functional rather than graphic. That is, a certain component (e.g., , /shan1/, meaning mountain) can be a radical in one case (e.g., , /feng1/, meaning mountain peak) and phonetic in another (e.g., , /shan1/, meaning vilify). In addition, although a large proportion of radicals occur on the left side and a large proportion of phonetics occur on the right side of the compound character, the relation between the component’s position and its function is not deterministic. For example, the radical component can occur on the left (e.g., ), top (e.g., ), bottom (e.g., ), or right (e.g., ). In this example, the proportions of the component usually change when the character structure changes. Many of the components, whether they are the radical or the phonetic, can also be a character in their own right. These qualities make Chinese characters a unique tool for investigating submorphemic processing of visual word recognition (e.g., Chen et al., 1996; Feldman & Siok, 1997, 1999; Taft & Zhu, 1997; Taft, Zhu, & Peng, 1999). Although there has been an increase in the use of Chinese characters as experimental stimuli, relatively little attention has been paid to the role of the grapheme or orthography in Chinese character recognition. This lack of empirical studies concerning this key methodological component has led to choices of stimuli often varying, in terms of their graphic aspects, across experiments. For example, to achieve visual similarity in stimulus characters, some researchers have chosen characters that share common components. The common components may be the same radical, for example, and , or and (Chen & Juola, 1982; Leck et al., 1995; Perfetti & Zhang, 1991), or the same phonetics, for example, and , or and (Chen & Juola, 1982; Chua, 1999; Leck et al., 1995; Perfetti & Zhang, 1991). These two criteria have usually been treated as interchangeable (e.g., Chen et al., 1995; Perfetti & Tan, 1998; Perfetti & Zhang, 1991; Tan et al., 1996; Wu, 1990), although there are exceptions (e.g., Chen & Allport, 1995; Chen et al., 1996; Feldman & Siok, 1997, 1999). Among these studies, sometimes characters that appear similar or share common strokes have also been selected as a visually similar pair: for example, and , and , and , and , or and (e.g., Chen et al., 1995; Leck et al., 1995; Perfetti & Tan, 1998; Perfetti & Zhang, 1991; Tan et al., 1996). In an attempt to empirically examine the issue of visual similarity in Chinese characters, Yeh, Li, and Chen (1997) asked skilled Chinese readers to classify samples of Chinese characters according to their shapes. The character space obtained from a multidimensional scaling (MDS) analysis based on participants’ similarity judgments indicated two major axes in classifying Chinese characters: (a) horizontal (e.g., , in which the two components are arrayed left to right) versus vertical (e.g., ), and (b) bounded (e.g., , in which one component is enclosed by another) versus open (e.g., ). A feature-based similarity analysis revealed that the skilled readers’ similarity judgments were not based on the particular strokes or features of the characters. Rather, the structure of the characters was the determining factor of the similarity judgment. Therefore, even characters that differed in all their
components could be judged similar and located closely in the character space if their structures were similar, such as and . Furthermore, a hierarchical cluster analysis revealed five major clusters: [H and L] and [V and (P and E)], where H, L, V, P, and E stand for horizontal (e.g., ), L-shaped (e.g., ), vertical (e.g., ), P-shaped (e.g., ), and enclosed (e.g., ) structures, respectively (Yeh, Li, & Chen, 1999). These results were obtained from at least three different sets of characters that were sampled to cover as comprehensively as possible the shape spectrum of Chinese characters and were obtained across different samples of skilled readers (Yeh et al., 1997; Yeh, Li, & Chen, 1999). Japanese undergraduates who were familiar with Kanji (Chinese characters used in Japanese script) rendered the same pattern as skilled Chinese readers; however, those who had not learned Chinese, such as Taiwanese kindergartners, illiterate elders, and American undergraduates, did not extract or use the structural information in the shape-sorting task (Yeh, Li, Takeuchi, Sun, & Liu, 1999). Although various types of character structures have been identified among Chinese characters (Chan, 1992; Huang & Wang, 1992; Leck et al., 1995; Liu, 1984; Liu & Yeh, 1977; Liu, Chang, & Yang, 1979; Yeh & Liu, 1972; Yin & Rohsenow, 1994), to our knowledge, Yeh and colleagues (Yeh et al., 1997; Yeh, Li, & Chen, 1999; Yeh, Li, Takeuchi, et al., 1999) provided the first set of empirical studies directly addressing the issue of character structure categorization. It may be argued that these structure categories were established by explicitly asking the participants to classify various characters in terms of their shapes. When no such request is made, as in many paradigms of visual character recognition, whether these structure categories are also perceived and processed remains an open question. In consideration of this, Yeh (2000) used a visual search paradigm in which no explicit request for shape comparison was made to examine whether structure information was still perceived and used in discriminating target characters from distractors. The participants were asked to search for a unique character within a homogenous field consisting of multiples of another character, or to find a prespecified target character among distractors. The results showed that when a target character was different in structure from the distractors, the slope of the function relating reaction time (RT) to set size (i.e., total number of stimulus items) was significantly more shallow than when both the target and the distractors had the same structure. Furthermore, different slope values were obtained for the 10 target– distractor pairs formed by the five major structure types. These results are in accordance with the explicitly rated similarity relationships between differently structured characters in the earlier two reports (Yeh et al., 1997; Yeh, Li, & Chen, 1999). The results indicated that character structure was also perceived and used in a short RT response when no explicit request for judging the shape of the characters was made. These studies have revealed an important aspect of Chinese characters that has long been overlooked: their configurational structure. A character’s structure is formed by arranging various components in appropriate positions relative to one another; thus, the relative position of different components would have to be perceived for a reader to access structural information. Whether the component per se has to be recognized before the extraction of structure information requires further investigation and cannot be determined in these studies, including the present one. What is
VISUAL SIMILARITY OF CHINESE CHARACTERS
emphasized here, however, is that character structure is the basis for similarity judgments of skilled readers in a sorting task; it can affect the search efficiency in a visual search task, and readers’ exploitation of it in such tasks probably reflects overlearning. The studies of Yeh et al. (1997; Yeh, Li, & Chen, 1999) and Yeh (2000), although shedding some light on the issue of visual similarity of Chinese characters by emphasizing the role of structure, did not, however, directly examine the relative role of structure and component in graphemic similarity. Those studies were a first attempt to establish the classification system of graphical similarity of Chinese characters; therefore, the sample characters chosen and the range of structural variations these characters covered were designed to be as diverse as possible, which did not include, for example, characters with different structures but common components. Furthermore, many researchers who treated characters with common components as similar also usually held character structure constant; however, the criteria for distinguishing structure types appeared to be generally intuitive and may not be consistent with the aforementioned, empirically obtained categories. It is thus unclear whether the difference in the visual similarity between these characters could be increased by taking into consideration the differences in their structures. That is, whether a larger difference in similarity can be obtained by comparing characters with the same structure and one common component to those with different structures and no common component has yet to be determined. The goal of this study was to examine the role of structure and component in judgments of visual similarity of Chinese characters by explicitly manipulating the structure and components of Chinese characters within a single experimental framework. In Experiment 1, we used a sorting task as in Yeh et al. (1997; Yeh, Li, & Chen, 1999; Yeh, Li, Takeuchi, et al., 1999) but chose characters that either shared a common component but had a different structure or shared the same structure but had different components. To facilitate the task of finding suitable characters belonging to each of the specified conditions, in Experiment 1, we combined the five major structure types found in our previous studies into three: horizontal, vertical, and bounded. (The last category included the P-shaped, L-shaped, and enclosed types in Yeh et al., 1997; Yeh, Li, & Chen, 1999.) Experiment 2 adopted a visual search task as in Yeh (2000) but used a 2 (structure: same or different) ⫻ 2 (component: same or different) factorial design. In Experiment 2, we used only the two most frequently occurring structure types— horizontal and vertical—to keep the experimental design as straightforward as possible.
Experiment 1 Experiment 1A: Constrained Sorting To investigate the role of structure and component in judgments of visual similarity of Chinese characters, we first used the same sorting task as in Yeh et al. (1997; Yeh, Li, & Chen, 1999) to examine what occurs when the factors of structure and component lead to different predictions concerning participants’ similarity judgments. Three aspects of a Chinese character were considered: the radical, the phonetic, and the structure. The radicals used in this study were the bushou selected from the New Eastern Chinese Dictionary (1986, 2nd ed.). We chose phonetic components with a
935
stroke count of more than half of the total number of strokes in that character. For the structure, three types were specified: horizontal, vertical, and bounded. We would have preferred to choose samples of Chinese characters sharing one variable in common but differing in the other two variables. That is, optimally, each set would have consisted of three characters, C1, C2, and C3, such that Pair C1-C2 shares the radical but differs in the structure and the phonetic, Pair C2-C3 shares the phonetic but differs in the structure and the radical, and Pair C1-C3 shares the structure but differs in the radical and the phonetic. However, in practice, it is almost impossible to find such sample sets, because a compound character’s radical and its structure are usually interdependent, due to character formation rules of Chinese. For example, the radical (/cao3/), meaning grass, is usually placed on top of a character that has a meaning related to grass, such as (/cao3/), meaning grass, (/ye4/), meaning leaf, and (/hua1/), meaning flower. These words are thus vertical in structure. Another example is the radical (/ren2/), meaning human. This semantic radical usually appears on the left side of a character and thus forms words with meanings related to human that are horizontal in structure; for example, (/xin4/), meaning trust, (/ren2/), meaning kindness, and (/yi2/), meaning ceremony. Although the radical and the structure cannot be two independent variables, the radical and the phonetic can, because the phonetic is, by definition, not the meaning-conveying radical of a compound character. Therefore, only two groups of Chinese characters were selected. In one group, the characters shared the same radical but differed in both the phonetic and the structure (Type 1: same radical), and in the other, the characters shared the same phonetic but differed in both the radical and the structure (Type 2: same phonetic). In each group, there were four sets of characters, with each set consisting of three characters belonging to the following three types of structure: horizontal (H), vertical (V), and bounded (B). When characters of the same-radical and the same-phonetic groups were combined and rearranged according to their structures, another group of samples that shared one of the structures (H, V, or B) then emerged (Type 3: same structure). All stimulus materials used in this experiment are shown in Appendix A. We refrained from choosing another group of characters in the same-structure type to keep the number of characters in the three groups roughly the same; if we had chosen another group of characters for the same-structure type, the number would have greatly exceeded those of the other two types, because characters in the same-radical and the same-phonetic types had their own structures and could each belong to instances of the same-structure type. To conceal our types organizational scheme such that no response bias would be induced, we added six characters as foils that did not explicitly belong to any of the three structure types.
Method Participants. A total of 40 native speakers of Mandarin who were undergraduates at National Taiwan University participated in this experiment, to obtain extra credit in their introductory psychology course. All had normal or corrected-to-normal vision and were naive to the purposes of this experiment. Stimuli. Thirty characters (12 same-radical and 12 same-phonetic characters that belonged to three structure types, plus 6 foils) were each printed in black and pasted in the center of 9-cm ⫻ 5.4-cm white cards. The
936
YEH AND LI
characters appeared in 36-pt Xi-Ming font ( ). When printed, each character occupied 1.2 cm ⫻ 1.2 cm in space. In choosing these samples, we also considered the semantic relationships and the pronunciations among these characters. The procedure for selecting sample characters was as follows: Components (either the radical or the phonetic) that occurred in many characters were selected first, such as , , , and . Then, characters that were similar in stroke count but differed in pronunciation and semantics were chosen from among characters that contained these components. A final check was conducted by pooling all sample characters and then excluding homophones that had the same phonemes and tones.3 Synonyms, highly semantically related characters, and characters of very high or very low frequency (based on the 20,698,116 characters that appear in journals and newspapers; according to Academia Sinica, 1993) were excluded as well. The resulting 30 selected characters possessed stroke counts of 8 –16 (M ⫽ 11.8). Procedure. Participants were tested individually in a quiet room. They were seated beside a table with 30 cards placed on the desktop and were instructed to “judge the similarity of the shapes of characters,” and “put similar characters into the same pile and dissimilar characters into different piles.” During each session of the sorting task, the 30 cards were shuffled and then presented with the characters facing up at random locations on the desktop. These cards had to be put into a predesignated number of piles (2, 3, 4, 5, or 6 piles) as requested on each trial, for a total of five trials, and the sequence regarding the number of piles to create was counterbalanced among participants. After the participants finished the task, they were asked to write down the rules they had used for sorting—rules they had determined themselves with no instruction—to complete the task.
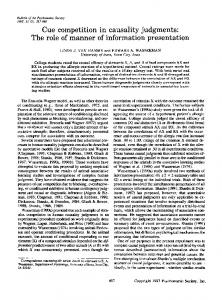
Results and Discussion For each participant, a 30 ⫻ 30 matrix (Pairij, i ⫽ 1 ⬃ 30, j ⫽ 1 ⬃ 30) was built, with entries indicating how many times characters i and j were placed in the same piles. Each cell in the matrix was assigned a value of 1 if the pair of characters was placed in the same pile and a value of 0 if the pair was placed in different piles. The highest score for each pair was 5 for each participant. A pooled matrix was obtained by summing the participants’ matrices, and then the matrix was submitted to the following analyses. Multidimensional scaling. An MDS procedure was adopted for the analysis. MDS, also known as perceptual mapping, is the process of transforming participants’ judgments of similarity into distances represented in a multidimensional space. The intercharacter distances fit as closely as possible the original distances reflected by their similarity relationships (Kruskal, 1964a, 1964b; Shepard, 1962a, 1962b). We calculated a dissimilarity matrix by subtracting the score of each cell from the largest score in the pooled similarity matrix and submitting it to a commonly used MDS procedure, alternating least squares scaling (ALSCAL; Takane, Young, & de Leeuw, 1977). A euclidean space of two dimensions was used, considering several factors including the exact stress value, the Shepard diagram, and the explanation power. The character space we obtained is shown in Figure 1. The Stress 1 value (Kruskal, 1964a) of the two-dimensional space was 0.17. This is considered to be a good fit (Kruskal & Wish, 1978), R2 ⫽ .89. As shown in Figure 1, the horizontally structured characters (such as , , and ) are clustered on the right side of the vertical meridian. The vertically structured characters (such as and ) and the bounded characters (such as , , and ), which appeared to be vertically shaped and were adjacent to the
vertical characters, are clustered on the left side. Therefore, we can define the x-axis as horizontal–vertical. In regard to the y-axis, most of the characters with a bounded structure (such as , , , and ) are located on the upper part of this axis, and characters with an open structure (such as , , , and ) are located on the lower part. Therefore, it is reasonable to call this axis open– bounded. The two axes, horizontal–vertical and open– bounded, are consistent with those identified in the previous studies (Yeh et al., 1997; Yeh, Li, & Chen, 1999). In the first quadrant of the character space, the L-shaped character stands alone and is located relatively near to the horizontal characters. In our previous studies, the L-shaped characters were located close to each other and separated from characters with other structures. In a twodimensional space, these L-shaped characters were judged as more similar to horizontally structured characters; therefore, these two structure types were located on the same side of the horizontal– vertical axis. Because only one L-shaped character was used in this experiment, this character appeared to be isolated from other characters. Nevertheless, the pattern of results is quite consistent with the results of previous work (Yeh et al., 1997; Yeh, Li, & Chen, 1999). More important, the characters that shared the same phonetic, such as , , and , are located away from each other. For example, is located in the third quadrant, is located on the border of the first and fourth quadrants, and is located in the second quadrant. The same situation occurred for those characters that shared the same radical, , such as , , and . For example, is located in the third quadrant, is in the first quadrant, and is in the second quadrant. The only exception is those characters that shared the same radical, , such as , , and . These are clustered in the same quadrant, the third. As stated above, however, the radical and the structure are not independent variables; therefore, for the radical , in particular, we believe the same structure (i.e., vertical structure), but not the same radical, accounts for these characters’ close association in the character space. Further evidence for this inference comes from the other characters located in this quadrant having the same vertical structure, such as , , , and . These results show that the locations of characters in the character space are mainly determined by their structures but not by their common radicals or phonetics. Hierarchical cluster analysis. In addition to MDS, the pooled similarity matrix was also submitted to hierarchical cluster analysis. Hierarchical cluster analysis is a multivariate technique to group items on the basis of the characteristics they possess. The resulting clusters of items should then exhibit high internal (within-cluster) homogeneity and high external (between-clusters) heterogeneity. The procedure constructs a hierarchy in the form of a tree diagram. Various methods of clustering can be used to compute the distance of one item (or cluster) from another and to determine whether the two should be merged at each stage. We chose one of the most commonly used joining algorithms for nonmetric (rank-order) psychological data for our analysis, the 3 Because of the difficulty of choosing the materials, some characters in the same phonetic type contained the same phonemes. If this induced bias in sorting, it would have caused the sorting results to bias toward the same phonetic. As shown later, this was not the case.
VISUAL SIMILARITY OF CHINESE CHARACTERS
Figure 1.
937
Multidimensional scaling results, Experiment 1A.
complete linkage method (Johnson, 1967). The resulting tree diagram is shown in Figure 2. There were three main branches in the tree diagram, as labeled A–C in Figure 2. Cluster A contains the horizontal characters, Cluster B contains the vertical characters, and Cluster C contains the bounded characters. The only L-shaped character, , was grouped with horizontal characters in Cluster A. Characters sharing the same radical or the same phonetic are not clustered together. These results are consistent with the previous MDS results. Classification basis. As for the classification principles recalled by participants, the most frequently cited were the characters’ horizontal or vertical structure. These were cited with frequencies of 36 (90.0%) and 29 (72.5%) out of 40 participants, respectively. Only 9 participants (22.5%) reported that they classified characters according to the common radical, and 9 participants (22.5%) reported that they classified according to the common phonetic. Each participant was allowed to report more than one kind of classification rule. These reported classification rules agree with the organization revealed by the MDS analysis. However, there was one possible confounding variable here. In our samples, there were three characters in each set in the sameradical and the same-phonetic types, but there were eight characters in each set in the same-structure type (for a total of three sets). If the participants had tended to classify characters according to the same-radical or the same-phonetic type, there would have been more than six piles. Because the participants were restricted to classifying the characters in up to six piles, the presumed classi-
fication based on the phonetic or the radical, if any, would be largely constrained. Experiment 1B was designed to examine whether the task per se (e.g., the constrained sorting used in Experiment 1A) affected the results.
Experiment 1B: Unconstrained Sorting To eliminate any possibility of bias induced by the task demand in Experiment 1A, we used an unconstrained sorting task, in which the participants could sort these characters into as many piles as they liked, in this experiment. If, in Experiment 1A, the restriction on the number of sorting piles led the participants to group characters according to their structures but not according to their radicals or phonetics, then we predicted the absence of any such restriction on the number of sorting piles would prevent such a bias from occurring. In Experiment 1A, each participant sorted the same set of cards five times (into different numbers of piles: 2, 3, 4, 5, and 6); thus, the highest score of a cell in the similarity matrix for each participant was 5. In this experiment, however, each participant was required to do the sorting task only once, which limited the amount of data obtained. To gather roughly the same amount of data points within each cell of the similarity matrix, as in Experiment 1A, we needed to increase the number of participants. For this purpose, a questionnaire was designed for use with several large groups of participants.
938
YEH AND LI group did not have to be equal. Participants wrote down their answers on the same page. On the next page, they were asked to write down the principles they used to group the characters. Participants were tested in groups.
Results and Discussion
Figure 2.
Tree structure of hierarchical cluster analysis, Experiment 1A.
Method Participants. A total of 162 undergraduates were recruited from the same subject pool as in the previous experiment. Stimuli and procedure. A character-sorting questionnaire was designed as follows: The same set of 30 character samples as in Experiment 1A was used. All the sample characters were printed within a black frame, 16.5 cm ⫻ 9 cm, on a page of white, A4-sized paper. Each character covered an area of 1.2 cm ⫻ 1.2 cm. The stimulus characters were arranged in a 6 ⫻ 5 matrix. In the matrix, the space between two columns was 1.3 cm, and the space between two rows was 0.6 cm. The 30 characters were randomly ordered with respect to the factors of radical, phonetic, and structure. Ten versions of the questionnaire with different placements of characters were constructed. The instructions were also printed on the same page, asking the participants to classify characters in terms of their shapes. Three points were emphasized in the instruction. (a) The participants were asked to write down the characters that had similar shapes in the same rows on the answer sheets. (b) Each character had to be classified once and only once; therefore, they should double-check whether their answers contained 30 characters in total. (c) There were no restrictions on the number of groups into which they could sort the characters, and the number of characters in each
Multidimensional scaling. The MDS result is shown in Figure 3. The Stress 1 value was 0.24, and the R2 value was .77. Again, characters with horizontal structure converged on the right side of the vertical meridian, and characters with vertical structure converged on the left side. The characters with bounded structure were located above the horizontal meridian, and those with open structure were located below it. The two axes can still be identified as horizontal–vertical and open– bounded structures, consistent with the results of Experiment 1A. In fact, in a comparison of Figure 3 with Figure 1, it is clear that these two character spaces are very similar. Hierarchical cluster analysis. The results from the hierarchical cluster analysis are shown in Figure 4. Again, there are three main clusters in the treelike structure, labeled A–C. Cluster A contains the horizontally structured characters, Cluster B contains the bounded-structure characters, and Cluster C contains the vertically structured characters. All the clusters were classified on the basis of their structures. Neither the same radical nor the same phonetic affected the groupings. This result is also consistent with that of Experiment 1A. Classification basis. As before, the bases on which participants classified the characters was determined. A total of 70 participants (43.2%) reported that they classified the characters by their horizontal or vertical structures, 43 (26.5%) reported that they classified the characters by their enclosed structure, and 39 (24.1%) reported that they classified the characters by their P-shaped structure. All are rules related to the same structure. A total of 43 participants (26.5%) reported that they classified characters on the basis of the same phonetic, and 30 participants (18.5%) reported that they classified on the basis of the same radical. The most frequently cited rules were still relevant to the same structure, including horizontal, vertical, and bounded structures. This was consistent with the results of the MDS and cluster analyses. Comparison of Experiments 1A and 1B. The Stress 1 value of MDS in Experiment 1A was 0.17, but in Experiment 1B, it was 0.24 (as the value becomes larger, the fit becomes worse). Further, the R2 values declined from .89 to .77 from Experiment 1A to Experiment 1B. We suspect that both the Stress 1 value increase and the R2 value decrease from Experiment 1A to Experiment 1B are due to the increased variance as a function of the unconstrained sorting conducted with a larger sample size in Experiment 1B. However, although there is a difference in the goodness-of-fit index, the patterns of results obtained in Experiments 1A and 1B are essentially the same. Tree diagrams of cluster analysis show similar main clusters as well, except that the relative positions of the bounded-structure clusters and the vertically structured clusters are exchanged in Figures 2 and 4. This does not affect the main conclusion, however. Therefore, both constrained sorting (Experiment 1A) and unconstrained sorting (Experiment 1B) revealed similar results: Similarity judgments of character shapes in the type of sorting task used here are mainly determined by the constructive structure of the characters.
VISUAL SIMILARITY OF CHINESE CHARACTERS
Figure 3.
939
Multidimensional scaling results, Experiment 1B.
Experiment 2: Visual Search Although the sorting tasks used in Experiment 1 allowed us to explore factors affecting character similarity judgments, various levels of processing, including perception, recognition, memory, and decision making, could possibly be involved in such sorting. In addition, the participants were explicitly asked to sort the sample characters according to their shapes, which is not usually performed in reading or visual character recognition. To examine whether the same effect of character structure exists during a shorter time course and when no explicit shape sorting is required, in this experiment, we conducted a visual search task.4 In a visual search task, participants are asked to search for a target among distractors as quickly but as accurately as possible. The set size varies from trial to trial, and only half the trials contain the target. The slope of the function relating RT to set size presumably reveals the processing of target in relation to distractors. Search efficiency (i.e., search slope) is assumed to reflect the degree of similarity between the target and the distractors (Duncan & Humphreys, 1989). As the target– distractor pairs become more similar, the search becomes less efficient, thus leading to a steeper slope in the RT versus set size function. Because Yeh (2000) established that the slope of the visual search task can be used as the similarity index between various constructive structures of Chinese characters, we adopted the same visual search task in this experiment.
Method Participants. A total of 14 participants, undergraduate and postgraduate students studying at National Taiwan University, were recruited to participate in this experiment. All were native speakers of Mandarin and had normal or corrected-to-normal vision. Stimuli and design. Two types of target– distractor pairs were chosen: same radical and same phonetic. For each type, two factors (structure and component) were manipulated. Four conditions were then specified by varying the two factors in a 2 (structure: same or different) ⫻ 2 (component: same or different) design. Therefore, for each type, the target character was paired with the following four kinds of distractors: (a) characters that shared the same structure and one component with the target (SsCs; i.e., Structure same, component same); (b) characters that shared the same structure with the target but had components different from those of the target (SsCd); (c) characters that had different structures from that of the target but shared one component with the target (SdCs); and (d) characters that had different structures from that of the target and different components from those of the target (SdCd).
4 In a pilot study, we conducted a discrimination task in a fouralternative, forced-choice procedure in which participants were asked to select the quadrant that had a different character in it (the other three quadrants were occupied by other, repeated characters). Because of the nature of the rapid processing of Chinese characters, even within a 20 – 30-ms duration, only a ceiling effect was obtained. We have since found that increasing the number of distractors, as in a visual search paradigm, increases the task difficulty, thus eliminating the ceiling effect.
940
YEH AND LI
Figure 4. Tree structure of hierarchical cluster analysis, Experiment 1B.
In the same-radical type, the two same-component conditions (SsCs and SdCs) consisted of pairs with the common radical , such as and (SsCs), and and (SdCs). In the same-phonetic type, the conditions and (SsCs), consisted of pairs with the common phonetic , such as and (SdCs). Neither type contained any target– distractor pairs and that were synonyms or homophones (from sharing the same phonemes, tones, or both), nor could they form two-character words. There were thus eight kinds of target– distractor pairs, as shown in Appendix B. The complexity of each character, as measured by the number of strokes, was kept the same across the four conditions, as was the range of the frequencies of these characters (according to Tsai, 1996). Stimuli were presented on a 20-in. (50.8-cm) EIZO monitor driven by a personal computer (Pentium 90). At a viewing distance of 115 cm, each character was extended at a visual angle of about 0.69° ⫻ 0.69°. These characters were in white Xi-Ming font presented on a black background. The participant sat in a dimly lit experimental chamber with a chin rest to fix his or her head position so that the center of the display was kept at about eye level. The participants were asked to respond by pressing two keys on a regular keyboard, and the assignment of yes or no to these two keys was counterbalanced across participants. The display contained 1, 8, or 24 items. The characters were arranged in matrices of 3 ⫻ 3 or 5 ⫻ 5 locations. Each cell in this matrix covered 64 ⫻ 64 pixels, and each character covered 32 ⫻ 32 pixels. The central cell was always occupied by the fixation pattern, which was a plus sign. Each character was randomly positioned at one of the cell locations (except for the central location), with the only constraint being that its entire shape would be within the cell boundary. For the displays of one character, each of the eight cells in the 3 ⫻ 3 matrix was used about equally often, with the exact cell to be presented being randomly assigned. For displays of 8 or 24, each cell of the 3 ⫻ 3 or 5 ⫻ 5 matrices, respectively, was occupied. Figure 5 shows an example of the display pattern of Size 8 in the SsCs condition of the same-radical type and shows the experimental procedure in this experiment. For each target– distractor pair, the three set sizes (1, 8, and 24) were each repeated 20 times, with an equal number of target-present and target-absent trials. There were 480 trials (60 trials ⫻ 8 pairs) in total. The four factors (structure, component, set size, and presence) were all manipulated within-subject. A mixed design was used, in which the order of the 480 trials was randomized. Procedure. At the start of each trial, a predesignated target was shown at the center of the monitor. The participant was instructed to press the spacebar to proceed when she or he was ready. Next, the fixation pattern
Figure 5. Visual search procedure of Experiment 2. This example depicts a target-present trial in the structure same, component same (SsCs) condition of the same-radical type.
VISUAL SIMILARITY OF CHINESE CHARACTERS was presented for 500 ms, followed by a 100-ms blank interval, and then the display frame was shown until the participant pressed the response key. Participants were to judge whether the display frame contained the target, as quickly and as accurately as possible. Feedback was provided in the form of a beep, which signaled an incorrect response. The intertrial interval was 1 s. A summary table of mean reaction time and accuracy was presented after every 20-trial session, and the participant could then take a short break.
Results The mean error rate was 6.4%. Table 1 shows the mean reaction times for correct trials and the percentages of error for each condition. Figure 6 shows the RT ⫻ Set Size functions for the four conditions (SsCs, SsCd, SdCs, and SdCd) in the same-radical type (Figures 6A and 6B) and in the same-phonetic type (Figures 6C and 6D). ANOVA of raw data. A five-way within-subject analysis of variance (ANOVA) on the reaction times, with the factors of component function (radical or phonetic), structure (same or different), component repetition (yes or no), set size (1, 8, or 24), and presence (yes or no), was carried out using ANOVA software (Chen & Cheng, 1999). The main effects of component function, F(1, 13) ⫽ 13.229, MSE ⫽ 17,944.198, p ⬍ .005, structure, F(1, 13) ⫽ 56.391, MSE ⫽ 138,124.742, p ⬍ .0001, component repe-
941
tition, F(1, 13) ⫽ 62.208, MSE ⫽ 30,874.775, p ⬍ .0001, presence, F(1, 13) ⫽ 85.005, MSE ⫽ 75,361.653, p ⬍ .0001, and set size, F(2, 26) ⫽ 72.821, MSE ⫽ 325,740.711, p ⬍ .0001, were significant. Trend analysis of the set size shows that a linear trend, F(1, 26) ⫽ 144.184, MSE ⫽ 325,740.711, p ⬍ .0001, was significant. The two-way interactions of component function and structure, F(1, 13) ⫽ 43.431, MSE ⫽ 16,036.277, p ⬍ .0001, component function and component repetition, F(1, 13) ⫽ 15.192, MSE ⫽ 26,153.458, p ⬍ .005, component function and presence, F(1, 13) ⫽ 8.477, MSE ⫽ 16,990.130, p ⬍ .05, component function and set size, F(2, 26) ⫽ 8.019, MSE ⫽ 8,134.973, p ⬍ .005, structure and component repetition, F(1, 13) ⫽ 30.028, MSE ⫽ 28,009.942, p ⫽ .0001, structure and presence, F(1, 13) ⫽ 21.877, MSE ⫽ 20,821.940, p ⬍ .0005, structure and set size, F(2, 26) ⫽ 30.207, MSE ⫽ 61,388.839, p ⬍ .0001, component repetition and set size, F(2, 26) ⫽ 32.642, MSE ⫽ 15,983.101, p ⬍ .0001, and presence and set size, F(2, 26) ⫽ 47.382, MSE ⫽ 42,572.927, p ⬍ .0001, were all significant. The only nonsignificant two-way interaction was component function and presence, F(1, 13) ⫽ 3.313, MSE ⫽ 28,050.406, p ⫽ .09. There were three-way interactions of component function, structure, and presence, F(2, 26) ⫽ 7.134, MSE ⫽ 19,183.824, p ⬍ .05, component repetition, structure, and presence, F(2, 26) ⫽ 4.888,
Table 1 Reaction Times (RTs; in Milliseconds) and Percentages of Error (PEs) for Each Condition in Experiment 2 Target present Set size and measure
1
8
24
Target absent M
1
8
24
M
Same radical SsCs RT PE SsCd RT PE SdCs RT PE SdCd RT PE
603.2 4.29
926.8 10.71
1,374.5 33.57
968.2 16.19
677.3 10.00
1,338.3 10.00
1,968.1 6.43
1,327.9 8.81
603.1 7.86
858.9 5.00
1,162.1 2.50
874.7 5.12
657.0 5.00
1,086.9 7.86
1,632.1 3.57
1,125.3 5.48
616.4 4.29
678.5 5.00
840.2 5.00
711.7 4.76
598.1 1.43
756.1 2.14
1,182.4 0.00
845.5 1.19
581.4 5.00
745.2 2.86
872.4 3.57
733.0 3.81
595.0 0.71
848.7 0.71
1,217.4 0.71
887.0 0.71
Same phonetic SsCs RT PE SsCd RT PE SdCs RT PE SdCd RT PE
604.1 2.14
919.3 15.00
1,363.5 43.57
962.3 20.24
685.9 11.43
1,092.1 2.85
1,789.4 7.14
1,189.2 7.14
598.3 2.14
770.2 4.29
1,008.4 12.86
792.3 6.43
609.7 7.14
860.6 0.00
1,363.1 1.43
944.5 2.86
608.9 2.86
766.3 10.00
1,011.6 14.29
795.6 9.05
609.9 7.14
836.8 2.86
1,404.4 2.14
950.4 4.05
593.7 3.57
668.0 1.43
850.7 4.29
704.1 3.10
601.8 1.43
761.7 1.43
1,139.5 0.00
834.3 0.95
Note. SsCs ⫽ structure same, component same; SsCd ⫽ structure same, component different; SdCs ⫽ structure different, component same; SdCd ⫽ structure different, component different.
942
YEH AND LI
Figure 6. Reaction times as a function of set size in the visual search paradigm of Experiment 2. Numbers in parentheses indicate the slope values for each condition. A: Same-radical type, target present. B: Same-radical type, target absent. C: Same-phonetic type, target present. D: Same-phonetic type, target absent. SsCs ⫽ structure same, component same; SsCd ⫽ structure same, component different; SdCs ⫽ structure different, component same; SdCd ⫽ structure different, component different.
MSE ⫽ 17,298.445, p ⬍ .05, component function, presence, and set size, F(2, 26) ⫽ 5.043, MSE ⫽ 6,397.091, p ⬍ .05, component function, component repetition, and set size, F(2, 26) ⫽ 7.432, MSE ⫽ 13,574.458, p ⬍ .005, component function, structure, and set size, F(2, 26) ⫽ 13.599, MSE ⫽ 11,513.830, p ⫽ .0001, and component repetition, structure, and set size, F(2, 26) ⫽ 19.017, MSE ⫽ 10,449.224, p ⬍ .0001. Other interactions were not reliable. Simple main effects of the set size for the 16 combinations of component function, structure, component repetition, and presence were all significant ( ps ⬍ .01), indicating nonzero slopes for the eight RT ⫻ Set Size curves. Concerning the ANOVA on the error rates, the main effects of structure, F(1, 13) ⫽ 65.185, MSE ⫽ 0.011, p ⬍ .0001, component repetition, F(1, 13) ⫽ 33.509, MSE ⫽ 0.010, p ⬍ .0001, presence, F(1, 13) ⫽ 40.752, MSE ⫽ 0.016, p ⬍ .0001, and set size, F(2, 26) ⫽ 30.012, MSE ⫽ 0.008, p ⬍ .0001, were significant. Trend analysis of the set size shows that a linear trend, F(1, 26) ⫽ 59.077, MSE ⫽ 0.008, p ⬍ .0001, was significant. The two-way interactions were significant for Structure ⫻ Component repetition, F(1, 13) ⫽ 10.748, MSE ⫽ 0.009, p ⬍ .01, Component Function ⫻ Component Repetition, F(1, 13) ⫽ 9.869, MSE ⫽
0.009, p ⬍ .01, Structure ⫻ Presence, F(1, 13) ⫽ 14.712, MSE ⫽ 0.005, p ⬍ .005, Component Repetition ⫻ Presence, F(1, 13) ⫽ 6.257, MSE ⫽ 0.007, p ⬍ .05, Structure ⫻ Set Size, F(2, 26) ⫽ 32.715, MSE ⫽ 0.005, p ⬍ .0001, Component Repetition ⫻ Set Size, F(2, 26) ⫽ 17.202, MSE ⫽ 0.003, p ⬍ .0001, and Presence ⫻ Set Size, F(2, 26) ⫽ 61.149, MSE ⫽ 0.006, p ⬍ .0001. The three-way interactions were significant for Component Function ⫻ Component Repetition ⫻ Presence, F(1, 13) ⫽ 6.100, MSE ⫽ 0.006, p ⬍ .05, Component Repetition ⫻ Presence ⫻ Set Size, F(2, 26) ⫽ 12.676, MSE ⫽ 0.007, p ⬍ .0001, and Structure ⫻ Presence ⫻ Set Size, F(2, 26) ⫽ 24.035, MSE ⫽ 0.009, p ⬍ .0001. The four-way interaction of Component Repetition ⫻ Structure ⫻ Presence ⫻ Set Size, F(2, 26) ⫽ 5.600, MSE ⫽ 0.006, p ⬍ .01, was also significant, but not the five-way interaction of all the factors. The result pattern of the error rates was, in general, similar to that of the reaction times, indicating no speed–accuracy trade-off. ANOVA of slopes. A more relevant analysis was the ANOVA of the slopes in the RT ⫻ Set Size functions across different conditions. We calculated the slope values for each participant, separately for the target-present trials and the target-absent trials
VISUAL SIMILARITY OF CHINESE CHARACTERS
under the four conditions of the two target– distractor types, by taking the mean RT at each set size under each condition and fitting it with a linear function. An ANOVA on the mean slopes with the factors of component function (radical or phonetic), structure (same or different), component repetition (yes or no), and presence (yes or no) was performed. There were significant main effects of structure, F(1, 13) ⫽ 30.353, MSE ⫽ 409.724, p ⫽ .0001, component repetition, F(1, 13) ⫽ 43.617, MSE ⫽ 85.714, p ⬍ .0001, and presence, F(1, 13) ⫽ 50.626, MSE ⫽ 286.146, p ⬍ .05. The component function was not significant, F(1, 13) ⫽ 1.266, MSE ⫽ 45.595, p ⫽ .28. The two-way interactions were significant for Structure ⫻ Component Repetition, F(1, 13) ⫽ 24.937, MSE ⫽ 46.847, p ⬍ .0005, Component Function ⫻ Component Repetition, F(1, 13) ⫽ 7.989, MSE ⫽ 85.930, p ⬍ .05, and Component Function ⫻ Structure, F(1, 13) ⫽ 15.995, MSE ⫽ 62.552, p ⬍ .01. No interaction effect of Component Function ⫻ Presence was found, F(1, 13) ⫽ 2.189, MSE ⫽ 28.960, p ⫽ .167, indicating that the result patterns in the target-present trials and in the target-absent trials were the same for the two types of target– distractor pairs (see Figure 6). Neither the three-way nor the four-way interactions were significant. Further analysis of the simple main effect of Structure ⫻ Component Repetition showed that the simple main effect of structure was significant for the same-component conditions, F(1, 26) ⫽ 46.494, MSE ⫽ 10,613.993, p ⬍ .0001, and for the differentcomponent conditions, F(1, 26) ⫽ 13.101, MSE ⫽ 2,990.701, p ⬍ .005. The simple main effect of component was significant for the same-structure conditions, F(1, 26) ⫽ 68.547, MSE ⫽ 4,543.288, p ⬍ .0001, and for the different-structure conditions, F(1, 26) ⫽ 5.485, MSE ⫽ 363.550, p ⬍ .05, as well. The analysis of the simple main effect of Structure ⫻ Component Function revealed that the effects of structure were significant when the repeated components were radicals, F(1, 26) ⫽ 43.390, MSE ⫽ 10,245.951, p ⬍ .0001, and when they were phonetics, F(1, 26) ⫽ 13.513, MSE ⫽ 3,191.035, p ⬍ .005. The simple main effects of component function were significant when the structure was the same, F(1, 26) ⫽ 14.229, MSE ⫽ 769.431, p ⬍ .0005, and when it was different, F(1, 26) ⫽ 5.341, MSE ⫽ 288.810, p ⬍ .05. Concerning the simple main effect of Component Function ⫻ Component Repetition, the simple main effect of component repetition was significant in the same-radical type, F(1, 26) ⫽ 7.114, MSE ⫽ 610.537, p ⫽ ⬍.05, and in the same-phonetic type, F(1, 26) ⫽ 44.447, MSE ⫽ 3,814.526, p ⬍ .0001. The simple main effect of component function was significant in the differentcomponent conditions, F(1, 26) ⫽ 8.685, MSE ⫽ 571.139, p ⬍ .01, but not in the same-component conditions, F(1, 26) ⫽ 2.631, MSE ⫽ 173.036, p ⫽ .13. Although the statistics indicate a main effect of presence, no interactions of presence with other factors were found. Because no three-way or four-way interactions were found, to compare the four curves in each panel of Figure 6, we carried out another ANOVA by combining structure and component as one factor (condition) with four levels (SsCs, SsCd, SdCs, and SdCd). There were thus three factors: component function, presence, and condition. The main effects of presence, F(1, 13) ⫽ 59.647, MSE ⫽ 214.629, p ⬍ .0001, and condition, F(3, 13) ⫽ 30.753, MSE ⫽ 157.319, p ⬍ .0001, were significant, but not the component function, F(1, 13) ⫽ 2.051, MSE ⫽ 1,850.455, p ⫽ .18. A planned comparison (Tukey’s significant difference test) of the main effect
943
of condition showed that the slope value was significantly higher in the SsCs condition than in the other three conditions (SsCd, SdCs, and SdCd), and the slope value in the SsCd condition was also significantly higher than in the other two conditions (SdCs and SdCd). The interaction of component function and condition was significant, F(3, 39) ⫽ 9.862, MSE ⫽ 74.626, p ⫽ .0001. No other interactions were found. Further analyses of the interaction effect of component function and condition showed that the simple main effects of condition were significant when the repeated components were the radical, F(3, 78) ⫽ 34.161, MSE ⫽ 115.972, p ⬍ .0001, and when they were the phonetic, F(3, 78) ⫽ 13.902, MSE ⫽ 115.972, p ⬍ .0001. A planned comparison showed that for the same-radical type, the slope value was significantly higher in the SsCs condition than in the other three conditions, and the slope value in the SsCd condition was also significantly higher than in the other two conditions (SdCs and SdCd). For the same-phonetic type, the slope value was significantly higher in the SsCs condition than in the other three conditions, and the slope value in the SdCd condition was significantly lower than in the other three conditions (SsCs, SsCd, and SdCs).
Discussion The main effects of structure and component indicate that in a visual search task, both the structure and the components of a Chinese character affect the efficiency of the search for the target character. Searches for a target among distractors with different structures were more efficient than searches for a target among distractors with the same structure. Also, searches for a target among distractors that did not share any components with the target were more efficient than searches for a target among distractors with one common component. When the target and the distractors had the same structure and shared one common component, search efficiency was lowest, as reflected by the steepest search slope, which was that for condition SsCs in Figure 6. This was true regardless of whether the common components were radicals or phonetics, because there was no main effect of component function on the search efficiency. Despite the absence of a main effect of component function, we found the interaction effect of component function and condition to be quite intriguing. When the repeated components were the radical, the slope values in the SsCs and SsCd conditions were significantly higher than those in the other two conditions, SdCs and SdCd (Figures 6A and 6B). This indicates that regardless of whether the target– distractor pair shared one common component, when the target and the distractors had the same structure, the similarity increased (thus, search efficiency decreased), as compared with when their structures were different. However, the effect of component was significant only when the target– distractor pairs shared the same structure (the slope value in the SsCs condition was higher than that in the SsCd condition), but not when they had different structures (no difference was found between the slope values in the SdCs and SdCd conditions). That is, the structure seemed to play a more important role than the components in the visual similarity of target– distractor pairs when the repeated components were radicals. This was not the case in the same-phonetic type, however (see Figures 6C and 6D). When both the structure and one of the
944
YEH AND LI
components in the target– distractor pair were the same (i.e., SsCs), the slope value was the steepest, indicating that the similarity between the pair was the highest. When both the structure and the components were different (i.e., SdCd), the slope value was the most shallow, indicating that the similarity between the pair was the lowest. Only when the structure was different (i.e., SdCs) or all the components were different (i.e., SsCd) were slope values, and the similarity relationships, yielded between the SsCs and SdCd conditions. That is, the structure and the components seemed to be two independent factors in the same-phonetic type; therefore, their effects tended to be additive. It thus appears that the two kinds of components exert their effects differently, in that the radical component seems more correlated with the structure, but the phonetic component can be more or less independent of structure. For example, with the characters and , and and , the radical is typically presented on the left of the character, as in the target , and is seldom presented on the bottom, as in . Therefore, when it occurs in an atypical position, as in , it may not be recognized as an independent component. Therefore, the effect of searching for among is similar to searching for among . This was not the case for the phonetic component , however. Searching for among is less efficient than searching for among , suggesting that in the target– distractor pair of and , the common component shared by the target and the distractors (i.e., ) may have been recognized as an independent component in the target ( ) as well as in the distractors ( ). Because the proportion of the component usually changes when the structure changes, and changes more so for the radical component than for the phonetic component, can the difference in the proportion of the component account for the interaction effect of component function and condition? We calculated the proportion of each component by dividing the number of pixels each component occupied by the total number of pixels of the whole character in the graphic file of our display. We then compared the proportions of the repeated radical or the repeated phonetic in the different structure conditions. The proportion of the radical in the two different-structure characters and was .76:1, and the proportion of the phonetic in the different-structure characters and was .78:1. Therefore, the proportions of the common component were about the same, which cannot account for the difference in the curves of Figure 6. Nevertheless, the difference in the proportions of the component may account for the effect of structure on the visual similarity between characters. For the same-structure characters, the proportions of the common radical (e.g., in and ) and common phonetic (e.g., in and ) were 1:1 and .92:1, respectively, and both were higher than the proportions in the different-structure characters for the same-radical type (.76:1) and for the samephonetic type (.78:1). As mentioned before, character structure is formed by the spatial layout of the components, which may vary with the relative position and the relative proportion of the components. The slope values in the target-absent trials were higher than those in the target-present trials, as expected for visual search results. Furthermore, the general patterns of results, as shown in the four curves of each panel in Figure 6, are virtually the same across the target-present and target-absent trials for each type, indicating the consistency of these results.
In summary, in visual search, both the structure and the components play important roles in visual similarity between characters. However, the radical component seems to be coupled with structure more than the phonetic component. The effect of structure may be partially accounted for by the proportional change of the component as structure varies.
General Discussion We have demonstrated, by using a sorting task and a visual search task, the importance of character structure in visual similarity of Chinese characters. In a sorting task as used in Experiments 1A and 1B, participants tended to categorize the shapes of various characters by their structures but not by their common components. In an RT measure of a visual search task, we showed, in Experiment 2, that both structure and component affected the similarity perceived to exist between the target and the distractors. When the target and the distractors shared the same structure and one common component, the search slope was the steepest, because these characters appeared the most similar. Thus, systematic manipulation of structure and component in this study, which was not present in our previous studies (Yeh, 2000; Yeh et al., 1997; Yeh, Li, & Chen, 1999; Yeh, Li, Takeuchi, et al., 1999), revealed the relative role that the configurational structure and the components of Chinese characters play in visual similarity. In visual search, the pattern of the steepest slopes (thus the lowest search efficiency) being found in the SsCs condition compared with the other three conditions was very robust, because it recurred for the same-radical type and the same-phonetic type, as well as for the target-present trials and the target-absent trials. Therefore, when both the structure and one component were the same for the target– distractor pairs, the perceived similarity between them was the highest, compared with when the structures, the components, or both were different. The effect of component function was manifested through its interaction with component repetition and structure. When the repeated component was the radical, the structure seemed to be more important in similarity measures than when the repeated component was the phonetic, indicating a possible covariation between structure and the radical. As mentioned before, this may be inherent in the formation rules of Chinese characters. What is evident here, however, is that although, in a sorting task, the participants failed to sort characters by their radicals or phonetics, the two kinds of components did exert their effects differently in a more indirect measure of visual search, and the difference in their effects may have resulted from their relationship with the character’s structure. Whereas the radical is interdependent with the structure, the phonetic seems to be more independent as a unit. This is consistent with recent studies that stress the particular role of the radical in Chinese characters (Chen & Allport, 1995; Chen, Allport, & Marshall, 1996; Feldman & Siok, 1997, 1999; Leck et al., 1995). When comparing the results of sorting in Experiments 1A and 1B with those of visual search in Experiment 2, a character’s components seem to play a more important role in visual search than in sorting. The results from MDS and cluster analysis in Experiments 1A and 1B showed that subjective judgments of shape similarity using a sorting task were mainly based on the constructive structure of the characters. When the stimuli were presented at a shorter duration, as in RT measurements in visual
VISUAL SIMILARITY OF CHINESE CHARACTERS
search, and when no explicit demand to sort by shape was made, the characters’ components started to show their effect. Nevertheless, as this comparison is inevitably between tasks differing in stimulus items, procedures, and task demands, we do not make too much of this difference. The role of structure in character recognition as revealed in this study indicates that more elaborate models concerning the processing of written Chinese characters are needed. In the past, studies on the sublexical components in written Chinese were relatively intensive, as compared with few, if any, studies on the spatial layout of these components (i.e., the structure). The empirical evidence concerning the role of structure in this study may thus provide a useful contribution both theoretically and empirically. For the present study, the most relevant model may be the interactive activation model of Taft and Zhu (1994) that was originally adopted from studies based on alphabetic scripts (e.g., McClelland & Rumelhart, 1981; Rumelhart & McClelland, 1982). In this model, the lexicon is made up of hierarchical levels of nodes, including strokes, components, characters, and words. Nodes at the same level have inhibitory connections, and nodes at different levels have excitatory connections. Components are located at the second level, preceding the level of characters. Whether these components are separated into independent sets according to their relative positions at the character level was not specified, although hints indicated possible position sensitivity at this level (Taft & Zhu, 1997; Taft et al., 1999; however, see Feldman & Siok, 1997). At what level should the structure of characters be placed? It might be at the same level of the components if the components are position sensitive. Alternatively, structure might be placed at the character level once the whole character is recognized. Whatever the levels, the findings reported in this study call for consideration of configurational structure in models of Chinese character recognition. Besides these theoretical issues, there are practical methodological implications as well. As mentioned before, character structure has long been overlooked in choosing Chinese characters as experimental materials. Our results demonstrate the importance of structure in visual similarity of Chinese characters and may provide useful information in using Chinese characters as experimental materials. For example, many researchers in this field define visual similarity between characters by considering only whether a repeated component exists. That is, characters that share one common component are defined as visually similar, and characters that share no common component are defined as visually dissimilar. Because of disregard to the dimension of character structure, some may leave this dimension unspecified while many choose to keep the character structure constant (although this is usually not explicitly stated). According to such common practice, visually similar characters may correspond to those in our SsCs condition of the visual search task, and visually dissimilar characters may correspond to those in the SsCd condition. The difference in the search slopes for these two conditions was smaller than the difference between SsCs and SdCd, regardless of whether the common component in the SsCs condition was the radical or the phonetic. Thus, there is a caveat here. The structure dimension should be taken into consideration when using Chinese characters as experimental materials. A useful suggestion that emerges from this study is then the following: The processing difference between visually similar and visually dissimilar characters can be further
945
enlarged by choosing characters with the same structure and one common component (i.e., SsCs) as opposed to characters with different structures and no common components (i.e., SdCd).
References Academia Sinica. (1993). Corpus-based frequency count of characters in journal Chinese. Taipei, Taiwan: Author. Biederman, I., & Tsao, Y. C. (1979). On processing Chinese ideographs and English words: Some implications from Stroop-test results. Cognitive Psychology, 11, 125–132. Chan, S. C. (1992). Neural network approach for Chinese character recognition. Computer Processing of Chinese and Oriental Languages, 10, 365–370. Chen, Y. P., & Allport, D. A. (1995). Attention and lexical decomposition in Chinese word recognition: Conjunctions of form and position guide selective attention. Visual Cognition, 2, 235–268. Chen, Y. P., Allport, D. A., & Marshall, J. C. (1996). What are the functional orthographic units in Chinese word recognition: The stroke or the stroke pattern? Quarterly Journal of Experimental Psychology: Human Experimental Psychology, 49(A), 1024 –1043. Chen, H. C., & Cheng, C. M. (1999). ANOVA and trend analysis statistical program for cognitive experiment. Research in Applied Psychology, 1, 229 –246. Chen, H. C., Flores d’Arcais, G. B., & Cheung, S. L. (1995). Orthographic and phonological activation in recognizing Chinese characters. Psychological Research, 58, 144 –153. Chen, H. C., & Juola, J. F. (1982). Dimensions of lexical coding in Chinese and English. Memory & Cognition, 10, 216 –224. Cheng, C. M. (1982). Analysis of present day Mandarin. Journal of Chinese Linguistics, 10, 282–358. Chua, F. K. (1999). Phonological recording in Chinese logograph recognition. Journal of Experimental Psychology: Learning, Memory, and Cognition, 25, 876 – 891. Coltheart, M. (1978). Lexical access in a simple reading task. In G. Underwood (Ed.), Strategies in information processing (pp. 151–216). London: Academic Press. Duncan, J., & Humphreys, G. W. (1989). Visual search and stimulus similarity. Psychological Review, 96, 433– 458. Fang, S. P., & Wu, P. (1989). Illusory conjunctions in the perception of Chinese characters. Journal of Experimental Psychology: Human Perception and Performance, 15, 434 – 447. Feldman, L. B., & Siok, W. W. T. (1997). The role of component function in visual recognition of Chinese characters. Journal of Experimental Psychology: Learning, Memory, and Cognition, 23, 776 –781. Feldman, L. B., & Siok, W. W. T. (1999). Semantic radicals contribute to the visual identification of Chinese characters. Journal of Memory and Language, 40, 559 –576. Flores d’Arcais, G. B. (1992). Graphemic, phonological, and semantic activation processes during the recognition of Chinese characters. In H. C. Chen & O. J. L. Tzeng (Eds.), Language processing in Chinese (pp. 37– 66). Amsterdam: North-Holland. Flores d’Arcais, G. B., Saito, H., & Kawakami, M. (1995). Phonological and semantic activation in reading Kanji characters. Journal of Experimental Psychology: Learning, Memory, and Cognition, 21, 34 – 42. Forster, K. I. (1976). Accessing the internal lexicon: In R. J. Wales & E. C. T. Walker (Eds.), New approaches to language mechanisms (pp. 257–287). Amsterdam: North-Holland. Huang, J. T., & Wang, M. Y. (1992). From unit to Gestalt: Perceptual dynamics in recognizing Chinese characters. In H. C. Chen & O. J. L. Tzeng (Eds.), Language processing in Chinese (pp. 3–35). Amsterdam: North-Holland. Johnson, S. (1967). Hierarchical clustering schemes. Psychometrika, 32, 241–254.
946
YEH AND LI
Kruskal, J. B. (1964a). Multidimensional scaling by optimizing goodness of fit to a nonmetric hypothesis. Psychometrika, 29, 1–27. Kruskal, J. B. (1964b). Nonmetric multidimensional scaling: A numerical method. Psychometrika, 29, 115–129. Kruskal, J. B., & Wish, M. (1978). Multidimensional scaling. London: Sage. Leck, K. J., Weekes, B. S., & Chen, M. J. (1995). Visual and phonological pathways to the lexicon: Evidence from Chinese readers. Memory & Cognition, 23, 468 – 476. Liu, I. M. (1984). Recognition of fragment-deleted characters and words. Computer Processing of Chinese and Oriental Languages, 1, 276 –287. Liu, I. M. (1995). Script factors that affect literacy: Alphabetic vs. logographic languages. In I. Taylor & D. R. Olson (Eds.), Scripts and literacy (pp. 145–162). Dordrecht, the Netherlands: Kluwer. Liu, I. M., Su, I. R., & Chen, S. C. (2001). The phonetic function of Chinese phonetic radicals. Kaohsiung, Taiwan: Kaohsiung Fu-Weng. Liu, I. M., & Yeh, Y. Y. (1977). Studies of Chinese anagrams: I. Anagrams of one-character words. Psychological Testing (Taipei), 24, 24 –31. Liu, I. M., Chang, B. H., & Yang, Y. T. (1979). Constructing a word construction test. Chinese Journal of Psychology, 21, 85–90. McClelland, J. L., & Rumelhart, D. E. (1981). An interactive activation model of context effects in letter perception: 1. An account of basic findings. Psychological Review, 88, 375– 407. Morton, J., & Patterson, K. (1980). A new attempt at an interpretation, or an attempt at a new interpretation. In M. Coltheart, K. E. Patterson, & J. C. Marshall (Eds.), Deep dyslexia (pp. 91–118). New York: Routledge, Chapman & Hall. New eastern Chinese dictionary (2nd ed.). (1986). Taipei, Taiwan: Eastern Publishing. Park, S., & Arbuckle, T. Y. (1977). Ideograms versus alphabets: Effects of script on memory in “biscriptural” Korean subjects. Journal of Experimental Psychology: Human Learning and Memory, 3, 631– 642. Perfetti, C. A., & Tan, L. H. (1998). The time course of graphic, phonological, and semantic activation in Chinese character identification. Journal of Experimental Psychology: Learning, Memory, and Cognition, 24, 101–118. Perfetti, C. A., & Zhang, S. (1991). Phonological processes in reading Chinese characters. Journal of Experimental Psychology: Learning, Memory, and Cognition, 17, 633– 643. Rumelhart, D. E., & McClelland, J. L. (1982). An interactive activation model of context effects in letter perception: 2. Psychological Review, 89, 60 –94. Sasanuma, S. (1975). Kana and Kanji processing in Japanese aphasics. Brain and Language, 2, 369 –383. Sasanuma, S., Itoh, M., Kobayashi, Y., & Mori, K. (1980). The nature of the task–stimulus interaction in the tachistoscopic recognition of Kana and Kanji words. Brain and Language, 9, 298 –306. Shepard, R. N. (1962a). The analysis of proximities: Multidimensional scaling with an unknown distance function. I. Psychometrika, 27, 125– 139.
Shepard, R. N. (1962b). The analysis of proximities: Multidimensional scaling with an unknown distance function. II. Psychometrika, 27, 219 –246. Taft, M., & Zhu, X. (1994). The representation of bound morphemes in the lexicon: A Chinese study. In L. Feldman (Ed.), Morphological aspects of language processing (pp. 293–316). Hillsdale, NJ: Erlbaum. Taft, M., & Zhu, X. (1997). Submorphemic processing in reading Chinese. Journal of Experimental Psychology: Learning, Memory, and Cognition, 23, 761–775. Taft, M., Zhu, X., & Peng, D. (1999). Positional specificity of radicals in Chinese character recognition. Journal of Memory and Language, 40, 498 –519. Takane, Y., Young, F. W., & de Leeuw, J. (1977). Nonmetric individual differences multidimensional scaling: An alternating least-squares method with optimal scaling features. Psychometrika, 42, 7– 67. Tan, L. H., Hoosain, R., & Siok, W. W. T. (1996). Activation of phonological codes before access to character meaning in written Chinese. Journal of Experimental Psychology: Learning, Memory, and Cognition, 22, 865– 882. Tsai, C. H. (1996). Frequency and stroke counts of Chinese characters. Retrieved April 1, 2001, from http://www.geocities.com/hao510/ charfreq Tzeng, O. J. L., & Hung, D. L. (1988). Cerebral organization: Clues from scriptural effects on lateralization. In I. M. Liu, H. C. Chen, & M. J. Wang (Eds.), Cognitive aspects of the Chinese language (Vol. 1, pp. 119 –139). Hong Kong: Asian Research Service. Wang, W. S.-Y. (1973). The Chinese language. Scientific American, 228, 50 – 60. Wu, J. T. (1990). Participant differences in Chinese character matching. Chinese Journal of Psychology, 32, 63–74. Yeh, S. L. (2000). Structure detection of Chinese characters: Visual search slope as an index of similarity between different-structured characters. Chinese Journal of Psychology, 42, 191–216. Yeh, S. L., Li, J. L., & Chen, I. P. (1997). The perceptual dimensions underlying the classification of the shapes of Chinese characters. Chinese Journal of Psychology, 39, 47–74. Yeh, S. L., Li, J. L., & Chen, K. M. (1999). Classification of the shapes of Chinese characters: Verification by different pre-designated categories and varied sample sizes. Chinese Journal of Psychology, 41, 65– 85. Yeh, S. L., Li, J. L., Takeuchi, T., Sun, V. C., & Liu, W. R. (1999, August). The influence of learning experience and cognitive structure on the classification of the shapes of Chinese characters. Poster session presented at the third conference of the Asian Association of Social Psychology, Taipei, Taiwan. Yeh, J. S., & Liu, I. M. (1972). Factors affecting recognition thresholds of Chinese characters. Acta Psychologica Taiwanica, 14, 113–117. Yin, B., & Rohsenow, J. S. (1994). Modern Chinese characters. Beijing, China: Sinolingua. Zhou, Y.-G. (1978). To what degree are the “phonetics” of present-day Chinese characters still phonetic? Zhongguo Yuwen, 146, 172–177.
VISUAL SIMILARITY OF CHINESE CHARACTERS
947
Appendix A Stimulus Materials for Experiment 1 Table A1 Type 1: Same Radical
Table A3 Type 3: Same Structure Structure
Radical
Horizontal (11) (16) (9) (10)
Horizontal Vertical
Bounded
(11) (16) (9) (11)
(11) (16) (9) (9)
(11) (16) (9) (10) (13) (11) (15) (13)
Vertical
Bounded
(11) (16) (9) (11) (13) (12) (15) (14)
(11) (16) (9) (9) (11) (13) (13) (13)
Table A2 Type 2: Same Phonetic Structure Phonetic
Horizontal (11) (11) (15) (13)
Vertical
Bounded
(13) (12) (15) (14)
(11) (13) (13) (13)
Table A4 Foils (9) (13)
(12) (12)
(12) (8)
Note. The number in parentheses after each character indicates its stroke count.
Appendix B Stimulus Materials for Experiment 2 Distractors Property
Target
SsCs
SsCd
SdCs
SdCd
10 29,257
10 30,215
10 27,695
9 890
9 961
Same radical Character Stroke count Frequency
10 15,556
10 28,912
Same phonetic Character Stroke count Frequency
8 72,626
8 8,122
8 8,543
Note. SsCs ⫽ structure same, component same; SsCd ⫽ structure same, component different; SdCs ⫽ structure different, component same; SdCd ⫽ structure different, component different.
Received June 13, 2000 Revision received September 28, 2001 Accepted December 18, 2001 䡲