capacity of multi-hop wireless networks, such as directional antennas, improved MACs .... in the network. 4. A component that uses the link weights to find a good.
Routing in Multi-Radio, Multi-Hop Wireless Mesh Networks Richard Draves
Jitendra Padhye
Brian Zill
Microsoft Research {richdr,
padhye, bzill}@microsoft.com
ABSTRACT
focus in such environments is to provide scalable routing in the presence of mobile nodes. Recently, interesting commercial applications of multi-hop wireless networks have emerged. One example of such applications is “community wireless networks” [6, 37, 35, 27]. Several companies [31, 34] are field-testing wireless networks to provide broadband Internet access to communities that previously did not have such access. In such networks, most of the nodes are either stationary or minimally mobile and do not rely on batteries. Hence, the focus of routing algorithms is on improving the network capacity or the performance of individual transfers, instead of coping with mobility or minimizing power usage. One of the main problems facing such networks is the reduction in total capacity due to interference between multiple simultaneous transmissions [21]. Providing each node with multiple radios offers a promising avenue for improving the capacity of these networks [5, 2]. First, it enables nodes to transmit and receive simultaneously. Otherwise, with only one radio, the capacity of relay nodes is halved. Second, the network can utilize more of the radio spectrum. With two radios, a node may transmit on two channels simultaneously. Third, radios that operate on different frequency bands (for example, 802.11a at 5Ghz and 802.11b/g at 2.4Ghz) have different bandwidth, range, and fading characteristics. Using multiple heterogeneous radios offers tradeoffs that can improve robustness, connectivity, and performance. Finally, 802.11 radios are off-theshelf commodity parts with rapidly diminishing prices. This makes it natural to consider the use of multiple inexpensive radios per node. There are other promising approaches for improving the capacity of multi-hop wireless networks, such as directional antennas, improved MACs, and channel switching. We believe that these alternative approaches are complementary to the use of multiple radios. We will discuss this in more detail in Section 7. When network nodes have multiple radios, the shortestpath algorithm does not perform well. This is illustrated by the following two scenarios. First, consider a network in which each node has an 802.11a and an 802.11b radio. Since 802.11b radios generally have longer range than 802.11a radios, if we use shortest-path routing, most of the traffic in the network will be carried over the slower 802.11b links. This is clearly not desirable. Second, consider a network in which each node has two 802.11b radios, one tuned to channel 1 and the other tuned to channel 11. Consider a 2-hop (3 nodes) path in this network. A path that is entirely over
We present a new metric for routing in multi-radio, multihop wireless networks. We focus on wireless networks with stationary nodes, such as community wireless networks. The goal of the metric is to choose a high-throughput path between a source and a destination. Our metric assigns weights to individual links based on the Expected Transmission Time (ETT) of a packet over the link. The ETT is a function of the loss rate and the bandwidth of the link. The individual link weights are combined into a path metric called Weighted Cumulative ETT (WCETT) that explicitly accounts for the interference among links that use the same channel. The WCETT metric is incorporated into a routing protocol that we call Multi-Radio Link-Quality Source Routing. We studied the performance of our metric by implementing it in a wireless testbed consisting of 23 nodes, each equipped with two 802.11 wireless cards. We find that in a multi-radio environment, our metric significantly outperforms previously-proposed routing metrics by making judicious use of the second radio.
Categories and Subject Descriptors C.2.1 [Network Architecture and Design]: Wireless Networks
General Terms Measurement, Performance, Experimentation
Keywords Wireless multi-hop networks, multi-radio, routing, performance
1.
INTRODUCTION
Routing in ad-hoc wireless networks has been an active area of research for many years. Much of the original work in the area was motivated by mobile application environments, such as battlefield ad-hoc networks. The primary
Permission to make digital or hard copies of all or part of this work for personal or classroom use is granted without fee provided that copies are not made or distributed for profit or commercial advantage and that copies bear this notice and the full citation on the first page. To copy otherwise, to republish, to post on servers or to redistribute to lists, requires prior specific permission and/or a fee. MobiCom’04, Sept. 26-Oct. 1, 2004, Philadelphia, Pennsylvania, USA. Copyright 2004 ACM 1-58113-868-7/04/0009 ...$5.00.
114
implies that the ETX metric is bidirectional—the metric from x to y is the same as the metric from y to x. Although the ETX metric performs better than shortestpath routing [15, 16], it will not necessarily select good routes in the two scenarios discussed earlier. In the scenario with an 802.11a and an 802.11b radio per node, ETX will route most of the traffic on the 802.11b links. This is due to two reasons. First, ETX only considers loss rates on the links and not their bandwidths. Second, in an attempt to minimize global resource usage, ETX is designed to give preference to shorter paths over longer paths, as long as loss rates on the shorter paths are not significantly higher. These two factors will ensure that most of the paths selected by ETX will use the 802.11b links. In the scenario with two 802.11b radios per node, ETX is again likely to select sub-optimal paths since ETX will not give any preference to channel-diverse paths. Therefore it will not derive full benefit from the availability of two radios.
channel 1 or 11 will have significantly worse throughput than a path in which the the two hops are on different channels. A shortest-path algorithm that selects a path without ensuring that the hops are on different channels will not perform well. What we need is a new routing metric, designed from the ground-up for heterogeneous, multi-radio environments. In this paper we propose such a metric and present its implementation in a protocol that we call Multi-Radio LinkQuality Source Routing (MR-LQSR) protocol. We compare the performance of our metric against other routing metrics in a 23-node multi-radio wireless testbed. The results from the testbed study show that our metric significantly outperforms previously-proposed metrics.
2.
WHY A NEW ROUTING METRIC?
Much prior research [43, 4, 24, 13, 18, 20] has recognized the shortcomings of shortest-path routing in multi-hop wireless networks. In this section, we will focus on the ETX (Expected Transmission Count) routing metric proposed by De Couto et al. [15]. Section 7 discusses other related work. The work of De Couto et al. shares our goal of using inexpensive, commodity hardware to build and deploy multi-hop wireless networks. They also use a similar indoor testbed environment with stationary nodes for evaluation. Although ETX does very well in homogeneous single-radio environments, as we will show it does not perform as well in environments with different data rates or multiple radios. We will first review the definition of ETX and then discuss its performance. The ETX metric measures the expected number of transmissions, including retransmissions, needed to send a unicast packet across a link. The derivation of ETX starts with measurements of the underlying packet loss probability in both the forward and reverse directions; denoted by pf and pr , respectively; and then calculates the expected number of transmissions. We begin by calculating the probability that a packet transmission is not successful. The 802.11 protocol requires that for a transmission to be successful, the packet must be successfully acknowledged. Let p denote the probability that the packet transmission from x to y is not successful:
3. THE MR-LQSR PROTOCOL MR-LQSR is a combination of the LQSR protocol [16] with a new metric that we call WCETT (Weighted Cumulative Expected Transmission Time). LQSR is a source-routed link-state protocol derived from DSR [26]. A link-state protocol consists of four components: 1. A component that discovers the neighbors of a node. 2. A component that assigns weights to the links a node has with its neighbors. 3. A component to propagate this information to other nodes in the network. 4. A component that uses the link weights to find a good path for a given destination. In other words, the link weights are combined to form a path metric. The first and the third components of MR-LQSR are similar to the corresponding components in DSR. We will not discuss them further except to briefly point out some implementation-related issues later in the paper. The second and the fourth components of MR-LQSR are very different from DSR. DSR assigns equal weight to all links in the network. The path metric is simply the sum of link weights along the path. Thus, DSR implements shortest-path routing. Instead of shortest-path, MR-LQSR uses the WCETT metric. Before we go into the details of how WCETT assigns link weights and combines them into a path metric, it is useful to discuss certain assumptions that we made while designing MR-LQSR, as well as the overall design goals.
p = 1 − (1 − pf ) ∗ (1 − pr ) The 802.11 MAC will retransmit a packet whose transmission was not successful. Let the probability that the packet will be successfully delivered from x to y after k attempts be denoted by s(k). Then: s(k) = pk−1 ∗ (1 − p)
(1)
Finally, the expected number of transmissions required to successfully deliver a packet from x to y is denoted by ETX: ∞
k ∗ s(k) =
ETX = k=1
1 1−p
3.1 Assumptions and Goals We begin by listing the assumptions we made about the networks in which MR-LQSR is supposed to operate. These assumptions are not necessary for the correct operation of MR-LQSR. We will discuss them later in the paper.
(2)
The path metric is the sum of the ETX values for each link in the path. The routing protocol selects the path with minimum path metric. Equation (2) assumes that the probability that a given packet is lost in transmission is independent of its size, and is independent and identically distributed. The Equation also
• All nodes in the network are stationary. • Each node is equipped with one or more 802.11 radios. These can be a mix of 802.11a, b or g radios. The number of radios on each node need not be the same.
115
• We assume that if a node has multiple radios, they are tuned to different, non-interfering channels. The channel assignment is determined by some outside agency [44, 12], and changes relatively infrequently. We have three main design goals for MR-LQSR. First, the MR-LQSR protocol should take both the loss rate and the bandwidth of a link into account while considering it for inclusion in a path. Since the 802.11 MAC incorporates an ARQ (retransmit) mechanism, the transmission time of a packet on a wireless link depends on both the bandwidth of the link and the PHY-layer loss rate. Second, the path metric, which combines the weight of individual links, should be increasing. That is, if we add a hop to an existing path, the cost of the path must never decrease and our preference is that it should increase. This is due to three reasons. First, by traversing an extra hop, the flow is consuming more resources. By ensuring that paths with fewer hops are favored over paths with more hops, we are attempting to minimize the impact this flow has on other flows in the networks. Second, by adding a hop, we are increasing the total delay along the path. For a TCP connection, this would mean increased round trip time, and hence reduced throughput. Third, the non-decreasing property lets us use Dijkstra’s algorithm to find paths. Third, The path metric should explicitly account for the reduction in throughput due to interference among links that operate on the same channel. Similarly, it should also account for the fact that links along a path that do not operate on the same channel do not interfere with one another. Hence, a path that is made up of hops on different channels is better than a path where all the hops are on the same channel. However, this does not mean that we should add links to a path merely to get channel diversity.
this property, since we are not distinguishing between hops that are on different channels. To reflect this, our metric will require an additional term. Consider a two-hop path, in which both hops interfere with one another. In other words, only one of the hops can operate at a time. Assume that each hop has a bandwidth of B. If we ignore packet losses for the moment, then the expected transmission time of a packet along each hop will also be equal. Let us denote this by T. Note that T is inversely proportional to B. Due to interference, the maximum bandwidth a flow can achieve along this path is equal to B/2. Since T is inversely proportional to B, the notion of the reduced bandwidth along the path can be captured by giving the path a weight that is equal to the sum of the packet transmission times on the interfering hops; in this case 2*T. We can generalize this intuition by assuming that that if two hops on a path are on the same channel then they always interfere with one another. This assumption is usually true for short paths, but the assumption is somewhat pessimistic for longer paths [15]. Consider an n-hop path. Assume that the system has a total of k channels. Define Xj as: Xj =
ETTi
1≤j≤k
(4)
Hop i is on channel j Thus, Xj is the sum of transmission times of hops on channel j. The total path throughput will be dominated by the bottleneck channel, which has the largest Xj . Thus, it is tempting to simply use the following definition for WCETT: WCETT = max Xj 1≤j≤k
(5)
It is easy to see that this metric will favor paths that are more channel-diverse. However, it is evident that the value of this metric will not always increase as more hops are added to the path, because additional hops using nonbottleneck channels do not affect the value of the metric. So this metric achieves our third design goal but not the second goal. We can combine the desirable properties of the two metrics described in Equations (3) and (5) by taking their weighted average:
3.2 Computing Path Metric
In keeping with the design goals, MR-LQSR assigns a weight to each link that is equal to the expected amount of time it would take to successfully transmit a packet of some fixed size S on that link. This time depends on the link bandwidth and loss rate. For now, let us assume that given a link i from node x to node y, we know how to calculate the expected transmission time (ETT) of the packet on this link. We denote this value by ET Ti . (We describe the calculation of ETT in the next subsection.) The next n question is how to combine the individual ETT link weights ETTi + β ∗ max Xj (6) WCETT = (1 − β) ∗ 1≤j≤k of hops along a path into a metric that reflects the overall i=1 “goodness” of the path. where β is a tunable parameter subject to 0 ≤ β ≤ 1. Our path metric is called Weighted Cumulative ETT (WCETT). There are a two possible ways to interpret the expression In keeping with our second design goal, we want WCETT to in Equation (6). First, we can view it as a tradeoff between increase in value as we add more links to an existing path. global good and selfishness. The first term is the sum of If we set WCETT to be the sum of the ETTs of all hops transmission times along all hops in the network. This reon the path, this property will be ensured. Furthermore, flects the total resource consumption along this path, where the total sum of ETTs has a physical meaning as well: it is the resource being consumed is the “air time.” The second an estimate of the end-to-end delay experienced by a packet term reflects the set of hops that will have the most impact traveling along that path. Thus, for a path consisting of n on the throughput of this path. The weighted average can hops, we may say: be viewed as an attempt to balance the two. Note that this average implicitly assumes that the network is not too heavn ily loaded. If every channel is being fully utilized, then simETTi (3) WCETT = ply minimizing overall resource consumption (setting β = 0) i=1 may be preferable. However, we also want WCETT to consider the impact of Second, we can view Equation (6) as a tradeoff between channel diversity. Simply adding up ETTs will not ensure throughput and delay. The first term can be considered as a
116
Channel 1
ETT = 10
ETT = 5
ETT = 12
S
1:
(for example, 1024 bytes) and B the bandwidth (raw data rate) of the link. Then:
Channel 2
D
ETT = ETX ∗ ETT = 10
ETT = 5
ETT = 12
ETT = 6
S
2:
S
4:
S
(7)
D
ETT = 9
3:
S B
ETT = 7
ETT = 11
Note that this definition of ETT does not incorporate backoff time spent waiting for the radio channel; it only reflects the time spent actually using the channel. In Appendix A, we consider an alternative definition that includes backoff time. To calculate ETT according to Equations (2) and (7), we need to know the forward and reverse loss rates (pf and pr ) and the bandwidth of each link. The values of pf and pr can be approximated by using the broadcast packet technique described by De Couto et al. [15]. In summary, each node periodically (once per second) sends out a broadcast probe packet. Broadcast packets are not retransmitted by the 802.11 MAC. Nodes track the number of probes received from each neighbor during a sliding time window (ten seconds) and include this information in their own probes. Nodes can calculate pr directly from the number of probes they receive from a neighbor in the time window, and they can use the information about themselves received in the last probe from a neighbor to calculate pf . The problem of determining the bandwidth of each link is more complex. One possibility is to fix the bandwidth of each 802.11 radio to a given value. For example, De Couto et al. [15] restricted the bandwidth of their 802.11b radios to 1Mbps. Another possibility is to allow the radios to automatically select the bandwidth for every packet. This feature is known as autorate, and most modern 802.11 radios support it. However, the 802.11 standard does not specify the algorithm for setting the rate. Several algorithms such as RBAR [22], and OAR [36] have been proposed. Since we do not know the autorate algorithm used by our 802.11 cards and the drivers do not supply bandwidth information, we can get an accurate idea of link bandwidth only by measuring it empirically. We measure the bandwidth using the technique of packet pairs [28]. Each node sends two back-to-back probe packets to each of its neighbors every minute. The first probe packet is small (137 bytes), while the second probe packet is large (1137 bytes). The neighbor measures the time difference between the receipt of the first and the second packet and communicates the value back to the sender. The sender takes the minimum of 10 consecutive samples and then estimates the bandwidth by dividing the size of the second probe packet by the minimum sample. Note that this estimate is not very accurate, since it ignores several factors that affect packet delivery time. However, the estimate is sufficiently accurate to distinguish between links of significantlydifferent bandwidths. We present measurement results and further discussion of the accuracy of these bandwidths in Section 6.1. There is an interesting interaction between autorate and the loss rate measurement. The 802.11 MAC sends broadcasts at the lowest data rate, whereas with autorate unicast packets may be sent at a higher data rate. Hence the measured loss rates may not reflect the actual loss probability for unicast traffic. However, in [17], we have shown that ETX in an autorate environment performs well despite this issue. One explanation is that the autorate algorithm in
ETT = 7
D
ETT = 2
ETT = 2
ETT = 2
ETT = 2
D
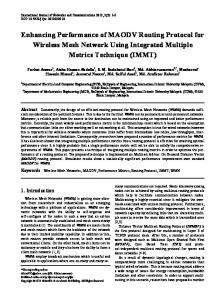
Path
Sum
Max
1 2 3 4
27 33 34 8
22 22 20 8
WCETT (β = 0.9) 22.5 23.1 21.4 8
WCETT (β = 0.1) 26.5 31.9 32.6 8
Figure 1: WCETT Examples. measure of the latency of this path. The second term, since it represents the impact of bottleneck hops, can be viewed as a measure of path throughput. The weighted average is an attempt to strike a balance between the two. The tradeoff is illustrated in the paths shown in Figure 1. Imagine a network in which each node has two radios. One of the radios on each node is tuned to channel 1, while the other is tuned to channel 2. We assume that the channels do not interfere with one another and have different ranges and bandwidths. We consider four possible paths between the source S and the destination D. The ETTs on the hops in these paths are shown in the figure. The WCETT values for β = 0.9 and β = 0.1 are also shown. Consider the first path. The bottleneck on this path are the hops on channel 1. Now consider the second path. This path is similar to the first path, except for an extra hop on channel 2. However, the hops on channel 1 are still the bottleneck. Nonetheless, this path is indeed worse than the first path, since it includes an extra hop. This is reflected in the WCETT calculations. However, the degree to which path 1 looks better than path 2 depends on the value of β. Indeed, if we assign β = 1, path 1 and 2 will have identical WCETT values. However, path 2 will never have a lower WCETT metric than path 1. Now consider paths 2 and 3. The bottleneck on both paths are the hops on channel 1. However, it is difficult to decide which path is better. This is reflected in the fact that for different values of β, either path can look better. Finally, consider path 4. Even though this path has no channel diversity, this path is clearly better than the first three paths. This is reflected correctly in the calculation of the WCETT metric. We further explore the tradeoffs offered by β in Section 6.4. Now, we discuss how to compute ETT for a given link.
3.3 Computing ETT We define the ETT of a link as a “bandwidth-adjusted ETX.” In other words, we start with the ETX (number of expected transmissions) and multiply by the link bandwidth to obtain the time spent in transmitting the packet. We can formalize this as follows. Let S denote the size of the packet
117
our cards only uses higher data rates if the loss rate is very small. When the loss rate is higher, the autorate algorithm drops back to the lowest data rate so the broadcast-probe technique works well. We have now fully described how to calculate the WCETT metric. Next, we discuss the properties of WCETT, and some of the assumptions we made during the derivation.
IPv4
IPv6
IPX
...
Mesh Connectivity Layer (with LQSR and WCETT) Ethernet
802.11
802.16
...
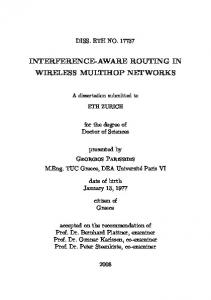
Figure 2: Our architecture multiplexes multiple physical links into a single virtual link.
3.4 Discussion In the derivation of ETT we did not explicitly consider the impact of contention due to traffic from nearby nodes. The contending traffic affects the link in two ways. First, it may increase the packet loss rate due to collisions, and second it reduces the available bandwidth. In our derivation, we assumed that packet loss rate is an independent parameter. This is in keeping with the models developed in [10, 8]. In reality, it might be dependent on the channel utilization. In our implementation, we continuously measure the channel loss rate and update the ETT value accordingly. Thus, we automatically account for any changes in the loss rate due to channel utilization. We also used the total link capacity instead of available bandwidth in our derivation of ETT. One possible way to incorporate the impact of contending traffic is to measure the available bandwidth [40] of the link instead of measuring the total capacity. However, current techniques to measure available bandwidth assume a point-to-point, FIFO queuing model for the link. This is clearly not the case for wireless links. In our future work, we plan to develop techniques to accurately measure the available bandwidth on wireless links, and use the estimate to update our routing metric. It should also be mentioned that as the metric starts to become more load dependent, one has to deal with the problem of preventing route oscillations. One may ask why ETT can not be measured more directly, instead of measuring loss-rate and bandwidth and then calculating ETT. Previous work [17] has shown that measuring round-trip latency does not work well because of self-interference. Furthermore, per-neighbor probing is O(n2 ) and hence should be avoided as much as possible. In contrast, broadcast probing is O(n). Our design uses morefrequent broadcast probes to measure loss-rate, and very infrequent unicast probes to measure the bandwidth to each neighbor. This allows us to estimate ETT without incurring too much overhead. Finally, our drivers do not expose the status of their transmit queue or notify when an 802.11 ACK is received, so we can not measure transmit latency in that fashion. We view WCETT as a compromise between local and global optimization. A local approach [2] can choose among multiple radios to optimize a transmission to a neighbor, but will have no visibility into the entire path taken by a flow and hence can not optimize for channel diversity. A global approach [25] can schedule all flows simultaneously to optimize performance, but this is clearly not practical. Our approach allows a sender to optimize the entire path taken by its flow. By definition, ETT will always assign a lower cost to a high-bandwidth link, compared to a low-bandwidth link, as long as the loss rates on the two links are equal. However, the low-bandwidth link may interfere only with other low-bandwidth links. This differential interference might make the low-bandwidth link more preferable than the high-
bandwidth link in some scenarios. We have not accounted for such differential interference in our link metric due to two reasons. First, in our testbed, the wireless NICs are allowed to choose transmission rates automatically. Hence, any link in our testbed usually interferes with links of several different bandwidths. Second, a lower-bandwidth link is likely to reduce the throughput of any flow that traverses that link. Thus, it seems appropriate to assign a lower weight to the higher-bandwidth link. In our future work, we plan to consider the impact of differential interference more carefully. We currently use Dijkstra’s algorithm to find paths that minimize the WCETT metric, but it does not do this correctly in all situations. For example, consider three nodes A, B, and C. Nodes A and B are connected by two links, on channels 1 and 2. The link on channel 1 has slightly smaller ETT than the link on channel 2. Nodes B and C are only connected via channel 1. Dijkstra’s algorithm on node A will first compute that channel 1 is the best route from A to B, and then incorrectly compute that the best route from A to C uses two hops on channel 1 instead of using channel 2 to get from A to B. We are currently implementing an algorithm to compute optimal WCETT routes, to understand how often this situation occurs in practice in our testbed.
4. IMPLEMENTATION We have implemented our MR-LQSR protocol (the LQSR routing protocol plus the WCETT metric) in an ad-hoc routing framework that we call the Mesh Connectivity Layer (MCL). Architecturally, MCL is a loadable Windows driver. It implements a virtual network adapter, so that to the rest of the system the ad-hoc network appears as an additional (virtual) network link. Under the covers, MCL routes packets using the LQSR protocol. We have implemented a variety of link-quality metrics for LQSR, including WCETT and ETX, and basic shortest-path routing. In this section, we briefly review our architecture and implementation to provide background for understanding the performance results. More architectural and implementation details are available in [16]. The MCL driver implements an interposition layer between layer 2 (the link layer) and layer 3 (the network layer). To higher-layer software, MCL appears to be just another ethernet link, albeit a virtual link. To lower-layer software, MCL appears to be just another protocol running over the physical link. See Figure 2 for a diagram. This design has several significant advantages. First, higher-layer software runs unmodified over the ad-hoc network. In our testbed, we run both IPv4 and IPv6 over the adhoc network. No modifications to either network stack were required. Network layer functionality, for example ARP, DHCP, and Neighbor Discovery, just works. Second, the ad-hoc routing runs over heterogeneous link layers. Our current implementation supports ethernet-like physical link
118
layers (eg 802.11 and 802.3) but the architecture accommodates link layers with arbitrary addressing and framing conventions. The virtual MCL network adapter can multiplex several physical network adapters, so the ad-hoc network can extend across heterogeneous physical links. Third, while we have currently implemented only the LQSR protocol in the MCL framework, the design, in principle, can support any ad-hoc routing protocol, such as DSR [26] or AODV [33]. Since the virtual MCL network adapter appears to higherlayer software as an ethernet link, the MCL adapter has its own 48-bit virtual ethernet address, distinct from the layer-2 addresses of the underlying physical adapters. This address is first assigned using a random number generator and then stored persistently in the Windows registry. The MCL network functions just like an ethernet, except that it has a smaller MTU. To allow room for the LQSR headers, it exposes a 1280-byte MTU instead of the normal 1500-byte ethernet MTU. The impact of the smaller MTU and other per-packet overheads incurred by MCL is discussed in detail in [17]. The MCL adapter routes packets using LQSR. The LQSR implementation in MCL is derived from DSR. It includes all the basic DSR functionality, including Route Discovery (Route Request and Route Reply messages) and Route Maintenance (Route Error messages). LQSR uses a link cache instead of a route cache, so fundamentally it is a linkstate routing protocol. The primary changes in LQSR versus DSR relate to its implementation at layer 2.5 instead of layer 3 and its support for link-quality metrics, including WCETT and ETX. LQSR uses the 48-bit virtual ethernet address of the MCL network adapter for routing. All LQSR headers, including Source Route, Route Request, Route Reply, and Route Error, use 48-bit virtual addresses instead of 32-bit IP addresses. Using the approach of [9], the 48-bit addresses are augmented with 8-bit interface indices to support multiple physical network interfaces per node. Each node locally assigns interface indices to its physical network adapters. Two nodes may be connected by multiple links, for example if the nodes have multiple radios. To uniquely specify a link, LQSR uses the source virtual address, the outgoing interface index, the incoming interface index, and the destination virtual address. We have modified DSR in several ways to support routing according to link-quality metrics. These include modifications to Route Discovery and Route Maintenance plus new mechanisms for Metric Maintenance. In brief, the DSR messages include a 32-bit link-quality metric value for each hop in Source Routes, Route Requests, Route Replies, etc. We do not include a longer description due to space limitations. Our design does not assume that the link-quality metric is symmetric. To implement WCETT, we had to convey a channel number as well as the loss-rate and bandwidth or the ETT of each link. We considered several different ways of implementing this, including encoding a channel number in the locally-assigned interface indices. Finally, we decided to use lower 8 bits of the metric value to encode an abstract channel number.
210
220
205
203
226
204
227
221 207
Approx. 61 m
5.
201
206
208
225 211
224
223
209
214
215 217
219
218
216
Approx. 32 m
Figure 3: Our testbed consists of 23 nodes placed in fixed locations inside an office building. testbed. Our testbed is located on one floor of a fairly typical office building, with the nodes placed in offices, conference rooms. and labs. Unlike wireless-friendly cubicle environments, our building has rooms with floor-to-ceiling walls and solid wood doors. The nodes are located in fixed locations and did not move during testing. The node density was deliberately kept high enough to enable a wide variety of multi-hop path choices. See Figure 3. The nodes are all Hewlett-Packard model d530 SFF PCs. Each of these machines has a 2.66GHz Intel Pentium 4 processor with 512MB of memory. They all run Microsoft Windows XP. The TCP stack included with XP supports the SACK option by default, and we left it enabled. All of our experiments were conducted over IPv4 using staticallyassigned addresses. Each node has two 802.11 radios, connected to the PC via Psism PCD-TP-202CS PCI-to-Cardbus adapter cards. The configuration of the PCI bus on these machines limits the separation distance between the radio antennas on the two cards to just under 3 cm. Each node has one Proxim ORiNOCO ComboCard Gold, and also either a NetGear WAG 511 or a NetGear WAB 501 card. These are multiband radios. Unfortunately, the Windows drivers do not allow two cards of the same model to co-exist in a machine. Except for configuring ad-hoc mode and fixing the frequency band and channel number, we used the default configuration for the radios. In particular, the cards all perform autorate selection and have RTS/CTS disabled. In
TESTBED
The experimental data reported in this paper are the results of measurements we have taken on a 23-node wireless
119
our future work, we plan to explore the impact of enabling RTS/CTS. There are no other 802.11a or 802.11g users in our building, although there are some 802.11b access points. We have verified that the 802.11b access points had no significant impact on our results.
Measured Bandwidth (Mbps)
802.11a
5.1 Band and Channel Assignment One of the assumptions we made in designing our routing metric is that the channels used by the multiple radios are non-interfering. We performed a series of tests to verify that this was indeed the case for the bands and channels we use in our testbed environment. These tests were performed using three dual-radio nodes from our testbed, namely 201, 204, and 205. See Figure 3. Nodes 201 and 204 were always the senders, and 205 was always the receiver. Our methodology was to first measure the TCP throughput between each of the senders and the receiver alone, and then simultaneously with both senders operating. If the transfers are truly non-interfering, we would expect the throughputs to be essentially the same whether run independently or simultaneously. Using NetGear cards on 802.11a channel 36 between 201 and 205, we measured an average throughput of 15351Kbps. Likewise, using Proxim cards on 802.11a channel 64 between 204 and 205, we saw 13483Kbps. When run simultaneously, however, these throughputs dropped to 4155Kbps and 9143Kbps, respectively. This is a reduction in throughput of 73% between 201 and 205 and 32% between 204 and 205. This difference is greater than we might ascribe to additional load on the receiver from sinking two streams simultaneously. Indeed, our subsequent tests using 802.11g with 802.11a bear this out. In that case, we measured an average throughput of 15329Kbps between 201 and 205 (using NetGear cards on 802.11a channel 36) and 9743Kbps between 204 and 205 (using Proxim cards on 802.11g channel 10) when run independently. Simultaneously, the respective results were 14898Kbps and 9685Kbps. The reduction in throughput for this situation is only 3% between 201 and 205 and 1% between 204 and 205. We have also verified that two 802.11g radios or two 802.11b radios in our testbed interfere, regardless of channel. Our suspicion is that the physical proximity of the two antennas on each node is contributing to this interference problem. For this reason, we elected not to use two channels in the same band when running experiments to evaluate our metric. Instead, we set our NetGear cards to use 802.11a and our Proxim cards to use 802.11g.
6.
60 54 48 42 36 30 24 18 12 6 0
802.11g 60 54 48 42 36 30 24 18 12 6 0
0 6 12 18 24 30 36 42 48 54 60 Channel Bandwidth (Mbps)
0 6 12 18 24 30 36 42 48 54 60 Channel Bandwidth (Mbps)
Figure 4: Accuracy of packet-pair estimations.
multaneous TCP transfers. We conclude with a discussion of the results and some of the limitations of our testbed.
6.1 Accuracy of Bandwidth Estimation We conducted the following experiment to measure the accuracy of the packet-pair technique. Two of our testbed nodes were placed near one another in the same room. We estimated the bandwidth of the wireless link between them using packet-pair probes. The time between successive pairs was 2 seconds, and each bandwidth estimate was obtained by taking the minimum of 50 such pairs. We set the channel bandwidth on the radios to each of the possible transmission speeds in turn. We took 5 successive estimates for each setting. The results of this experiment for NetGear cards on 802.11a and for Proxim cards on 802.11g is shown in Figure 4. Each point represents the average of these 5 estimates, and the error bar shows the maximum and the minimum estimates. The two plots show that the packet-pair estimate is accurate for low channel data rates, while at high data rates it underestimates the channel bandwidth. This could be due to the fact that the fixed overheads involved in a packet transmission (such as the time required to send the 802.11 ACK) become more important at higher data rates. Our technique does not account for these overheads. Despite these inaccuracies, note that in both the plots, we are able to unambiguously distinguish between various channel bandwidths, except for the highest 11g data rates. Thus, the overall conclusion from this experiment is that the packet-pair technique produces sufficiently accurate estimates of channel bandwidth.
6.2 Baseline Scenario—Single Radio Before we discuss the performance of our metric with multiple radios, it is essential to establish a baseline with only one radio per node. In this experiment, we activated only the NetGear card on each node. The Proxim cards on all the nodes were disabled. The NetGear cards all operated in 802.11a mode on channel 36 with autorate. Our testbed has 23 nodes, so there are 23 ∗ 22 = 506 sender-receiver pairs. Following the methodology of [15], we selected 100 of these pairs at random. We carried out a 2minute TCP transfer between each selected pair of nodes. Each TCP transfer sent as much data as it could. On the best one-hop path in our testbed a 2-minute connection will transfer over 200MB of data. We had previously determined empirically that TCP connections of 1-minute duration were of sufficient length to overcome startup effects and give re-
RESULTS
In this section, we describe the results of our experiments. First, we present measurements that show that the packetpair technique works well for estimating the bandwidth of wireless links. Then, we present experiments that study the performance of the WCETT metric in various conditions. We begin by comparing the performance of WCETT to ETX as well as basic shortest-path routing using only one radio per node. These results provide a baseline. Next, we activate the second radio on each node and compare the performance of WCETT, ETX and shortest-path routing. Then, we explore the performance of WCETT for different values of β. Finally, we consider the impact of multiple si-
120
3500
Throughput (Kbps)
times leads it to select longer paths than ETX; however, these longer paths result in better throughput.
Single Radio
3000
Two Radios 2500
6.3 Two Radios
2000 1500 1000 500 0 WCETT
ETX
Shortest Path
Figure 5: Comparison of median TCP throughput with one and two radios. WCETT outperforms other metrics.
producible results [17]. Only one TCP transfer was active at any time. There was a one-minute idle period between successive transfers so the total time required for the experiment was 5 hours. We carried out this experiment for both WCETT and ETX, as well as basic shortest-path routing. Since WCETT takes both bandwidth and packet loss into account, we would expect it to provide better performance than ETX and shortestpath. However, since each node has only one radio, the scope for improvement is limited. The summary results shown in Figure 5 confirm that this is indeed the case. The median throughput of the 100 transfers using WCETT was 1601Kbps, which is 16% better than the median throughput using ETX, and 38.6% better than the median throughput achieved with shortest-path routing. We also kept track of the path taken by each TCP connection. If a connection took multiple paths during its lifetime, we compute the average path length by weighting the length of each path by the number of packets that were transferred on each path. The median path length of the 100 transfers using both WCETT and ETX was 3 hops. The median path length for shortest-path routing was 2 hops; as one would expect, shorter than either WCETT or ETX. Let us now compare the performance of WCETT and ETX in more detail. As we noted earlier, WCETT provides 16% improvement in median throughput over ETX. The improvement in throughput is more significant for connections that take longer paths. Of the 100 connections, the path length of 27 connections was longer than 4 hops using ETX. The median throughput of these connections was 686Kbps using ETX. Using WCETT, the median throughput of these connections was 1067Kbps, which represents an improvement of 55%. We also noted earlier that median path length using WCETT and ETX is the same. Even though the median path length is the same, there are 53 connections for which WCETT used a longer path than ETX. It is interesting to note that the median throughput of these 53 connections is 1327Kbps using WCETT, while it is 1109Kbps using ETX. The 20% improvement is interesting, since the throughput of multihop wireless connections drops with increasing path length. The main conclusion from this experiment is that WCETT works well in single-radio environments, and its performance is comparable to and even a little better than that of ETX. The increase in performance is a result of the fact that WCETT takes link bandwidth into account. This some-
121
In the previous section, we established our baseline result with a single 802.11a radio. We now turn to the two-radio case. As we have discussed earlier, we did not carry out these experiments with two 802.11a radios because of interference. Instead, we used one 802.11a radio and one 802.11g radio per node. The NetGear card in each node operated in 802.11a mode, on channel 36. The Proxim card on each node operated in 802.11g mode, on channel 10. Both cards used autorate. Although 802.11g ostensibly has the same 54Mbps maximum data rate as 802.11a, we have found that in general 802.11g links give lower throughput than the corresponding 802.11a links. For example, one of the best 802.11a links in our testbed is from node 201 to 205. On this one-hop path, a 2-minute TCP transfer achieves approximately 14Mbps throughput. This also happens to be one of our best 802.11g links. However, the throughput of a 2-minute transfer using 802.11g is approximately 10Mbps. Our packet-pair measurements also show that between the same pair of nodes, the 802.11g link usually tends to have lower bandwidth. We carried out the same set of 100 TCP transfers as we did for our baseline case, both for ETX and WCETT, as well as using basic shortest-path routing. For WCETT, the value β was set to 0.5. (In the previous section the value of β did not matter, since each node had only one radio.) In this setting, we would expect WCETT to significantly outperform ETX, since ETX does not account for either bandwidth or channel diversity. We would also expect both metrics to outperform shortest-path routing. The results in Figure 5 show that this is indeed the case. The median throughput using WCETT is 89% higher than ETX and 254% higher than shortest-path routing. Furthermore, when we compare the performance of each metric to its performance in the baseline single-radio scenario we see that the WCETT metric takes much better advantage of the additional capacity provided by the second radio. The median throughput using WCETT metric is 86% higher when two radios are used. The ETX metric, however, does not do so well. The median throughput using ETX with two radios is only 9% higher than the baseline. Shortest-path routing performs even worse—the median throughput with two radios is lower than the median throughput with one radio. The poor performance of the shortest-path algorithm is not surprising, since the metric simply selects the shortest available path. We have already mentioned that the 802.11g links in our network tend to have lower bandwidth than the 802.11a links. Shortest-path routing uses these links without regard to their lower bandwidth, resulting in low throughput. In light of this poor performance, we will not consider shortest-path routing further in this paper. The poor performance of ETX is not surprising either, since the metric only considers link loss rate when selecting a path. It does not take link bandwidth into account, nor does it attempt to select paths that are channel-diverse. This is reflected in the fact that the median path length using ETX in the two-radio scenario is slightly lower than the median path length in the single-radio scenario. This is due to the fact that the 802.11g cards tend to have slightly longer range
ETX (Two radios) 16000
14000
14000 Throughput (Kbps)
Throughput (Kbps)
ETX (Single Radio) 16000
12000 10000 8000 6000 4000 2000
12000 10000 8000 6000 4000 2000
0
0 0
1
2
3 4 5 6 Path Length (Hops)
7
8
0
1
2
7
8
7
8
WCETT (Two radios)
16000
16000
14000
14000 Throughput (Kbps)
Throughput (Kbps)
WCETT (Single Radio)
3 4 5 6 Path Length (Hops)
12000 10000 8000 6000 4000 2000
12000 10000 8000 6000 4000 2000
0
0 0
1
2
3 4 5 6 Path Length (Hops)
7
8
0
in our testbed. ETX routes packets over these longer but lower bandwidth links. WCETT, on the other hand, uses the 802.11g links only when their use is beneficial. This is reflected in the median path lengths using these two metrics. Recall that the median path length was 3 hops for both the metrics in the baseline case. With two radios, the median path length for ETX drops to 2.4, while for WCETT it remains at 3. The ability of WCETT to select good paths is illustrated in Figures 6 and 7. The figures show the relationship between path length and throughput for ETX and WCETT. The first figure shows the baseline single-radio case, while the second figure is for the two-radio case. We can easily see that ETX uses the second radio in a sub-optimal manner. For example, consider the one-hop paths in all four plots. With only one radio, the results for these paths using ETX and WCETT is roughly equivalent. However, with two radios, ETX sometimes selects a low bandwidth 802.11g link to achieve a one-hop path. In fact, out of 22 single-hop paths, 10 use the 802.11g link. WCETT, on the other hand, uses an 802.11g link for only one of its 16 single-hop paths. Along with bandwidth, the WCETT metric also considers channel diversity. To measure this, we define a Channel Diversity Index (CDI) for a given path. Consider a path of length N hops. Let the number of hops taken on 802.11a be Na , and the number of hops taken on 802.11g be Ng . The CDI of the path is then defined as: CDI =
2
3 4 5 6 Path Length (Hops)
Figure 7: Relationship between path length and throughput of individual connections with two radios. Percentage Improvement in Median Throughput
Figure 6: Relationship between path length and throughput of individual connections in the baseline one radio scenario.
1
140 120 100 80 60 40 20 0 1
2
3
4
>=5
Path Length (with 2 radios)
Figure 8: Improvement in median throughput over single-radio case for various path lengths using WCETT. The improvement is lower for connections on longer paths. Thus, the maximum value of CDI for a path is 0.5. Note that odd-hop paths are handled correctly. If, on a 3-hop path, one hop is taken on 802.11a, and the remaining two hops are taken on 802.11g, then the value of CDI is 0.5, instead of 0.33, since on a 3-hop path, this is the most channel-diverse assignment possible. Note also that CDI of a one-hop path is always zero. The median CDI using WCETT is 0.47 for multi-hop paths. This indicates that WCETT achieves good channel diversity on multi-hop paths. On the other hand, the median CDI of all multi-hop paths using ETX is 0.34. This lower CDI and the smaller median path length are both due to the fact that ETX prefers the slower, but somewhat longer, 802.11g links for its paths. Let us now consider the performance of WCETT in more detail. One question to ask is whether the use of two radios provides performance improvement on connections of all path lengths, and if so, does the gain vary depending on
min(Na , Ng ) 2 ∗ �N/2�
For example, if a four-hop path takes two hops on 802.11a and two hops on 802.11g, we say that the CDI is 0.5. If, on the other hand, the path consists of 3 hops on 802.11g and only one hop on 802.11a (or vice-versa), the CDI is 0.25.
122
0.5
Throughput (Kbps) Path Length (Hops) CDI
Median CDI
0.4
0.3
β=0 2726 3.1 0.23
β = 0.1 2939 3.9 0.25
β = 0.5 2989 3.0 0.47
β = 0.9 2897 4.0 0.47
Table 1: Median throughput, path length and CDI of 100 transfers for four values of β.
0.2
0.1
0
8000
1
2
3
4
>=5 Median Throughput (Hops)
Path Length
Figure 9: Channel Diversity Index for various path lengths using WCETT. path length. In Figure 8 we group connections by their path length, and plot the improvement in their median throughput, when compared to their throughput in the single-radio baseline case. First note that WCETT provides no improvement for single-hop connections. This is because WCETT does not stripe packets over multiple links between neighboring nodes. We will discuss this issue further in Section 7. For multihop connections, we see that the performance improvement drops with increase in path length. This might come as a surprise, since the benefits of channel diversity should be more evident on longer paths. To investigate this question, we plot the median CDI for various path lengths in Figure 9. While the figure shows that there is a slight drop in the median channel diversity of longer paths, the paths are still significantly channel-diverse. The problem, however, is that on long, multi-hop wireless paths, TCP performs poorly due to a host of reasons. These include increases in round trip time, higher probability of packet loss due to channel errors, and contention between hops that are on the same channel [19, 7, 45]. Channel diversity, and indeed, use of multiple radios, only helps to reduce the impact of contention between hops on the same channel. Thus, multiple radios provide less improvement in performance on longer paths than they do on shorter paths. Hence WCETT provides more significant improvement in performance for shorter paths. Still, we note that the even on paths of length five hops or longer, WCETT with two radios provides over 35% improvement in median throughput. We draw two main conclusions from these experiments. First, that WCETT provides significant throughput gains with two radios over the baseline single-radio case. Previously proposed metrics such as ETX and shortest-path routing can not take full advantage of the second radio. Second, the benefit provided by WCETT is higher for shorter paths, but even on paths that are 5 hops or longer, WCETT provides over 35% gain in performance. Note that in this section, we had set the value of β to 0.5 while evaluating the performance of WCETT. Recall from Section 3, that β is the weight given to the channel-diversity component of WCETT. In the next section, we will explore the impact of different values of β on the performance of WCETT. This will give us more insight into the impact of channel diversity on performance.
7000
β=0
6000
β=0.1 β=0.5
5000
β=0.9
4000 3000 2000 1000 0 2
3
4
5
>= 6
Path Length (Hops)
Figure 10: Comparison of median throughputs of connections grouped by path lengths using various values of β. channel. As we have explained previously, it is the second factor that forces ETT to select channel-diverse paths. The weight given to the second factor is denoted by β, while the weight given to the first factor is 1 − β. The results in the previous section were obtained with β = 0.5. This means that we gave equal weight to channel diversity and the total sum of ETT along a path. To measure the impact of channel diversity on performance of WCETT, we repeated the experiment carried out in the previous section with β = 0, 0.1, and 0.9. When we set β = 0, WCETT selects links based solely upon their loss rate and bandwidth, without regard to channel diversity. Note that setting the value of β to 1 makes little sense, since then the value of the path metric is no longer guaranteed to increase with increasing path length. The summary results for β = 0, 0.1, 0.5, and 0.9 are reported in Table 1. Note that the results for β = 0.5 repeat the results from the previous section. The impact of different values of β can be immediately seen in the median CDI. The median CDI is 0.23 when β = 0, and is equal to 0.47 when β = 0.5 or 0.9. Thus, the metric selects paths with less channel-diversity when β is low. When we look at throughput, the impact of β is a little less obvious. The median throughput with β = 0 is lower by by 8.8% compared to its value with β = 0.5. The difference is even less for β = 0.9. Thus, at first glance, it would appear that β does not have significant impact on throughput. To investigate this further, we group the connections by their path lengths, and look at the median throughput of each group using various values of β. This data is presented in Figure 10. Note that we only consider multi-hop connections, since channel diversity of a single-hop connection is always zero. The data clearly shows that once we start looking at throughputs of connections of a specific path length, the value of β does make a difference. For a given path length, the throughput with β = 0 is the lowest. Consider, for example, the connections with path length of two hops. We have already mentioned that the 802.11g hops in our network generally have lower throughputs than corresponding
6.4 The Impact of β Recall that the WCETT metric is a weighted average of two quantities: first, the sum of ETTs of all hops along a path, and second, the sum of ETTs on the bottleneck
123
β=0
0.5
β=1
β=0.5
3500
β=0.9
3000 2500 MMT (Kbps)
Diversity Index
0.4
0.3
0.2
2000 1500 1000 500
0.1
0 WCETT (β=0)
0 2
3
4
5
>=6
WCETT (β=0.1)
WCETT (β=0.5)
WCETT (β=0.9)
ETX
Path Length (Hops)
Figure 12: Multiplied Median Throughput for 100 transfers for WCETT (four values of β) and ETX. Two transfers are active simultaneously.
Figure 11: Comparison of median diversity index of connections grouped by path lengths using various values of β. 802.11a hops. Thus, when β = 0, a connection will select an 802.11g hop if it looks better than the corresponding 802.11a hop. If the two hops are equivalent, then the decision is made randomly. This lack of channel diversity can be observed in Figure 11. The median CDI for β = 0 for two hops is less than 0.3, while for β = 0.5, 0.1, 0.9, the median CDI is 0.5. Thus, for β = 0, the two hops are much more likely to be the same channel, usually 802.11a. This results in lower median throughput for two hop connections under β = 0. In Figure 11, we also see that the CDI values for β = 0.1 and 0.5, are between the values for β = 0 and β = 0.9. This is exactly what one would expect. In addition, the CDI for β = 0.1 is always equal to or lower than the CDI for β = 0.5. This is also reflected in Figure 10, where, for most part, the throughput under β = 0.9 is higher than the other three β values, and throughputs under β = 0.1 and β = 0.5 are comparable. We also see that for longer paths channel diversity has less impact, as other factors that limit TCP throughput start becoming more dominant. The results suggest that on paths of lengths four or more, channel diversity does not provide significant benefit. Note however, that we have done this experiment with only two non-interfering radios. With more radios, we would expect improved throughput on longer paths. The overall conclusion from these experiments is that to select high-throughput paths in a multi-radio network, it is important to consider channel diversity in addition to the loss rate and bandwidth of individual links. The advantages of channel diversity are more apparent on shorter paths, since on longer paths factors such as increased RTT tend to limit performance. Recall that β can also be seen as offering a tradeoff between maximizing the throughput of a single flow and the consuming fewer global resources. We will explore this tradeoff a bit more in the next section.
the experiment was repeated four times with β = 0, 0.1, 0.5, and 0.9. In each experiment, we measured the median throughput of the 100 transfers. We multiplied this throughput by 2, since two transfers were active simultaneously. We call this quantity the Multiplied Median Throughput (MMT). The MMT values are shown in Figure 12. Several things can be noted from this graph. First, note that WCETT performs better than ETX for all values of β in this scenario. Second, compare the ETX and WCETT (β = 0.5) bars with the corresponding bars from Figure 5. We see that the MMT values are roughly equal to the median throughputs of single connections. In other words, two simultaneous connections get roughly the same total throughput as a single connection running by itself. This implies that the two connections almost always interfere with one another, and the possibility of finding two non-interfering paths in our testbed is limited. This limitation is due to the small size of our testbed. Third, note that the performance of WCETT is dependent on the value of β. The MMT is highest for β = 0.1 and lowest for β = 0.9. This might tempt one to conclude that as soon as more than one flow is active in the network, giving too high a weight to channel diversity can be detrimental and it might be simpler to just ignore it. However, this conclusion is not quite warranted. As we discussed earlier, due to the small size of our testbed, the scope for finding noninterfering paths is small. In other words, two simultaneous, bulk-transfer TCP connections constitute a fairly high load for our network. In addition, note that the throughput for β = 0 is lower than the throughput for β = 0.1. Thus, the right conclusion to draw from this experiment is that at high load levels, the total network throughput is maximized by using lower values of β. We hope to expand our testbed in the future and conduct more experiments to evaluate the impact of β on multiple simultaneous transfers. One possible avenue of future work is to dynamically select β based on current network load.
6.5 Two Simultaneous Connections In all the previous experiments, only a single TCP connection was active at any one time. In this section, we consider two simultaneous TCP transfers. We carried out 2-minute TCP transfers between the same 100 pairs of nodes, but we ensured that two TCP connections were active at the same time by starting a transfer every minute. The experiment was repeated using both the ETX and the WCETT metrics. For the WCETT metric,
6.6 Discussion Our experiments show that a new routing protocol is indeed necessary for achieving good performance in a heterogenous, multi-radio environment. We show that MRLQSR with WCETT fills this need, and takes full advantage of the additional capacity offered by the second radio. Our current definition of ETT assumes that the wireless
124
network uses the 802.11 MAC. Our loss estimation technique is also based on the assumption that the underlying wireless layer does not retransmit broadcast packets. However, we believe the definitions of ETT and WCETT could be extended to other wireless technologies. Our experiments were limited due to certain hardware problems. We found that our cards interfere with one another even when they were set on channels at the extreme ends of the 802.11a spectrum. Similarly, we found that they interfered in the 802.11b/g spectrum. Thus, our best alternative was to operate one of them in 802.11a mode and another in 802.11g mode. This also meant that we could not do experiments with more than two radios per node. We have experimented with 802.11b cards. The data rates offered by these cards are significantly lower than 802.11a links. We verified that WCETT performs well in this setting. We have not presented the results due to lack of space. We plan to investigate other hardware options to see if we can get two or more 802.11a or 802.11g cards to work in the same node without interfering with one another. Our current testbed is also very small—we found that most of our 802.11g links interfere with one another. This limits the scope for finding alternate paths in the network when multiple flows are active. We would like to expand our testbed and explore the performance of WCETT with multiple flows in more detail. We have not considered the impact of mobility. In a previous paper [17], we showed that in an environment with mobile nodes, the shortest-path metric performs better than ETX. We plan to investigate the impact of mobility on WCETT as part of our future work.
7.
layer [1, 2]. Each approach has its advantages and disadvantages. Striping at the application layer yields poor aggregate bandwidth, sometimes even lower than that of the slowest connection, because a slow connection can stall faster ones [23]. Striping at the link layer (also referred to as inverse queueing) yields poor performance because the proposed mechanisms are highly sensitive to lossy links and to fluctuations in transmission data rates [38], phenomena that are common in wireless networks. These problems can only get worse in the presence of multiple, heterogeneous radios with varying propagation characteristics. In any case the striping protocols still require that we solve the problem of routing over heterogeneous links. Many of the proposed protocols assume that the wireless route is only one hop [38], while others [2] assume that shortest-path routing is being used. We have shown that shortest-path routing is suboptimal if the links between nodes differ in range and bandwidth. One may wish to combine our proposed routing protocol with these striping solutions. Yet another way to improve performance of multi-hop wireless networks is to use directional antennas [14]. The use of multiple radios is complementary to the use of directional antennas, and we believe that our protocol can be modified for directionality. Specifically, we would have to revisit the assumption that all same-channel links along a path interfere with one another. Another way to improve the capacity of a wireless network is to take advantage of the full spectrum by using rapid channel switching. This approach has been explored by several researchers [32, 42]. However, channel switching can be quite slow with existing 802.11 hardware [11]. With the availability of better hardware, many of the proposed approaches based on rapid channel switching will become feasible. Our approach, however, works with currently available hardware. We also note that even with the ability to switch channels rapidly, a single radio can not transmit and receive simultaneously. Thus, the use of multiple radios can provide a performance improvement even in this case. There is some prior research on using multiple radios. The UCAN project [30] focused on using 802.11 radios to improve the performance of a 3G network. Our research emphasizes using multiple radios to improve the performance of an ad-hoc network. The BARWAN project [39] enabled seamless handoffs between heterogeneous networks for a mobile user. In contrast, LQSR seamlessly integrates heterogeneous link technologies into a single network without handoffs. The DSR protocol supports multiple radios [9] but it uses shortest-path routing. The MUP protocol [2] improves performance using multiple radios, but it assumes shortestpath routing and homogeneous radios. The problem of devising a link-quality metric for ad-hoc networking with 802.11 in neighborhood and office environments has been studied by many researchers. These prior schemes have all focused on systems with one radio. We believe that our approach generalizes to any suitable metric for measuring link quality. Awerbuch et al. [4] study the impact of automatic rate selection on the performance of ad-hoc networks. They propose a routing algorithm that selects a path with minimum transmission time. However, their metric does not take packet loss into account. Woo et al. [43] examine the interaction of link quality and ad-hoc routing for sensor networks. Their work assumes passive observation of packet reception probability instead of active prob-
RELATED WORK
Several researchers have studied the problem of capacity reduction in multi-hop wireless networks [21, 25] from a theoretical perspective. In [29, 21], the authors show that observed capacity is far below the theoretical optimum, using evidence from deployed multi-hop 802.11 wireless meshes. They observe that throughput degrades quickly as the number of hops increases. One reason is that the 802.11 MAC is inherently unfair and it can stall the flow of packets over multiple hops. Another reason is that these networks use only a small portion of the spectrum and a single radio for transmitting and receiving packets. One way to improve the capacity of wireless meshes is to use a better MAC. Several proposals have been made in this regard [32, 41, 42]. The objective of these proposals is similar to ours, i.e., to exploit multiple non-interfering frequency channels. However, their approach is significantly different in that these proposals require changes to the MAC and/or new hardware. In contrast, we do not require any changes to the 802.11 MAC. Thus, as we have demonstrated, our protocol can be deployed using off-the-shelf hardware. In any case, even with improved MACs, one may wish to use multiple radios per node to ensure robustness. For example, the propagation and fading characteristics of the 5Ghz band are significantly different than those of the 2.4GHz band. Our protocol can be extended to work with these new MACs in such situations. An alternative way to improve capacity is to stripe the traffic over multiple network interfaces. There have been several proposals in this regard: striping at the application layer [3], at the transport layer [23], and at the link
125
[2] A. Adya, P. Bahl, J. Padhye, A. Wolman, and L. Zhou. A multi-radio unification protocol for IEEE 802.11 wireless networks. In BroadNets. [3] M. Allman, H. Kruse, and S. Ostermann. An application-level solution to TCP’s satellite inefficiencies. In WOSBIS, 1996. [4] B. Awerbuch, D. Holmer, and H. Rubens. High throughput route selection in mult-rate ad hoc wireless networks. Technical report, Johns Hopkins University, 2003. [5] P. Bahl, A. Adya, J. Padhye, and A. Wolman. Reconsidering Wireless Systems with Multiple Radios. ACM CCR, Jul 2004. [6] Bay area wireless users group. http://www.bawug.org/. [7] S. Bhandarkar, N. Sadry, A. L. N. Reddy, and N. Vaidya. TCP-DCR: A novel protocol for tolerating wireless channel errors. IEEE Trans on Mobile Comp, Feb 2004. [8] G. Bianchi. Performance analysis of the IEEE 802.11 distributed coordinated function. IEEE JSAC, 18(3):535–547, March 2000. [9] J. Broch, D. A. Maltz, and D. B. Johnson. Supporting hierarchy and heterogeneous interfaces in multi-hop wireless ad hoc networks. In Workshop on Mobile Computing at I-SPAN, 1999. [10] F. Cali, M. Conti, and E. Gregori. IEEE 802.11 wireless LAN capacity analysis and protocol enhancement. In INFOCOM, 1998. [11] R. Chandra, V. Bahl, and P. Bahl. MultiNet: Connecting to multiple IEEE 802.11 networks using a single wireless card. In INFOCOM, 2004. [12] C. Y. Chang, P. C. Huang, C. T. Chang, and Y.-S. Chen. Dynamic channel assignment and reassignment for exploiting channel reuse opportunities in ad hoc wireless networks. IEICE Trans on Comm, Apr 2003. [13] K.-W. Chin, J. Judge, A. Williams, and R. Kermode. Implementation experience with MANET routing protocols. ACM CCR, Nov 2002. [14] R. R. Choudhury and N. Vaidya. Impact of directional antennas on ad hoc routing. In PWC, 2003. [15] D. De Couto, D. Aguayo, J. Bicket, and R. Morris. High-throughput path metric for multi-hop wireless routing. In MOBICOM, 2003. [16] R. Draves, J. Padhye, and B. Zill. The architecture of the Link Quality Source Routing Protocol. Technical Report MSR-TR-2004-57, Microsoft Research, 2004. [17] R. P. Draves, J. Padhye, and B. D. Zill. Comparison of routing metrics for static multi-hop wireless networks. In SIGCOMM, 2004. [18] R. Dube, C. Rais, K.-E. Wang, and S. Tripathi. Signal stability based adaptive routing (SSA) for ad-hoc mobile networks. IEEE Personal Comm, Feb 1997. [19] Z. Fu, P. Zerfos, H. Luo, S. Lu, L. Zhang, and M. Gerla. The Impact of Multihop Wireless Channel on TCP Throughput and Loss. In INFOCOM, 2003. [20] T. Goff, N. Abu-Aahazaleh, D. Phatak, and R. Kahvecioglu. Preemptive routing in ad hoc networks. In MOBICOM, 2001. [21] P. Gupta and P. R. Kumar. The capacity of wireless networks. IEEE Trans on Info Theory, Mar 2000.
ing. They conclude that ETX-based routing is more robust than shortest-path protocols. Signal strength, or signal-tonoise ratio (SNR), has been used as a link quality metric in several routing schemes for mobile ad-hoc networks. In [24] the authors use an SNR threshold value to filter links discovered by DSR Route Discovery. Similar ideas have also been explored in [18, 20]. All these protocols have been studied in single-radio environment. We plan to study the SNR metric in our testbed as part of our future work. Our current hardware and software setup does not provide adequate support to study this metric. Because LQSR uses source routes, the selection of a highperformance route can be performed at the sender. However, the basic approach of using link quality and taking interference into account is compatible with other link-state routing protocols. In a non-source-routed link-state protocol, each node could independently calculate high-performance routes and select the next hop based on the packet’s source and destination. It would be more difficult to modify distancevector protocols like AODV to use WCETT.
8.
CONCLUSION
We have shown that when nodes are equipped with multiple heterogenous radios, it is important to select channeldiverse paths in addition to accounting for the loss rate and bandwidth of individual links. We have implemented a routing protocol MR-LQSR (Multi-Radio Link-Quality Source Routing) with a new metric WCETT (Weighted Cumulative Expected Transmission Time) to accomplish this task, and compared its performance to other routing metrics in a multi-radio testbed. Our results show that WCETT outperforms previously-proposed metrics. WCETT allows us to trade off channel diversity and path length, by changing the value of the control parameter β. We experimented with different values of this control parameter, and showed that on shorter paths, taking channel diversity into account brings significant benefits. We also showed that on longer paths, as well as in heavily-loaded networks, the benefits obtained by selecting channel-diverse paths are limited. In the future, we plan to expand our testbed by adding more nodes. This will allow us to better explore the performance of WCETT for multiple simultaneous transfers. We also plan to investigate whether with different hardware, we can effectively use two 802.11a or two 802.11g radios simultaneously. Finally, we hope to investigate the performance of WCETT in mobile scenarios.
Acknowledgments Yih-Chun Hu helped to implement the initial version of the MCL framework as part of his internship project. Victor Bahl suggested to us the idea of using multiple radios to improve capacity, and provided helpful feedback throughout the project. Atul Adya and Alec Wolman took time to give detailed comments and suggestions on early drafts of this paper. The comments from Elizabeth Belding-Royer and the anonymous MobiCom 2004 reviewers were very useful in the preparation of the final draft of this paper.
9.
REFERENCES
[1] H. Adiseshu, G. Parulkar, and G. Varghese. A reliable and scalable striping protocol. In SIGCOMM, 1996.
126
protocol work well in multihop wireless ad hoc networks. IEEE Comm, Jun 2001.
[22] G. Holland, N. Vaidya, and P. Bahl. A rate-adaptive MAC protocol for multi-hop wireless networks. Mobile Computing and Networking, 2001. [23] H.-Y. Hsieh and R. Sivakumar. A transport layer approach for achieving aggregate bandwidths on multi-homed mobile hosts. In MOBICOM, 2002. [24] Y.-C. Hu and D. B. Johnson. Design and demonstration of live audio and video over multi-hop wireless networks. In MILCOM, 2002. [25] K. Jain, J. Padhye, V. Padmanabhan, and L. Qiu. The impact of interference on multi-hop wireless network performance. In MOBICOM, 2003. [26] D. B. Johnson and D. A. Maltz. Dynamic source routing in ad-hoc wireless networks. In Mobile Computing. Kluwer Academic Publishers, 1996. [27] R. Karrer, A. Sabharwal, and E. Knightly. Enabling Large-scale Wireless Broadband: The Case for TAPs. In HotNets, 2003. [28] S. Keshav. A Control-theoretic approach to flow control. In SIGCOMM, 1991. [29] J. Li, C. Blake, D. S. J. De Couto, H. I. Lee, and R. Morris. Capacity of ad hoc wireless networks. In MOBICOM, 2001. [30] H. Luo, R. Ramjee, P. Sinha, L. Li, and S. Lu. UCAN: A unified cellular and ad hoc network architecture. In MOBICOM, 2003. [31] Mesh Networks Inc. Mesh networks technology overview. http://www.meshnetworks.com. [32] A. Nasipuri and S. R. Das. A multichannel CSMA MAC protocol for mobile multihop networks. In WCNC, 1999. [33] C. E. Perkins and E. M. Royer. Ad-hoc on-demand distance vector routing. In WMCSA, Feb 1999. [34] Radiant Networks. http://www.radiantnetworks.com/. [35] MIT roofnet. http://www.pdos.lcs.mit.edu/roofnet/. [36] B. Sagdehi, V. Kanodia, A. Sabharwal, and E. Knightly. Opportunistic media access for multirate ad hoc networks. In MOBICOM, 2002. [37] Seattle wireless. http://www.seattlewireless.net/. [38] A. Snoeren. Adaptive inverse multiplexing for wide-area wireless networks. In GLOBECOM, 1999. [39] M. Stemm and R. H. Katz. Vertical handoffs in wireless overlay networks. ACM MONET, Summer 1998. [40] J. Strauss, D. Katabi, and F. Kaashoek. A measurement study of available bandwidth estimation tools. In IMC, 2003. [41] Z. Tang and J. J. Garcia-Luna-Aceves. Hop-reservation multiple access (HRMA) for ad-hoc networks. In INFOCOM, 1999. [42] A. Tzamaloukas and J. J. Garcia-Luna-Aceves. A receiver-initiated collision-avoidance protocol for multi-channel networks. In INFOCOM, 2001. [43] A. Woo, T. Tong, and D. Culler. Taming the underlying challenges of reliable multihop routing in sensor networks. In SenSys, 2003. [44] S.-L. Wu, C.-Y. Lin, Y.-C. Tseng, and J.-P. Sheu. A new multi-channel MAC protocol with on-demand channel assignment for multi-hop mobile ad hoc networks. In I-SPAN, 2000. [45] S. Xu and T. Saadwi. Does the IEEE 802.11 MAC
APPENDIX A.
INCORPORATING BACKOFF INTO ETT
We now show that it is possible to estimate 802.11 backoff, but that adding backoff to ETT does not produce a performance improvement to justify the additional complexity. Recall that our definition of ETT (Equation 7) does not account for the time spent in backoff, waiting for access to the radio channel. To investigate this issue, we derive an expression for ETT that includes backoff. For calculating ETT that includes backoff, we use a simplified model of the 802.11 MAC protocol, along the lines of Bianchi [8] and Cali et al. [10]. Assuming that only one station is active, the packet transmission sequence is as follows. Consider the ith retransmission of the packet from node x to y. First, the station waits to ensure that the medium is idle for DIFS period of time. It then selects a random backoff interval which depends on past loss history. We denote this interval by CWi . The station then transmits the packet. If the size of the packet is S and data rate is B, then the packet transmission duration is S/B. Assuming that the transmission is successful, the packet is received by the receiver after the transmission delay, τ . The receiver waits for SIF S amount of time, and sends an acknowledgment. The time to transmit the acknowledgment is denoted by ACK. The acknowledgment reaches the receiver after the transmission delay τ . Thus, the total transmission duration for the ith retransmission ti is equal to: ti = DIF S + CWi +
S + τ + SIF S + ACK + τ B
(8)
We simplify this expression by assuming that the total transmission duration is dominated by the duration of the backoff and the packet transmission time. Thus, Equation (8) simplifies to: S (9) B The 802.11 MAC will retransmit a packet up to 7 times. For simplicity, we will assume that the MAC continues to retransmit the packet until it is successful. Recall that s(k), defined in Equation (1) denotes the probability that k transmissions will be required to successfully complete the packet transmission. Then, the expected time required for successful transmission of the packet is given by: ti = CWi +
∞
�
i=k
s(k) ∗
ETT =
ti
�
(10)
i=1
k=1
We substitute the expression for ti from Equation (9) into Equation (10): ETT = ETbackof f + ETxmit Where: ∞
i=k
s(k) ∗
ETbackof f = k=1
127
�
CWk i=1
�
(11)
(12)
ETxmit =
S k ∗ s(k) ∗ B
k=1
�
Packet Size = 1000 Bytes, Data Rate = 1Mbps, CWmin = 320 microsec 0.06 Formula: Transmit + Backoff Formula: Transmit only 0.05 NS Simulation
(13)
Transmission Time (seconds)
�
∞
Equation (12) represents the expected amount of time spent in backoff. Equation (13) is the amount of time spent in packet transmission; in other words, this is ETT as defined in Equation (7). We now focus on simplifying the backoff equation. To simplify Equation (12), we first need to simplify the following sum: CWk
(14)
� � ��
i=k i=1 CWk i=k i−1 CWmin i=1 2 2 i=7 i−1 CWmin i=1 2 2
+ 64 ∗ (k − 7)
�
for for
k≤7 k≥8 (15)
= (2k − 1) ∗ CW2min = (63 + 64 ∗ (k − 7)) ∗
CWmin 2
for for
k≤7 k≥8
(16)
By substituting the expression for Zk from Equation (16), and expression for s(k) from Equation (1), into Equation (12) and simplifying, we get: ETbackof f =
CWmin ∗ f (p) 2
0.1
0.2
0.3 0.4 0.5 Loss Rate
0.6
0.7
0.8
also included. At very high loss rates, the simulator drops some of the packets since they can not be delivered even after 7 retries. These packets are not included in the ETT calculated from the simulation. The formula, however, assumes that the packets are retransmitted as many times as necessary. Thus, at high loss rates, the predicted ETT value is higher than the observed value. To determine the actual performance impact of including backoff in ETT, we repeated the two-radio experiment of Section 6.3, using WCETT with β = 0.5. The results were virtually identical: the median throughput was 2927 Kbps instead of 2989 Kbps. Given these simulation and experimental results, we conclude that although backoff can be estimated and included in ETT, it is not worth the extra complexity in the metric.
Simplifying the summation on the RHS leads to: Zk
0.01
Figure 13: Computed ETT matches well with simulation results.
Recall that CWk represents the duration of the kth backoff window. The 802.11 MAC selects the initial backoff window, CW1 , at random from the interval (0, CWmin ). The value of CWmin is fixed for a given PHY type. For successive retransmissions of the packet, this interval is doubled exponentially. That is, for the second transmission of the packet, the backoff window will be chosen from interval (0, 2 ∗ CWmin ), for the third transmission, the window will be chosen from (0, 4 ∗ CWmin ) etc. Thus, for the ith transmission of the packet, the backoff window, CWi , will be chosen from the interval (0, 2i−1 CWmin ). The exponential doubling continues until the interval becomes as large as (0, CWmax ). After this, the interval is no longer doubled. The exact value of CWmax depends on the underlying PHY layer. To simplify our analysis of the backoff interval, we will make three assumptions. First, we assume that a packet is retransmitted as many times as necessary. In reality, the 802.11 MAC will discard a packet that can’t be delivered after 7 retries. Second, we will assume that CWmax = 64 ∗ CWmin . Third, whene the backoff window CWi , is chosen from an interval (0, X), we will approximate it by saying that CWi = X . 2 Given the above assumptions, it follows that: = = =
0.02
0
i=1
Zk
0.03
0
i=k
Zk =
0.04
(17)
where: 1 + p + 2p2 + 4p3 + 8p4 + 16p5 + 32p6 + 64p7 1−p (18) The computed ETT matches well with simulation results. We show results from a simple simulation scenario in Figure A. We simulated a transfer of 1000 packets between a pair of nodes at each different loss rate. Each point of the simulation result represents the average transmission time of these 1000 packets. The match between the simulation results and the formula is slightly better if backoff time is f (p) =
128