Malaysian Journal of Pharmaceutical Sciences Vol. 10, No. 1, 23–44 (2012)
RP-UPLC METHOD DEVELOPMENT AND VALIDATION FOR THE DETERMINATION OF NATEGLINIDE IN BULK DRUG AND PHARMACEUTICAL FORMULATIONS: A QUALITY BY DESIGN APPROACH CIJO MADATHIL XAVIER, KANAKAPURA BASAVAIAH, PAVAGADA JAGANATHAMURTHI RAMESH, KANAKAPURA BASAVAIAH VINAY AND HOSAKERE DODDAREVANNA REVANASIDDAPPA Department of Studies in Chemistry, Manasagangothri, University of Mysore, 570006, India Quality by design (QbD) is a systematic process to build quality into a product from the inception to final output. QbD requires a thorough understanding of a product and its process of manufacture, necessitating an investment in time and resources upfront in the discovery and development of a product. For QbD, the product and process knowledge base must include an understanding of variability in raw materials, the relationship between a process and product's critical quality attributes (CQAs), and the association between CQAs and a product's clinical properties. Here, a QbD approach to method development and validation is presented on nateglinide (NTG), an antidiabetic drug. To facilitate studies investigating the determination of NTG in bulk drug and its pharmaceutical formulations, we developed and validated a rapid ultra performance liquid chromatography (UPLC) method for determination of NTG. The validated limit of quantitation (LOQ) of 0.06 µg mL-1 and limit of detection (LOD) of 0.02 µg mL-1 are low enough to allow determination of low concentrations of the drug. NTG showed no degradation at different stress conditions. The relative standard deviation (RSD) percentage for robustness and ruggedness were observed within the range of 0.1 and 1.74. The calibration was linear in the range of 0.06–250 µg mL-1. The proposed method was compared with a pharmacopoeial reference method and found to give equivalent result. The proposed method can be used for routine analysis in quality control laboratories for its bulk and formulated product and this is the first reported UPLC method for the assay determination of NTG. Keywords: UPLC, Nateglinide, QBD, Validation, Degradation
INTRODUCTION The aim of pharmaceutical development is to design a quality product and its manufacturing process to consistently deliver the intended performance of the product. The information and knowledge gained from pharmaceutical development studies and manufacturing experience provide scientific understanding to support the establishment of the design space, specifications and manufacturing controls. Information from pharmaceutical development studies can be a basis for quality risk management. It is important to recognise that quality of the pathway for the method development cannot be tested in a product; i.e., quality should be built-in by design. Changes in formulation and manufacturing processes during development and lifecycle management should be
Corresponding author: Kanakapura Basaviah, email:
[email protected]
© Penerbit Universiti Sains Malaysia, 2012
24
Xavier C M et al.
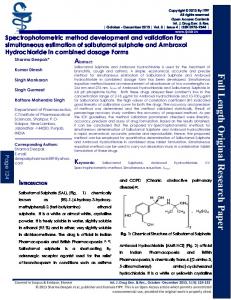
looked upon as opportunities to gain additional knowledge and further support establishment of the design space. Similarly, inclusion of relevant knowledge gained from experiments giving unexpected results can also be useful. Design space is proposed by the applicant and is subjected to regulatory assessment and approval. Quality by design (QbD) [Frederick and Alireza 2010; Center for Drug Evaluation and Research 1994; Snyder, Kirkland and Glajchl 1988] is a concept which was first described by Juran (1992). QbD deals with getting to market reliably and knowing enough about the limitations and risks associated with formulation and production methods in order to establish appropriate mitigation and contingency plans. QbD principles have been used to advance product and process quality in every industry, and particularly the automotive industry, they have most recently been adopted by the US Food and Drug Administration (FDA) [International Conference on Harmonisation (ICH) 2006, 2005; USFDA 2004) as a vehicle for how the drugs are discovered, developed, and commercially manufactured. Since first initiated by the FDA in its "Pharmaceutical cGMPs for the Twenty First Century", QbD has become an important concept for the pharmaceutical industry that is further defined in the ICH guidance (ICH 1994) on pharmaceutical development as "a systematic approach to development that begins with predefined objectives and emphasises product and process understanding and process control, based on sound science and quality risk management". The scientific understanding gained during the method development process can be used to devise method control elements and to manage the risks identified. Ultra performance liquid chromatography (UPLC), particularly, is the most popular and advanced analytical technique in the pharmaceutical industry. The quality of UPLC methods has become increasingly important in a QbD environment. For the purpose of QbD for UPLC methods, robustness and ruggedness should be verified early in the method development stage to ensure method performance over the lifetime of the product. Nateglinide (NTG) [3-phenyl-2-[(4-propan-2-ylcyclohexanecarbonyl)amino] propanoic acid] is an oral antihyperglycemic (Drugs.com 2012) agent used for the treatment of non-insulin-dependent diabetes mellitus (NIDDM) (Figs. 1 and 2). It belongs to the meglitinide class of short-acting insulin secretagogues, which act by binding to β cells of the pancreas to stimulate insulin release. NTG is an amino acid derivative that induces an early insulin response to meals decreasing postprandial blood glucose levels.
Fig. 1: Structure of NTG.
Malay J Pharm Sci, Vol. 10, No. 1 (2012): 23–44
25
RP-UPLC Analysis of Nateglinide
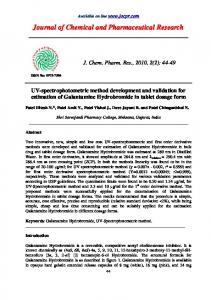
Fig. 2: UV absorption spectra of NTG. NTG is included in the official drafts of United States Pharmacopoeia (United States Pharmacopoeia 2011) and European Pharmacopoeia (EDQM 2011) which recommend HPLC method for its assay. In the literature, several HPLC methods (Lakshmi, Rajesh and Shrinivas 2010; Shalini et al. 2010; Kanthi et al. 2008; Li, Tian and Kaic 2008; Varanasi et al. 2008; Danai et al. 2007; Jolly et al. 2007; Pathare, Jadhav and Shingare 2006–2007; Srinivas et al. 2007; Wang and Sun 2007; Zhu, Lin and Li 2006; Mao, Liang and Qin 2006; He, Yan and Xiaoyan 2005; Gu 2004; Steffen et al. 2003; Yang, Wang and Liuxi 2002) are available for the determination of NTG in human plasma, rat plasma, rabbit plasma, chiral and related substances. Reported methods for the determination of NTG in pharmaceuticals include HPTLC (Asha et al. 2011; Kale and Kakde 2011), spectrophotometry (Cijo et al. 2011; Sekaran, Lavudu and Prameela 2010; Jain, Bhandari and Purohit 2009; Suresh, Anil and Suresh 2009; Rajasekaran et al. 2004; Sagar, Rao and Sastry 2004; Vidya 2004; Tianbao, Li and Shengli 2003), electrokinetic chromatography (Hongyuan et al. 2004) and capillary electrophoresis (Zhao and Chen 2003). According to literature survey, there are quite a few publications on UPLC method development (Elie et al. 2007; Stephan and Pierre 2006) strategy but the method development approaches for RP-UPLC specifically focused on pharmaceutical development in a QbD environment for NTG have not been reported anywhere. Furthermore, no UPLC methods are reported for the determination of NTG in bulk and formulated forms. Therefore, there is an unmet need to investigate a systematic UPLC method development approach for pharmaceutical development using QbD principles to ensure the quality of the method throughout the product lifecycle. The primary objective of this study was to implement QbD approach to develop and validate an RP-UPLC method that could separate drug in the bulk and formulated forms from its potential related substances and to establish an in-depth understanding of the method and build in the quality during the method development to ensure optimum method performance over the lifetime of the product with a suitable degradation data. METHODS Materials and Reagents Pure active ingredient sample of NTG was kindly supplied by Glenmark Pharmaceuticals (Mumbai) as gift. Two NTG containing tablets, Natilide-60 (60 mg) [Alembic Ltd., Malay J Pharm Sci, Vol. 10, No. 1 (2012): 23–44
Xavier C M et al.
26
Vadodara, India] and Glinate-60 (60 mg) [Glenmark Pharmaceuticals, Mumbai] were procured from the local market. HPLC grade acetonitrile was purchased from Merck (Mumbai), potassium dihydrogenorthophosphate and orthophosphoric acid were from Qualigens (India). Double distilled water was used throughout the investigation. Chromatographic Conditions and Equipments Analyses were carried out on a Waters Aquity UPLC with Tunable UV (TUV) [Waters Corporation, Milford, MA, USA] detector. The output signal was monitored and processed using the built-in Empower software. The chromatographic column used was Acquity UPLC BEH C-18 (100 × 2.1) mm with 1.7 µm particle size. Isocratic elution process was adopted throughout the analysis. Mobile phase used was 40:60 (buffer:acetonitrile) v/v (buffer-potassium dihydrogen orthophosphate of pH 2.8). Instrumental Parameters The isocratic flow rate of mobile phase was maintained at 0.40 mL min–1. The column temperature was adjusted to 35°C. The injection volume was 2 µL. Eluted sample was monitored at 210 nm and the run time was 6.0 min. The retention time of the sample was about 2.8 min. Stress Study Twenty mg of pure NTG was transferred into 3 different 100 mL volumetric flasks and added with 5 mL of 5 M HCl, 5 M NaOH or 5% H2O2 separately, and the flasks were heated for 2 h on a water bath maintained at 80C. Then the solutions were cooled and neutralised by adding base or acid, the volume in each flask was brought to the mark with mobile phase, and the appropriate volume (2 µL) was injected for analysis. Solid state thermal degradation was carried out by exposing pure drug to dry heat at 105C for 3 h. For photolytic degradation studies, pure drug in solid state was exposed to 1.2 million lux hours in a photo stability chamber (ICH 1994). The sample after exposure to heat and light was used to prepare 200 µg mL–1 solutions in mobile phase and the chromatographic procedure was followed. Preparation of Stock Solution A stock standard solution of NTG (200 µg mL–1) was prepared in mobile phase and used for validation. Procedures Procedure for Preparation of Calibration Curve Working solutions containing 0.06–250 µg mL–1 of NTG were prepared by serial dilutions of aliquots of the stock solution. Aliquots of 2 µL were injected (six injections) and eluted with the mobile phase under the reported chromatographic conditions. The average peak area versus the concentration of NTG in µg mL–1 was plotted. Alternatively, the
Malay J Pharm Sci, Vol. 10, No. 1 (2012): 23–44
27
RP-UPLC Analysis of Nateglinide
corresponding regression equation was derived using mean peak area-concentration data and the concentration of the unknown was computed from the regression equation. Preparation of Tablet Extracts and Assay Procedure Twenty Natilide-60 tablets (each tablet contained 60.0 mg NTG) were weighed and transferred in to a clean, dry mortar and powdered. Tablet powder equivalent to 20 mg of NTG was transferred in to a 100 mL volumetric flask and 60 mL of the mobile phase was added. The solution was sonicated for 20 min to achieve complete dissolution of NTG, made up to the mark with mobile phase and then filtered through a 0.22 µm nylon membrane filter. The solution (200 µg mL-1 of NTG) obtained was analysed by UPLC. The same procedure was repeated with 20 Glinate-60 (each tablet contained 60.0 mg NTG) tablets. Procedure for Method Validation Accuracy and precision To determine the accuracy and intra-day precision, pure NTG solutions at three different concentrations were analysed in seven replicates during the same day. Mobile phase was injected as blank solution before sample injection and the relative standard deviation [RSD] (%) values of peak area and retention time were calculated. Limits of detection (LOD) and quantification (LOQ) The LOD and LOQ were obtained by signal to noise (S/N) ratio method and by a series of dilutions of the NTG stock solution. Precision study was performed at LOQ level also. LOQ solution was injected seven times (n=7) and the RSD % values for the obtained peak area and retention time were calculated. Linearity Linearity solutions were prepared from LOQ level to 125% of the actual sample concentration (200 µg mL–1 NTG). A total of six concentrations of the solutions were made separately and injected (LOQ 50, 100, 150, 200 and 250 µg mL–1 levels). Robustness and Ruggedness To determine the robustness of the method the experimental conditions were deliberately changed. The flow rate of the mobile phase (0.4±0.04 mL min–1), column oven temperature (35±1°C), mobile phase composition (45:55, 55:45, acetonitrile:buffer, v/v) and detection wavelength (210±1 nm) were the varied parameters. In each case the RSD % values were calculated for the obtained peak area and retention time. The number of theoretical plates and tailing factors were compared with those obtained under the optimised conditions. Three different columns of same dimensions were used for the analyses. The study was performed on three different days by three different analysts. The area obtained from each concentration was compared with that of the optimised one. The relative standard deviation values were evaluated for each concentration.
Malay J Pharm Sci, Vol. 10, No. 1 (2012): 23–44
28
Xavier C M et al. Solution Stability and Mobile Phase Stability
Stability of NTG solution was investigated by injecting the sample into the chromatographic system. The peak area was recorded in the time intervals of 0, 12 and 24 h and the RSD values were calculated. The mobile phase stability was studied by injecting a freshly prepared sample solution at the same time intervals (0, 12 and 24 h) with the same mobile phase and RSD values of the peak areas were calculated. RESULTS Method Development for Acquity BEH C8 Column, 100 2.1 mm, 1.7 µm All the trials are shown in Table 1 and chromatograms are shown in Figure 3. Method Development for Acquity BEH C18 Column, 100 2.1 mm, 1.7 µm All the trials are shown in Table 2 and chromatograms are shown in Figure 4. Method Development for C18 Using Different pH Conditions All the trials are shown in Table 3 and chromatograms are shown in Figure 5. Final Method Conditions Column Oven temp. Mobile phase Run time Flow Diluent Inj. volume Blank Wavelength
: Acquity BEH C18, 100 × 2.1 mm, 1.7 µm : 35ºC : ACN:buffer (pH 2.8; 40:60%, v/v) : 6 min : 0.2 mL/min : Mobile phase : 2 µL : Diluent : 210 nm
Table 1: Observation and remarks of method development for Acquity BEH C8, 100 2.1 mm, 1.7 µm column. S. no
Trails taken
Observations
Remarks
1
ACN:buffer (pH 2.8; 40:60%, v/v)
Asymmetrical peak with fronting and tailing
Not satisfactory
2
ACN:water (40:60%, v/v)
Asymmetrical peak with tailing
Not satisfactory
3
Methanol:water (40:60%, v/v)
Completely split peak
Not satisfactory
4
Methanol:buffer (pH 2.8; 40:60%, v/v)
Asymmetrical peak with tailing
Not satisfactory
Malay J Pharm Sci, Vol. 10, No. 1 (2012): 23–44
29
RP-UPLC Analysis of Nateglinide
Fig. 3(a): Chromatogram for mobile phase [ACN:buffer (pH 2.8; 40:60%, v/v)].
Fig. 3(b): Chromatogram for mobile phase [ACN:water (40:60%, v/v)].
Fig. 3(c): Chromatogram for mobile phase [methanol:water (40:60%, v/v)].
Malay J Pharm Sci, Vol. 10, No. 1 (2012): 23–44
30
Xavier C M et al.
Fig. 3(d): Chromatogram for mobile phase [methanol:buffer (pH 2.8; 40:60%, v/v)]. Table 2: Observation and remarks of method development for Acquity BEH C18, 100 × 2.1 mm, 1.7 µm column. S. no
Trails taken
Observations
Remarks
1
ACN:buffer (pH 2.8; 40:60%, v/v)
Symmetrical peak
Satisfactory
2
ACN:water (40:60%, v/v)
Asymmetrical peak with tailing
Not satisfactory
3
Methanol:water (40:60%, v/v)
Completely split peak
Not satisfactory
4
Methanol:buffer (pH 2.8; 40:60%, v/v)
Asymmetrical peak with tailing
Not satisfactory
Fig. 4(a): Chromatogram for mobile phase [ACN:buffer (pH 2.8; 40:60%, v/v)].
Malay J Pharm Sci, Vol. 10, No. 1 (2012): 23–44
31
RP-UPLC Analysis of Nateglinide
Fig. 4(b): Chromatogram for mobile phase [ACN:water (40:60%, v/v)].
Fig. 4(c): Chromatogram for mobile phase [methanol:water (40:60%, v/v)].
Fig. 4(d): Chromatogram for mobile phase [methanol:buffer (pH 2.8; 40:60%, v/v)].
Malay J Pharm Sci, Vol. 10, No. 1 (2012): 23–44
32
Xavier C M et al. Table 3: Observation and remarks of method development for different pH conditions. S. no
Trails taken
Observations
Remarks
1
ACN:buffer (pH 2.8; 40:60%, v/v)
Peaks found symmetrical
Satisfactory
2
ACN:buffer (pH 4; 40:60%, v/v)
Peak eluted early with less theoretical plates
Not satisfactory
3
ACN:buffer (pH 5; 40:60%, v/v)
Completely split peak
Not satisfactory
4
ACN:buffer (pH 6; 40:60%, v/v)
Completely split peak
Not satisfactory
Fig. 5(a): Chromatogram for mobile phase [ACN:buffer (pH 2.8; 40:60%, v/v)].
Fig. 5(b): Chromatogram for mobile phase [ACN:buffer (pH 4; 40:60%, v/v)].
Malay J Pharm Sci, Vol. 10, No. 1 (2012): 23–44
33
RP-UPLC Analysis of Nateglinide
Fig. 5(c): Chromatogram for mobile phase [ACN:buffer (pH 5; 40:60%, v/v)].
Fig. 5(d): Chromatogram for mobile phase [ACN:buffer (pH 6; 40:60%, v/v)]. Validation of the Method The described method for the assay of NTG has been validated as per the current ICH Q2 (R1) Guidelines. Analytical Parameters A calibration curve was obtained for NTG from LOQ to 125% of its stock solution. A linear correlation was obtained between the mean peak area and the concentration in the range of 0.06–250 µg mL–1 NTG from which the linear regression equation was computed and found to be: Y = mC + a, (r = 0.9999) where Y is the mean peak area, C is the concentration of NTG in µg mL–1, a is the intercept and r is the correlation coefficient. The LOD and LOQ values, slope (m), y-intercept (a) and their standard deviations are evaluated and presented in Table 4. These results
Malay J Pharm Sci, Vol. 10, No. 1 (2012): 23–44
34
Xavier C M et al.
confirm the linear relation between the mean peak area and concentration as well as the sensitivity of the method. Table 4: Linearity and regression parameters with precision data. Parameter
Value
Linear range, µg mL–1
0.1–250
Limits of quantification, (LOQ), µg mL–1
0.06
Limits of detection, (LOD), µg mL–1
0.02
Regression equation Slope (b)
19930.392
Intercept (a)
1015594.2
Correlation coefficient (r)
0.9999
Standard deviation of b, (Sb)
116.197
Standard deviation of a, (Sa)
19269.127
Accuracy and Precision The percent relative error which is an index of accuracy is ≤15 and is indicative of high accuracy. The calculated RSD % can be considered to be satisfactory. The peak area based and retention time based RSD values were