1Department of Information Technology, Széchenyi István University, GyÅr, Hungary ... the best performing initial rule base for the data sets. The data sets used ...
16th World Congress of the International Fuzzy Systems Association (IFSA) 9th Conference of the European Society for Fuzzy Logic and Technology (EUSFLAT)
Rule-Base Parameter Optimization for a Multi-Stroke Fuzzy-Based Character Recognizer Alex Tormasi1, 2 Laszlo T. Koczy2, 3 1
Department of Information Technology, Széchenyi István University, Győr, Hungary 2 Department of Automation, Széchenyi István University, Győr, Hungary 3 Department of Telecommunication and Mediainformatics, Budapest University of Technology and Economics, Budapest, Hungary number of training samples and the parameter of the fuzzy set generator function are investigated in this study. The basic concept of the Multi-Stroke Fuzzy-Based Character Recognizer is presented in Section 2 after the Introduction. It is followed by the details of the experiment. The results of the study are presented and interpreted in Section 4. Section 5 summarizes the results and discusses possible directions for a future research.
Abstract In this paper the results of rule-base construction parameter optimization for a multi-stroke fuzzy character recognizer are compared. The experiment covers the investigation of the optimal number of samples used to build the rule-base and the parameter of the method to generate fuzzy sets from the training set collected from subjects. The various settings are evaluated with validation samples from the same group of test subjects.
2. Concept of Multi-Stroke Fuzzy-Based Character Recognizer
Keywords: multi-stroke character recognizer, fuzzy classifier, fuzzy rule-base construction
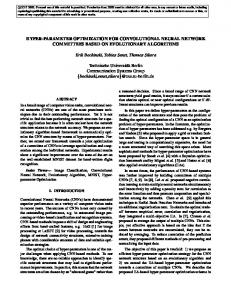
At the beginning of the development of FUBAR algorithm family four key features were defined in order to create an acceptable, accurate and efficient method, these are the following: (1) the system has to be able to reach the user acceptance threshold for character recognizers [19]; (2) the developed methods must respond in an acceptable time even on hardware with low resources; (3) the knowledge representation of the system must be flexible in order to change the alphabet; (4) the recognizer must be able to learn user specific writing style. The designed system is an on-line personalized (hand printed) character recognizer, which means it uses list(s) of chronologically ordered x and y coordinate pairs representing the pen-stroke(s) as input (Fig. 1) and deploys user-specific information.
1. Introduction Classification problems such as character recognition are still a widely researched and active area of computational intelligence [1-3]. The most difficult part of these problems is to extract the knowledge from the samples and construct a proper and acceptable setting of the classifier systems. Meta heuristic optimization techniques [4-8] like evolutionary algorithms and other population based methods are often used in order to train an artificial neural network [9] or to build a rulebase [5] for a fuzzy system [10-12]. Former results were suggesting that, the various meta-heuristic optimization algorithms behave differently on various initial rule-base settings; some methods are performing better when building a fuzzy rule-base from scratch, while others "prefer" to start from a predefined state and tune its parameters [13]. The better understanding of the behavior of the system regarding the rule-base construction parameters might give a better opportunity to prepare the initial rule-bases with low computational cost. The multi-stroke version [14, 15] of the FUzzyBAsed Recognizer (FUBAR) algorithm family [14, 1618] was selected as the basis of the experiment. In these articles various meta-heuristic algorithms with wide parameter and contextual settings were used to determine the best performing initial rule base for the data sets. The data sets used in the experiment were generated from a randomly ordered samples database collected earlier from test subjects. The data sets were divided into training and validation sets. The training set was used to determine statistically the fuzzy sets of the rule antecedents. The effect on the systems’ accuracy of the
© 2015. The authors - Published by Atlantis Press
Fig. 1: A pen-stroke from various views: a) in 3-D, b) changes in the value of y by time, c) the 2-D projection, d) changes in the value of x by time
1331
However the received strokes usually are noncontinuous as seen in Fig. 2 (a).
Fig. 2: Fragmented (received) input (a) and re-sampled input (b)
Fig. 5: Concept of fuzzy grid
The fragmentation of the stroke is a result of hardware limitations such as bus bandwidth and processor load. In order to eliminate the recognition difficulties caused by the information loss, further processing of the input is unavoidable. The easiest way to have a relatively balanced distribution of the stroke-points is to resample the input as seen in Fig. 2 (b). Re-sampling is done during the stroke movement recording process; the system stores only those points, which are at least in a given a (Euclidean) distance from the previously stored point (started from the beginning of the stroke). This function also has the ability to reduce the noise (anti-aliasing) in the input as seen in Fig. 3.
This enables the system to reduce or even eliminate the negative effects (stroke-point shifting) of italic writing style by blurring the borders of the grid. FUBAR uses the width/height ratio of the input stroke and the average membership degree of the points in each row and column of the fuzzy grid drawn around the letter. The optimal resolution of the grid for the given data set was formerly determined as 4 rows by 3 columns (described by 7 fuzzy sets). The formation of fuzzy grids are detailed in [16-18]. The recognizer uses fuzzy inference method [11-12] for the inference, where each letter is represented by a single fuzzy rule (Fig. 6). The input parameters of the rule are the extracted features, while the consequent part of the rules is the degree of matching between the received stroke and the letter represented by the given rule. The standard (minimum) t-norm as AND operator was selected for the system after the initial test of the early algorithms. This is a strict operator, which has its advantages and disadvantages in this case. The greatest advantage is that this way the method can easily rule out those candidates, which has zero membership value for any parameter. Its disadvantage is the same; if the initial rule base does not cover big enough range of the given parameter, then the system may rule out all the candidates, even de good one. This shows the importance of the initial rule base.
Fig. 3: Re-sampling: a) received input, b) selected points of the stroke, c) stored points of the stroke. The other difficulty in the recognition is caused by the italic writing style of the letters, which occurred when the test subjects were more experienced and bored because of the monotonic work. The stored points of the stroke are shifted when written in italic as seen in Fig. 4.
Fig. 6: A fuzzy rule describing the ith letter
After the evaluation of the rules the system results with the letter assigned to the rule with the highest degree of matching. The inference phase is followed by the learning step, which requires the supervision of the user. When the system processed the input stroke and the user reinforces or corrects the result, the method starts to adjust the fuzzy sets in the rule antecedents in order to store the new knowledge (and adopt the user’s writing style). The learning phase was completely disabled during the presented experiment in order to eliminate the distortions of the results caused by the unpredictable modifications of the rule-base. The main concept of the FUBAR algorithm family is summarized in Fig. 7.
Fig. 4: Normal (straight) a) and italic b) writing style
The caused shift in the sampled points inhibits the proper functionality of grid based feature extraction methods. Most recognizers resolve this problem by rotating the input, but it is a resource consuming complex transformation, which goes against the second key feature defined during the design. This led to the design of fuzzy grids (drawn around the stroke) [16-18], where the columns and rows are defined by fuzzy sets. A point in the fuzzy grid could be in two rows or columns at the same time with different membership degrees as seen in Fig. 5.
1332
Fig. 7: Concept of FUBAR engine
Multiple strokes are merged (concatenated) by the system and processed as one. The multi-stroke version of FUBAR is detailed in [14] and [15].
Fig. 9: Preparation of Validation and Various Training Data Sets
Three independent rule-bases were constructed from the samples of the training data sets. The fuzzy sets in the antecedents of the rules were determined with 72 (6x12) configurations of the investigated parameters. The first investigated parameter is the number of training samples used to build the rules. The first 10, 20, 30, 40, 50 and 60 entries from the training set were used (for each letter) respectively to determine the main breakpoints of the trapezoid shaped membership functions of the antecedents as seen in Fig. 10.
3. Experiment Details The samples used during the experiment were collected from 12 Hungarian test subjects. Most of the subjects were right-handed male students from the Széchenyi István University; each in the same age group 18-24 and from the same cultural background. The samples were limited to 26 English capital letters and the shapes of the letters were predefined. Each subject provided 40 samples for each letter, which was stored anonymously in a database. The samples were verified in order to eliminate the uncompleted/mistaken letters. 180 entries were selected randomly for each letter from the database to prepare the data sets. All the samples (for each letter) were reordered randomly to construct three data sets for the experiment. The process of the data preparation is shown in Fig. 8.
Fig. 10: Determining breakpoints of fuzzy sets
T2 and T3 breakpoints of the trapezoid membership function were always determined by the second and third quartiles of the training samples for the given feature respectively. T1 and T4 were calculated from the minimum and maximum values of the data set for the given feature according to the second studied parameter is construction parameter (Pc), which represents the degree of membership for the minimum and maximum values for the given features respectively as seen in Fig. 11.
Fig. 8: Preparation of Data Sets for the Experiment
Each of the three prepared data sets was divided into training and validation data sets. Each training data set consisted of 60 samples per letters, while each validation data set consisted of 120 entries per symbols as seen in Fig. 9.
Fig. 11: Interpolating T1 and T4 breakpoints
Pc parameter was studied for the values of 0.0, 0.1, 0.2, 0.25, 0.3, 0.4, 0.5, 0.6, 0.7, 0.75, 0.8 and 0.9 in
1333
each case. For each 6 training set size configurations (10-60) 12 Pc configurations were used to construct the fuzzy sets, which were used in the antecedents of the rules. When the rule-base was constructed, the 120 samples per letters from the validation and the training set were used to evaluate the rule-bases. These steps were repeated for each three data sets. 4. Results First the training sets were evaluated for each three data sets in order to see how much samples are covered by the generated fuzzy sets. For data set #1 and data set #2 the system reached 100% average recognition rate for the training sets, where the Pc value was between 0.1 and 0.9. The results were the same for each training set sizes (10, 20, …, 60). When the Pc value was set 0.0, the training set resulted with different errors depending on the size of the training set. This was expected, since in this case samples with the minimum and maximum feature values were not covered by the fuzzy sets. The results for data set #3 were very similar to the results of data set #1 and #2, but there were 2 training samples which could not be recognized, when the training set size was set to 30, 40, 50 and 60 even with Pc value between 0.1 and 0.9. This slightly difference between these data sets seems insignificant and completely normal. The average error rate for each data set with various training set sizes and 0.0 value for Pc parameter is in Fig. 12.
Fig. 13: Validation Results Using 10 Samples for Construction
While data set #1 reached significantly lower error rates for the training set (using 10 samples) than data set #2 and #3 for each sample set sizes, it was performing significantly higher error rates for the validation set. Considering these results it is highly probable, that data set #1 had more uniform samples in its training set, than the other two. The system reached the lowest recognition rates (or highest error rates) with the value of 0.0 for Pc and the highest recognition rates for Pc=0.9 as expected. It is important to highlight that, the decrease in the average error rates is reduced by the higher Pc values; while there is almost 10% difference between the error rates until Pc=0.7, then it drops to 5% for the data set #2 and #3.
Fig. 14: Validation Results Using 20 Samples for Construction
Similar results were achieved, when the size of training set was increased to 20 samples per letter. Average error rates are significantly lower (over 20%) and the decrease of error rates is lower by the higher Pc values as expected. This behaviour can be explained by higher diversity of the parameter values in the samples. However it is interesting, that the results for data set #1 started to converge faster to the results of data set #2 and #3, but it can be also explained by the more diverse training samples.
Fig. 12: Average Error Rate for Training Data Sets with Pc=0.0
Data set #1 reached significantly lower error rate for the training sets than the other two, but the tendency of the values are similar. This means that the fuzzy sets generated from it covered more training samples; this could be explained only by that, the samples were more uniform or some outstanding values were generating fuzzy sets with larger coverage. No significant difference between the results of data set #2 and #3 could be observed. Fig. 13 – Fig. 18 are showing the average error rates of the validation data sets for the various Pc parameters, when the rule-base was generated with 10, 20, …, 60 training samples respectively.
1334
Fig. 15: Validation Results Using 30 Samples for Construction
Fig. 18: Validation Results Using 60 Samples for Construction
The decrease in the error rates compared to the previous results is definitely lower, when the number of training samples is increased to 30. The reduction of the decrease can be explained by that, the extended training set contains less diverse samples compared to the previous.
The average error rates for the same data sets can be seen in Fig. 19, Fig. 20 and Fig. 21 for various numbers of training samples. In each case the average error rate dropped more than 20%, when the size of the training set was increased from 10 to 20. Increasing the number of training samples by another 10 resulted in 10% decrease in the error rates.
Fig. 16: Validation Results Using 40 Samples for Construction
Training set with 40 samples reached more similar results for the data set #2 and #3 than previously. The reason is that, the training samples in the data sets are almost similar. The error rates of data set #1 are still significantly higher, than resulted by the other two data sets’, however this is only true for the lower Pc values. As the number of training samples is increasing the lower Pc value is required for a more similar error rate for all the three data sets. Same tendencies can be observed for 50 and 60 training samples in Fig. 17 and Fig. 18.
Fig. 19: Results for Validation Data Set #1
Fig. 20: Results for Validation Data Set #2
A higher decrease in error rate of data set #2 can be observed, when the number of samples were increased to 40 from 30 compared to data set #1 and #3. This 56% percent difference can be explained by the diversity of the samples.
Fig. 17: Validation Results Using 50 Samples for Construction
1335
Fig. 23: Best 3 Average Recognition Rates of Validation Data Set #2
Data set #3 achieved 99.65%, 99.62% and 99.55% average recognition rates with 40, 50 and 40 samples, with the Pc values of 0.75, 0.75 and 0.7 respectively. Fig. 21: Results for Validation Data Set #3
There were no significant differences between the results for the three data sets (considering the same parameter settings), which could not be explained by the uniformity/diversity of the training samples. Fig. 24: Best 3 Average Recognition Rates of Validation Data Set #3
5. Conclusions
These achieved recognition rates are significantly higher than reached with any of the previous settings (93.4% and 97.54%). The experiment showed that, even the slightest increase in the number of samples could result significant increase in the average recognition rate, while a properly selected construction parameter (Pc) can reduce the required size of the training set. The above test should be repeated with larger and different types of data sets in order to get more precise results. The study should also test the results with the training phase turned on to get more realistic data. Further research should also involve the investigation of the behavior of meta-heuristic algorithms according to the various number of samples used for the training. The possibility of a training method based on the fuzzy sets’ coverage for the candidate inputs and the results presented above should be investigated. It might give a new method with low time and resource requirements.
The accuracy of a multi-stroke FUBAR system was studied for three data sets with 72 configurations each. The number of samples in the training set was tested from 10 to 60 increasing by 10 samples (per letter). The construction parameter (Pc) was investigated for the values between 0.0 and 0.9 increased by 0.1 and additionally 0.25 and 0.75 were also included in the experiment. The various Pc settings were tested for each training set sizes. There were no significant differences between the results of the data sets for the same parameter settings. The error rate could be decreased more than 70% by increasing the value of Pc from 0.0 to 0.9 and about 30% for 0.5 to 0.9 using each data set with the rules constructed from 10 training samples per letter. The average recognition rate could be further increased by including more samples in the training set; 20% by increasing the number samples from 10 to 20 and about 15% for additional 10 samples. The more training samples were used the lower Pc value was required to reach the systems peak recognition rate. The best average recognition rate (99.07%) for data set #1 was achieved with the rule-base constructed with Pc value 0.75 using 50 training samples, the second best results (99.04%) was with the same Pc value, but with 60 samples, and the third best value (98.97) was achieved with 50 samples and a Pc with the value of 0.7.
Acknowledgement This paper is partially supported by the TÁMOP4.2.2.A-11/1/KONV-2012-0012 and Hungarian Scientific Research Fund (OTKA) grants K105529, K108405.
References [1] H. Ishibuchi and T. Nakashima, Effect of rule weights in fuzzy rule-based classification systems. In: IEEE Transactions on Fuzzy Systems, vol. 9, No. 4, pp. 506-515, 2001. [2] J. van den Berg, U. Kaymak and W.M. van den Bergh, Fuzzy classification using probability-based rule weighting. In: Proc. 11th IEEE International Conference on Fuzzy Systems, Hawaii, 2002. [3] H. Ishibuchi and T. Yamamoto, Rule weight specification in fuzzy rule-based classification systems. In: IEEE Transactions on Fuzzy Systems, vol. 13, No. 4, pp. 428-435, 2005.
Fig. 22: Best 3 Average Recognition Rates of Validation Data Set #1
The best recognition rates for the second data set are 99.71%, 99.68% and 99.58% with the Pc parameter values of 0.7, 0.6 and 0.6 and the number of training samples was 50, 50 and 60 respectively.
1336
systems and computational intelligence, SpringerVerlag, pp. 145-159, 2014. [19] M.J. LaLomia, User acceptance of handwritten recognition accuracy, Companion Proc. CHI ’94, New York, p. 107, 1994.
[4] J.H. Holland, Adaption in Natural and Artificial Systems. The MIT Press, Cambridge, Massachusetts, 1992. [5] N.E. Nawa and T. Furuhashi, Fuzzy system parameters discovery by bacterial evolutionary algorithm. In: IEEE Transactions on Fuzzy Systems, 7(5): 608–616, 1999. [6] K.O. Erol and I. Eksin, A new optimization method: Big Bang–Big Crunch, Advances in Engineering Software, Vol. 37, Issue 2, 106–111, 2006. [7] E. Atashpaz-Gargari and C. Lucas, Imperialist Competitive Algorithm: An algorithm for optimization inspired by imperialistic competition. In: Proc. 2007 IEEE Congress on Evolu-tionary Computation. 7., pp. 4661-4666, Singapore, 2007. [8] R. Eberhart and J. Kennedy, A New Optimizer Using Particle Swarm Theory. In: Proceedings of the IEEE International Conference on Neural Networks IV, IEEE Press, pp. 1942–1948 Piscataway, NJ, 1995. [9] P.A. Kowalski and S. Lukasik, Tuning Neural Networks with Krill Herd Algorithm. In: Proc. 6th Győr Symposium and 3rd Hungarian-Polish and 1st Hungarian-Romanian Joint Con-ference Computational Intelligence, ConfCI 2014, pp. 119-128, Győr, 2014. [10] L.A. Zadeh, Fuzzy sets. In: Inf. Control, 8:338-353, 1965. [11] E.H. Mamdani and S. Assilian, An experiment in linguistic synthesis with a fuzzy logic controller. In: International Journal of Man-Machine Studies, vol. 7., pp. 1–13, 1975. [12] T. Takagi and M. Sugeno, Fuzzy identification of systems and its applications to modeling and control. In: IEEE Transactions on Systems, Man. Cybernetics, vol. SMC-15, pp. 116-132, 1985. [13] A. Tormási, and L.T. Kóczy, Identification of the Initial Rule-Base of a Multi-Stroke Fuzzy-Based Character Recognition Method with Meta-Heuristic Techniques, Technical Transactions - Automatic Control 4-AC/2013, Krakow, pp. 103-115, 2013. [14] A. Tormási and L.T. Kóczy, Fuzzy-Based Multi-Stroke Character Recognizer, Preprints of the Federated Conference on Computer Science and Information Systems, pp. 675-678, Krakow, 2013. [15] A. Tormási, and L.T. Kóczy, Concept and Development of a Fuzzy-Based Multi-Stroke Character Recognizer, Technical Transactions - Automatic Control 2-AC/2013, Poland, pp. 13-22, 2013. [16] A. Tormási and J. Botzheim, Single-stroke character recognition with fuzzy method. In: New Concepts and Applications in Soft Computing SCI, vol. 417, V.E. Balas et al. (eds.), pp. 27–46, 2012. [17] A. Tormási and L.T. Kóczy, Comparing the efficiency of a fuzzy single-stroke character recognizer with various parameter values. In: Proc. IPMU 2012, Part I. CCIS, vol. 297, S. Greco et al. (eds.), pp. 260–269, 2012. [18] A. Tormasi and L.T. Kóczy, Fuzzy singlestroke character recognizer with various rectangle fuzzy grids. In: Issues and challenges of intelligent
1337