Biological Psychology 129 (2017) 111–120
Contents lists available at ScienceDirect
Biological Psychology journal homepage: www.elsevier.com/locate/biopsycho
Rule-based generalisation in single-cue and differential fear conditioning in humans
MARK
⁎
Alex H.K. Wong , Peter F. Lovibond University of New South Wales, Australia
A R T I C L E I N F O
A B S T R A C T
Keywords: Fear conditioning Generalisation Skin conductance level (SCL) Rules Learning
Fear generalisation refers to the spread of conditioned fear to stimuli similar but distinct from the original conditioned stimulus. In this study, participants were presented with repeated pairings of a conditioned stimulus with a shock, in either a single-cue or differential conditioning paradigm. Generalisation of fear was then tested by presenting stimuli that were novel, but similar to the conditioned stimulus along a spatial stimulus dimension. Dependent measures were online shock expectancy ratings and skin conductance level. A diverse range of generalisation gradients was observed, and the shape of the gradients for both expectancy ratings and skin conductance responses corresponded with participants’ verbally reported rules. The findings point to an important role for cognitively controlled processes in human fear generalisation, and provide support for a singlesystem learning model. They also highlight the potential importance of cognitive reappraisal in clinical treatments for over-generalised fear.
1. Introduction Associative learning refers to a learning process which associates two elements − for example, the conditioned stimulus (CS) and the unconditioned stimulus (US) in the case of Pavlovian conditioning (Pavlov, 1927). Interestingly, the conditioned response (CR) also spreads to novel stimuli which are similar but distinct from the original CS, a phenomenon referred to as generalisation (Pavlov, 1927). Generalisation is considered to be adaptive as it allows rapid adaptation to new situations and extends the benefits of learning. However, it has been claimed that anxiety patients shown overgeneralisation of fear, which suggests that excessive generalisation can be maladaptive (Lissek et al., 2010; Lissek & Grillon, 2010; Lissek et al., 2014). The present study investigates the mechanisms that underlie generalisation of fear learning in humans, guided by data and theory from both the associative learning and cognitive literatures. Generalisation of associative learning has been extensively studied in animals using an operant conditioning paradigm (e.g., Guttman & Kalish, 1956; Jenkins & Harrison, 1960). After learning to respond to a single reinforced stimulus (S+), animals showed maximum responses to S+, and a gradual decrement in response to stimuli more dissimilar to S+ along the stimulus dimension, forming a peaked generalisation gradient. This generalisation pattern has been replicated in numerous animal studies (see Honig & Urcuioli 1981 for a review). Interestingly, after discrimination training between S+ and a non-
⁎
reinforced stimulus (S-) lying on the same stimulus dimension, a sharper peaked gradient is observed, with the highest responding shifted to the stimulus adjacent to S+ (Hanson, 1959). This phenomenon has been coined ‘peak shift’, as the response peak shifts beyond S + in the direction away from S-. Different theoretical accounts have been put forward to account for the generalisation process, with the dominant ones being similaritybased associative accounts. These accounts emphasize similarity between stimuli, with the recent ones drawing attention to shared perceptual elements (Blough, 1975; McLaren and Mackintosh, 2002). These theories suggest that each stimulus is made up of individual elements (e.g., shape, colour, orientation). Stimuli that are perceptually more dissimilar share fewer common elements along the stimulus dimension and hence acquire less associative strength and automatically trigger weaker responses (Hull, 1934a, 1934b). This mechanism can account for the peaked generalisation gradient with the highest responding to the trained value and a gradual decrease in responding to stimuli along the dimension, as commonly found in the animal literature. It can also explain the occurrence of peak shift, in terms of the optimal balance between excitatory elements shared with CS+ and inhibitory elements shared with CS-. Hence, a stimulus beyond CS+ in the direction opposite of CS- would gain the highest net excitatory elements, as it shares similar numbers of excitatory elements with CS+ but fewer inhibitory elements with CS-, resulting in peak shift. However, the findings in human generalisation studies do not
Corresponding author at: School of Psychology, University of New South Wales, UNSW, Sydney, NSW 2052, Australia. E-mail addresses:
[email protected],
[email protected] (A.H.K. Wong).
http://dx.doi.org/10.1016/j.biopsycho.2017.08.056 Received 22 March 2017; Received in revised form 23 August 2017; Accepted 28 August 2017 Available online 01 September 2017 0301-0511/ © 2017 Elsevier B.V. All rights reserved.
Biological Psychology 129 (2017) 111–120
A.H.K. Wong, P.F. Lovibond
coming up with a different rule or no rule, this would instead suggest that fear generalisation in humans is associatively-driven. Expectancy ratings were expected to follow participants’ reported rules as in Ahmed and Lovibond’s studies (submitted [a], submitted [b]). The current study also sought to compare generalisation after differential conditioning with a single-cue conditioning procedure that involves only a single CS+ during training. Only a few studies have previously employed a single-cue paradigm (e.g., Baron, 1973; Wheeler, Anubdson, & Miller, 2006); and to our knowledge, no studies have tested a single-cue conditioning design in fear generalisation studies. Therefore, it would be beneficial to further our understanding of the contribution of associatively- and cognitively-driven generalisation by using a single-cue conditioning paradigm. The associative approach would always predict a peaked generalisation gradient, while the cognitive approach would be more flexible, predicting various gradients depending on participants’ inferred rules. Additionally, the single-cue conditioning paradigm arguably provides greater clinical relevance, as it mimics the pathogenesis of anxiety disorders in real world scenarios that involve a single traumatic experience.
completely align with animal studies. A few studies have found the expected generalisation decrement to stimuli that are more dissimilar to the trained value, and some have shown peak shift, supporting the idea that generalisation in humans can be similarity-based (e.g., Wills and Mackintosh, 1998; Livesey and McLaren, 2009). However, the majority of human studies show a linear gradient with the highest responding at the extreme end in the direction opposite to CS- after discrimination training (e.g., LaBerge, 1961; Dunsmoor, Mitrogg, & LaBar, 2009). These increasing linear gradients (and lack of peak shift) cannot be readily predicted and explained by similarity-based associative accounts, suggesting that human generalisation is influenced by additional factors such as relational rules (see Dymond, Dunsmoor, Vervliet, Roche, and Hermans, 2015 for factors that affect fear generalisation in humans). The mixed results in the literature therefore suggest that human generalisation can be either associatively-driven or cognitively driven, or potentially both. Given the mixed findings in human generalisation studies, the current study sought to examine the potential contribution of associative and cognitive processes to generalisation in humans. Recently, Ahmed and Lovibond (submitted [a]) investigated how cognitively inferred rules may affect fear generalisation in humans. In their study, participants first learnt to discriminate the causal status of two circles with different sizes (CS+ and CS-). They were then presented with selected test stimuli along the same stimulus dimension, and expectancy ratings to each stimulus were recorded. An increasing monotonic generalisation gradient was observed, in line with most previous human generalisation studies (e.g., LaBerge, 1961; Dunsmoor et al., 2009). According to the post-experimental questionnaire, a majority of participants reported inferring a linear rule, such as ‘the larger the circle (smaller in the counterbalancing group), the more likely electric shock would be delivered’, which corresponded to the resulting linear generalisation gradient. The results also directly support the idea that the linear gradients obtained in previous human studies (e.g., LaBerge, 1961; Dunsmoor et al., 2009) could be a result of participants entertaining a linear rule. However, most studies that found linear generalisation patterns used an asymmetrical stimulus dimension, which means the magnitude or intensity of one end of the dimension is higher than the other end. For example, Dunsmoor et al. (2009) used facial stimuli with increasing intensity of fear expression; Ahmed and Lovibond (submitted [a]) used circles with increasing size. These asymmetrical stimulus dimensions could potentially induce intensity bias, which encourage the formation and usage of a linear rule. This may limit any potential contribution of associatively-driven generalisation. Hence, in order to minimize the effect of intensity bias, the current study used a symmetrical stimulus dimension developed by Ahmed and Lovibond (submitted [b]). The current study used a differential fear conditioning paradigm, and measured both US expectancy ratings and physiological skin conductance responses. Skin conductance response is a sensitive measure of anticipatory anxiety responses and has been claimed to reflect any underlying associative processes in conditioning tasks (e.g., Esteves, Dimberg, & Öhman, 1994; Tabbert, Stark, Kirsch, & Vatil, 2006; Schultz & Helmstetter, 2010; but see Lovibond & Shanks, 2002). If rule-based generalisation patterns are found in skin conductance that are consistent with participants’ reported rules, it would suggest that fear generalisation in humans is likely to be cognitively-driven. Alternatively, if a similarity-based gradient is observed in skin conductance despite participants reporting
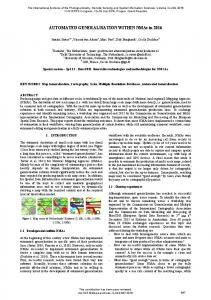
2. Methods 2.1. Participants Undergraduate students were recruited as participants who received either course credit or AUD $15 for participation. A total of 139 participants (86 females) were recruited, with a mean age of 19.3 years (SD = 3.7). 2.2. Apparatus and materials Participants were tested individually in an experimental room. A 43-cm computer monitor was used to present the experimental instructions and stimuli. A computer equipped with MatLab software was located outside the experimental room, which generated the stimuli presented to the participants and recorded the expectancy ratings, while another computer controlled AD Instruments equipment to record the skin conductance data at a sampling rate of 1000/s throughout the experiment. The stimuli were yellow squares [5.5 × 5.5 cms] with black outline containing a black dot varying horizontally from left to right (Fig. 1). The location of the dot was manipulated by an equal distance of 0.5 cm from one stimulus to the next. The stimulus with the black dot in the middle of the square (Stimulus E) always served as the CS+, while Stimulus C served as CS- in the differential conditioning group. Note that the position of CS- was not counterbalanced, since the stimulus dimension was symmetrical and intensity bias was minimized. A red lightning bolt served as the symbolic US. All stimuli and the symbolic US were presented in the centre of a white background on the computer screen. A 0.5-s electric shock (sinusoidal pulse stimulation, 80 Hz) was delivered through electrodes attached to the distal and middle segments of the index finger of participants’ non-dominant hand. Skin conductance electrodes were attached to the distal and proximal segments of the third finger of the same hand. A semicircular dial with a rotary pointer was attached to the table in front of the participants. The dial was labelled Expectancy of SHOCK after figure, with the left position labelled Certain NO SHOCK and the right position labelled Certain Fig. 1. Stimulus dimension. Note that only the differential conditioning group received non-reinforced trials with stimulus C (CS-) during the acquisition phases.
112
Biological Psychology 129 (2017) 111–120
A.H.K. Wong, P.F. Lovibond
The test phase was carried out after the acquisition phase had finished. Similar to acquisition, the test phase was divided into two stages, Test1 and Test2, with the shock electrodes disconnected in the former and reconnected in the latter (see Table 1). The trial structure of the test phase was similar to acquisition, but with the absence of the 2-s feedback period.
Table 1 Design of current study. Phase/Group
Acquisition1
Acquisition2
Test1
Test2
Single-cue conditioning Differential conditioning
CS+ (6)/CS* (2)
CS+ (3)/CS* (1)
GS- (9)
GS- (4)
CS+ (6)/CS* (2) CS- (8)
CS+ (3)/CS* (1) CS- (4)
GS- (9)
GS- (4)
2.3.3. Test1 (shock electrodes disconnected) The program was paused, participants were informed that based on ethical concerns, the shock electrodes would be disconnected again. They were also told that neither symbolic nor physical shock would be delivered, and they were asked to continue making their expectancy ratings, assuming hypothetically that it was still possible for them to receive a shock. This is conceptually equivalent to the ‘missing data procedure’ (e.g., Shanks & Darby, 1998), which is used to minimize the impact of extinction of learning. Test stimuli in conditioning experiments are typically presented without outcomes, in order to prevent new learning. However, this procedure also reduces the level of responding, in particular to stimuli presented late. It may also instigate confusion, prompting participants to modify their response strategy, potentially hiding the real response gradient. The missing data procedure overcomes these limitations. In this stage, all 9 stimuli along the dimension were presented in a randomized order.
Note. + indicates shock presentation, − indicates US omission, * indicates non-reinforced CS+, GSs refers to generalisation stimuli presented in their corresponding test phase, number in brackets indicates the number of trials of that type in each phase.
SHOCK. 2.3. Procedure Participants were randomly allocated to either the single-cue or the differential conditioning group. Shock electrodes and skin conductance electrodes were attached to participants’ fingers, and they were then led through a work-up procedure in which they selected a level of shock that was ‘definitely uncomfortable but not painful’ (Vervliet, Kindt, Vansteenwegen, & Hermans, 2010; Ahmed & Lovibond, 2015). Participants were then taken into the experimental room. The study consisted of an acquisition phase and a test phase (see Table 1). The acquisition phase was divided into two stages, Acquisition1 and Acquisition2. The shock electrodes were disconnected in the former and reconnected in the latter. The reason for administrating electric shock only in Acquisition2 is to minimize habituation to the shock US. The inclusion of Acquisition1 was to increase the number of training trials, in order to facilitate the acquisition of the CS-shock contingency.
2.3.4. Test2 (shock electrodes reconnected) The experimenter reconnected the shock electrodes, and participants were led to believe that it was possible to receive physical shock in this stage, so that skin conductance data referring to test stimuli could be collected. Only 4 selected stimuli (Stimuli C, E, G & I) were presented in Test2 in a randomized order, to minimize extinction. When the conditioning task was completed, participants were asked to fill in a 2-page questionnaire (see Supplementary Material A). On the first page, the experimenter wrote down the expectancy ratings that the individual participant had made to the stimuli at opposite ends of the dimension (i.e., Stimuli A & I) during Test1. Participants were asked to explain why they made these ratings, and to write down in detail any rules/strategies of responding they used. The second page was administered only after the first page was completed, and consisted of 5 statements. Each statement described the relationship between stimuli and shock in terms of different rules (i.e., similarity, linear, no rule and other), and participants were asked to indicate how much they considered the statement to be true on a 1–100 scale, with 1 being false and 100 being true. Participants were told that if none of the statements described their rule-based responding, they should write down their own description in the ‘Other’ section.
2.3.1. Acquisition1 (shock electrodes disconnected) This stage consisted of 8 trials of CS+ in the single-cue conditioning group. The differential conditioning group had the same number of CS + trials, but with an additional 8 trials of CS- presentation. This resulted in a total of 8 and 16 trials in the single-cue and differential conditioning group respectively. CS+ in both conditioning groups was reinforced at 75% and CS- was never reinforced. CS+ was not fully reinforced in order to allow room for a responding to stimuli beyond CS + to be observed, for example a potential rule-based linear gradient, or peak shift in the differential conditioning group. Participants were informed that figures would be presented on the computer screen, which may or may not be followed by a shock; they were asked to learn the relationship between the figures and the shock. Participants were then instructed to use the dial in order to indicate their expectancy of shock whenever a figure appeared on the screen. Participants were also informed that due to ethical issues, the number of shocks was limited, hence setting up the cover story for disconnecting the shock electrodes. Since the shock electrodes were disconnected, participants were told that if a particular stimulus predict shock, a symbolic shock would appear on the screen instead of the physical electric shock. The trial structure was made up by a 10-s baseline period, immediately followed by an 8-s stimulus presentation, and then a 2-s period where feedback (symbolic shock) was either presented or not presented, and an inter-trial interval (ITI) varied between 10 and 21s.
2.4. Scoring and analysis Although US expectancy ratings were recorded in both Test1 and Test2, only those in Test1 were used for data analyses as they covered the whole stimulus dimension. Expectancy ratings made in Test2 (superimposed in Figs. 3–5) were similar to those in Test1, supporting the validity of expectancy data from Test1. Similarly, only skin conductance data from Test2 were analyzed as that was the phase when participants were instructed that they would receive shock, hence allowing anticipatory anxiety to be elicited. A low-pass digital filter was applied to the online skin conductance data at 50 Hz to avoid aliasing. The raw skin conductance data were then log transformed to minimize individual differences. Skin conductance scores for each trial were calculated as the difference between the mean of log skin conductance level (SCL) during the 8-s stimulus presentation and log mean SCL during the 10-s baseline period. For all test data, linear and quadratic trends across the stimulus dimension were analyzed. Linear trend was used to capture any linear gradients, while quadratic trend was used to capture peaked gradients. Furthermore, responding to CS+ was compared to stimulus I in both
2.3.2. Acquisition2 (shock electrodes connected) Immediately after Acquisition1, the experimenter paused the program, and went into the experimental room to reconnect the shock electrodes. Participants were verbally informed that they would be receiving the real shock along with the symbolic shock. Acquisition2 consisted of 4 CS+ trials in both conditioning groups, and an additional 4 CS- trials in the differential conditioning group. Acquisition2 was identical to Acquisition1 in terms of trial structure and reinforcement schedule, except that the electric shock was delivered in the last 0.5 s of symbolic shock presentation. 113
Biological Psychology 129 (2017) 111–120
A.H.K. Wong, P.F. Lovibond
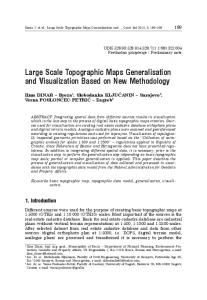
Fig. 2. Mean US expectancy ratings (Left panels) and skin conductance level (Right panels) across acquisition trials. Top row: Single-cue conditioning group; Bottom row: Differential conditioning group. The skin conductance data were collected during Acquisition2.
Fig. 3. Overall US expectancy ratings (Left panels) and skin conductance level (Right panels) in the test phases. Top row: Single-cue conditioning group; Bottom row: Differential conditioning group. Superimposed triangles indicate expectancy ratings in Test2.
114
Biological Psychology 129 (2017) 111–120
A.H.K. Wong, P.F. Lovibond
Fig. 4. US expectancy ratings (Left panels) and skin conductance level (Right panels) in the Similarity subgroup (Top row, n = 19) and No rule subgroup (Bottom row, n = 29) of the Single-cue conditioning group made during test phases. Superimposed triangles indicate expectancy ratings in Test2.
significant linear trend across the acquisition phase, F(1,49) = 41.9, p < 0.05, ηp2 = 0.46. For the differential conditioning group, although the expectancy ratings were initially similar for CS+ and CS-, there was an immediate increase in responses to CS+ trials while ratings to CSdeclined steadily across the acquisition phase. Across the acquisition trials, the average expectancy ratings to CS+ were significantly higher than those to CS-, F(1,49) = 1245.8, p < 0.05, ηp2 = 0.96. The development of differential responding between CS+ and CS- also led to a significant interaction between stimuli and linear trend, F(1,49) = 136.5, p < 0.05, ηp2 = 0.74. Fig. 2B and D show the mean difference in SCL during the last 4 acquisition trials of each type (Acquisition2). In the single-cue conditioning group, the mean skin conductance to CS+ decreased gradually in a linear fashion across trials, F(1,49) = 16.8, p < 0.05, ηp2 = 0.26. For the differential conditioning group, the mean skin conductance to CS+ was significantly larger than that of CS- averaged across trials, F(1,49) = 39.1, p < 0.05, ηp2 = 0.44. This differential responding was found to significantly interact with the linear trend, F (1,49) = 4.2, p < 0.05, ηp2 = 0.079. Broadly speaking, the skin conductance data did not align directly with the expectancy data, as response magnitude to CS+ decreased across trials for both groups. Two factors may account for this difference. The first is habituation of the orienting response (i.e., response triggered by novel stimuli, see Sokolov, 1963) to the CSs. The second is that participants may have become anxious when they were told they were about to receive the first shock, but quickly adapted to the shock, resulting in a heightened SCL on the first reinforced trial, and then the gradual decrease in SCL across acquisition trials.
expectancy and SCL data, in order to capture the responding difference between linear and peaked gradients. Additionally, analysis of a peak shift pattern in expectancy data was tested by comparing responses to stimulus F with the average responses to stimulus G and CS+. Note that in order to test the full range of the stimulus dimension in the skin conductance data (Test2); stimulus G, instead of F, was included, hence the peak shift effect could not be tested in SCL. In order to control family-wise-error rate, Bonferroni-correction was used for expectancy data in the differential conditioning group (α/4 = 0.05/4 = 0.0125) and for the remaining of analyses data (α/3 = 0.05/3 = 0.0167). 3. Results Analyzing generalisation to the test stimuli requires participants to have learned the CS-US contingency in the first place. Hence statistical analyses were restricted to participants who satisfied certain acquisition criteria. For the single cue conditioning group, expectancy ratings to CS + needed to be above 50 averaged over the last 4 trials of acquisition. For the differential conditioning group, differential responding between CS+ and CS- was demonstrated by an average difference of at least 50 in the last 4 acquisition trials. Participants who did not provide US expectancy ratings for two or more stimuli during test were also excluded. Altogether, 25 and 14 participants in the single-cue and differential conditioning group were excluded respectively, leaving 50 participants in each group (62 females; mean age = 19.3, SD = 3.6). The mean shock intensity was 1.6 mA. 3.1. Acquisition phases Fig. 2A and C show the mean US expectancy ratings during the acquisition phase for the single-cue conditioning group and the differential conditioning group respectively. For the single-cue conditioning group, US expectancy ratings to CS+ increased rapidly, resulting in a
3.2. Test phase Analyses suggest that participants in the two conditioning groups differed in their mean generalisation patterns (see Supplementary 115
Biological Psychology 129 (2017) 111–120
A.H.K. Wong, P.F. Lovibond
Fig. 5. US expectancy ratings (Left panels) and skin conductance level (Right panels) in the Similarity subgroup (Top row, n = 21), Linear subgroup (Middle row; n = 20) and the No rule subgroup (Bottom row, n = 9) of the Differential conditioning group made during test phases. Superimposed triangles indicate expectancy ratings in Test2.
trend was observed, F(1,49) = 9.5, p < 0.05/3, ηp2 = 0.15, reflecting the drop-off after the peak at CS+. A significant difference between CS + and stimulus I was also observed, F(1,49) = 14.5, p < 0.05/3, ηp2 = 0.23, confirming the significant drop-off after CS+. Fig. 3C and D show the expectancy gradient and the skin conductance gradient respectively in the differential conditioning group. The expectancy data showed an asymmetrical peaked gradient, with a sharp increase in responding from CS-, reaching the responding peak at CS+, and a drop-off responding after that. The peaked gradient was confirmed by a significant quadratic trend across stimuli, F(1,49) = 64.2, p < 0.05/4, ηp2 = 0.57, and the asymmetry of the gradient was confirmed by a significant linear trend across stimuli, F(1,49) = 81.6, p < 0.05/4, ηp2 = 0.63. Expectancy ratings to CS+ were significantly higher than those to stimulus I, F(1,49) = 64.2, p < 0.05/4, ηp2 = 0.57. No evidence emerged for the peak shift effect; in fact the difference approached significance in the wrong direction, F
Material B for the statistical comparison between conditioning groups). Hence, separate analyses were carried out for each group, and participants were further categorized into sub-groups according to their reported rules in the post-experimental questionnaire, to see whether these subgroups differed in their responses in the test phase. Fig. 3A and B show the generalisation gradients for the US expectancy measure and skin conductance respectively in the single-cue conditioning group. The expectancy gradient showed a peaked gradient, with the highest responding at CS+, and slightly declining responding to both ends. This was supported by a significant quadratic trend, F(1,49) = 48.6, p < 0.05/3, ηp2 = 0.50. Expectancy ratings to CS+ were significantly higher than those to stimulus I, F(1,49) = 98.0, p < 0.05/3, ηp2 = 0.67. The linear trend across stimuli was not statistically significant, F < 1, n.s. A similar pattern of responding was observed in the skin conductance data, but the quadratic trend did not reach significance, F(1,49) = 4.5, n.s. In contrast, a significant linear
116
Biological Psychology 129 (2017) 111–120
A.H.K. Wong, P.F. Lovibond
(1,49) = 7.6, n.s. The skin conductance gradient was relatively flat. Neither the linear nor the quadratic trend across stimuli reached significance (largest F = 1.3, n.s). There was also no substantial difference between CS+ and stimulus I, F(1,49) = 1.6, n.s.
contributed to a significant linear trend across stimuli, F(1,28) = 7.2, p < 0.05/3, ηp2 = 0.21. However, this decline in responding did not result in a significant difference between responding to CS+ and stimulus I, F(1,28) = 4.7, n.s.
3.2.1. Post-experimental questionnaire Two raters, who were blind to the expectancy and skin conductance data, categorized participants into different subgroups according to the inferred rules they reported. This was done by interpreting participants’ self-reported rules from the open-ended question on the first page of the questionnaire (see Supplementary Material A). If participants’ reported rules were ambiguous, they were categorized according to the rule they endorsed most strongly in the second section of the questionnaire. A high level of consensus was observed between the two raters using Cohen’s Kappa (k = 0.80, p < 0.05). Discrepancies between raters’ categorizations were resolved via discussion. In the single-cue conditioning group, 19 participants stated explicitly that they adopted a similarity rule, whereby they expected that stimuli perceptually similar to CS+ would be more likely to predict shock, while those perceptually dissimilar to CS+ would be less likely to predict shock (Similarity subgroup). Twenty-nine participants reported not identifying a clear rule (No rule subgroup), while the remaining 2 participants reported inferring a linear rule, by which they stated that the more the dot was to the left, the less likely it would predict shock; and the more the dot was to the right, the more likely it would predict shock (Linear subgroup). The Linear subgroup was not analyzed due to its insufficient sample size. In the differential conditioning group, 21 participants were classified into the Similarity subgroup; 20 participants were classified into the Linear subgroup, and the remaining 9 participants were classified into the No rule subgroup. Statistical analysis was further conducted to analyze the generalisation gradients of participants in the subgroups across the two conditioning groups.
3.3.3. Interaction effects between similarity and No rule subgroups The generalisation gradient of expectancy ratings in the Similarity subgroup was more peaked than that in the No-rule subgroup, confirmed by a statistically significant interaction between subgroups and quadratic trend across stimuli, F(1,46) = 11.2, p < 0.05/3, ηp2 = 0.20. The same difference was also observed in the skin conductance data, F(1,46) = 8.0, p < 0.05/3, ηp2 = 0.15. Furthermore, the difference between expectancy ratings to CS+ and stimulus I was larger in the Similarity subgroup than that in the No rule subgroup, confirmed by the corresponding interaction effect, F(1,46) = 13.5, p < 0.05/3, ηp2 = 0.23. However, this interaction effect did not carry over to the skin conductance data, F(1,46) = 2.0, n.s. 3.4. Differential conditioning group 3.4.1. Similarity subgroup Fig. 5A and B show the generalisation gradients in US expectancy ratings and skin conductance level for the Similarity subgroup. For the expectancy data, a peaked generalisation gradient was observed, with the greatest responding at CS+ and declining along the stimulus dimension. This pattern was supported by a significant quadratic trend, F (1,20) = 80.3, p < 0.05/4, ηp2 = 0.80. The peaked gradient was also complemented by a significant difference in responding between CS+ and stimulus I, F(1,20) = 134.3, p < 0.05/4, ηp2 = 0.87. A significant linear trend across stimuli was observed, F(1,20) = 26.2, p < 0.05/4, ηp2 = 0.57, presumably because of the slightly asymmetrical gradient, with higher responding to stimuli to the right of CS+ compared to those left of CS+. No evidence emerged for a peak shift effect, as this contrast was significant in the wrong direction, F(1,20) = 9.1, n.s. The skin conductance responding followed a highly similar pattern to the expectancy ratings, showing a peaked gradient with peak responding at CS+. A significant quadratic trend across stimuli was found to support this pattern, F(1,20) = 7.2, p < 0.05/3, ηp2 = 0.29. A significant decrease in responding from CS+ to stimulus I was also observed, confirmed by a significant difference in responding between these two stimuli, F(1,20) = 7.4, p < 0.05/3, ηp2 = 0.27. The linear trend across stimuli was not statistically significant, F(1,20) = 2.1, n.s.
3.3. Single-cue conditioning group 3.3.1. Similarity subgroup Fig. 4A and B show the generalisation gradients in US expectancy ratings and skin conductance level of participants in the Similarity subgroup. A sharp generalisation gradient was observed in the expectancy ratings, with its response peak falling at CS+ and gradually declining responses to stimuli further away from the trained value, forming a peaked gradient. This gradient was statistically supported by a significant quadratic trend, F(1,18) = 55.3, p < 0.05/3, ηp2 = 0.75. Furthermore, responding to CS+ was significantly higher than that to stimulus I, F(1,18) = 129.7, p < 0.05/3, ηp2 = 0.88. No significant linear trend was found across stimuli, F(1,18) = 1.7, n.s. Similar to the expectancy data, the skin conductance data showed a peaked gradient with the highest responding at CS+, supported by a significant quadratic trend, F(1,18) = 11.0, p < 0.05/3, ηp2 = 0.38. The decline of responding away from CS+ was also captured by a significant difference in responding to CS+ and stimulus I, F(1,18) = 10.4, p < 0.05/3, ηp2 = 0.36. No evidence for a linear trend was found, F(1,17) = 1.5, n.s.
3.4.2. Linear subgroup An S-shaped curve was observed in the expectancy data (Fig. 5C), characterised by a sharp increase in responding between CS- and CS+ and a high level of responding to stimuli right of CS+. This pattern was reflected by a significant linear trend across stimuli, F(1,19) = 160.5, p < 0.05/4, ηp2 = 0.894. A significant quadratic trend was also observed, F(1,19) = 19.5, p < 0.05/4, ηp2 = 0.51, presumably due to the higher responding to CS+ than to the stimuli on either side. Neither the peak shift effect nor the difference in responding to CS+ and stimulus I was significant (highest F = 0.37, n.s.). A more obviously linear pattern was observed in the skin conductance data (Fig. 5D), with increased responding across stimuli, supported by a significant linear trend, F(1,19) = 9.4, p < 0.05/3, ηp2 = 0.33. However, responding to stimulus I was not significantly higher than to CS+, F(1,19) = 1.2, n.s. No significant quadratic trend was observed, F < 1, n.s.
3.3.2. No rule subgroup A relatively flat generalisation gradient was observed in the expectancy data in the No rule subgroup (Fig. 4C). However responding to CS+ was higher than all other stimuli, resulting in a significant quadratic trend, F(1,28) = 15.3, p < 0.05/3, ηp2 = 0.35, and a significant difference between responding to CS+ and stimulus I, F(1,28) = 41.8, p < 0.05/3, ηp2 = 0.60. The ‘flatness’ of the gradient was also suggested by a non-significant linear trend across stimuli, F < 1, n.s. The skin conductance data also revealed a flat generalisation gradient (Fig. 4D), with a non-significant quadratic trend across stimuli, F < 1, n.s. The declining responding to stimuli towards the right end
3.4.3. No rule subgroup Participants in the ‘No rule subgroup’ showed US expectancy generalisation pattern broadly similar to the overall differential conditioning group (Fig. 5E). A significant linear trend was observed across stimuli, F(1,8) = 13.1, p < 0.05/4, ηp2 = 0.62, reflecting higher responding to stimuli right of CS+ and lower responding to stimuli 117
Biological Psychology 129 (2017) 111–120
A.H.K. Wong, P.F. Lovibond
expectancy data provided clearer and more interpretable generalisation patterns. The SCL gradients were broadly similar to the expectancy gradients, but with much greater variability, hence resulting in lower statistical power. Both expectancy and SCL data in the single-cue conditioning group showed a peaked overall gradient with the highest responding to CS+. The results aligned with previous animal studies (Guttman & Kalish, 1956; Hoffman & Fleshler, 1961) and with the predictions of associative theories (Blough, 1975; McLaren & Mackintosh, 2002). In contrast, the overall results in the differential conditioning group were not entirely consistent with past animal literature (Hanson, 1959; Friedman & Guttman, 1965) as no peak shift effect was observed in the expectancy data. Neither expectancy nor SCL gradients aligned with the aforementioned human studies that found linear gradients (LaBerge, 1961; Dunsmoor et al., 2009). Nonetheless, the asymmetrical peaked gradients did partially align with some past human studies (Cross & Lane, 1962; Wills & Mackintosh, 1998), which found a lack of decline in responding to one end of the stimulus dimension. Different generalisation patterns were found within both conditioning groups when participants were categorized into subgroups according to their reported inferred rules. The Similarity subgroups in both conditioning groups showed a peaked generalisation gradient in the expectancy data. The expectancy gradient in the Linear subgroup was characterised by the peak responding at stimulus I, and the marked step between CS+ and CS-. SCL data in each subgroup were broadly similar to their corresponding expectancy gradients, except for the No rule subgroup in the differential conditioning group. The overall generalisation gradients could be further broken down into distinctive and more interpretable patterns. Thus the overall gradient in a generalisation experiment may vary in shape as it depends on the relative number of participants in subgroups with qualitatively distinct gradients. This suggests that the overall mean gradient may not be informative, or even misleading. This finding may provide an alternative explanation for past studies that used a differential conditioning paradigm. The asymmetrical peaked gradient found in these studies (e.g., Cross & Lane, 1962), characterised by a lack of decline in responding towards the end of the dimension opposite to CS-, can be understood as a combination of similarity and linear gradients.
around CS-. No other analyses were significant (highest F = 3.9). The skin conductance data in this subgroup showed no clearly defined pattern (Fig. 5F), with a non-significant linear and quadratic trend (Highest F = 2.3, n.s.). Responding to CS+ was higher than that to stimulus I, but this difference did not reach statistical significance, F (1,8) = 7.6, n.s. 3.4.4. Interaction effect between Similarity and Linear subgroups The expectancy gradient in the Linear subgroup was more linear than that in the Similarity subgroup, confirmed by a statistically significant interaction between subgroups and linear trend across stimuli, F(1,39) = 51.8, p < 0.05/4, ηp2 = 0.57. In contrast, the expectancy pattern in the Similarity subgroup was more peaked than that in the Linear subgroup, as shown by the interaction with quadratic trend, F (1,39) = 14.4, p < 0.05/4, ηp2 = 0.27. To further support these interaction effects, differences in responding between CS+ and stimulus I were in different directions, supported by an interaction effect with the rule subgroups, F(1,39) = 64.1, p < 0.05/4, ηp2 = 0.62. Similar interaction effects were found in the skin conductance data. The gradient in the Linear subgroup was more linear than that in the Similarity subgroup, F(1,39) = 9.0, p < 0.05/3, ηp2 = 0.19. Additionally, differences in responding between CS+ and stimulus I went into different directions, confirmed by the corresponding interaction effect, F(1,39) = 7.3, p < 0.05/3, ηp2 = 0.16. Although the skin conductance gradient in the Similarity subgroup was more peaked than that in the Linear subgroup, the interaction between subgroups and quadratic trend across stimuli did not reach significance, F(1,39) = 2.8, n.s. The above analyses suggest that the generalisation gradients were distinctive in the Similarity and Linear subgroup, on both measures. 3.4.5. Interaction effect between rules subgroups and No rule subgroup The expectancy pattern in the Linear subgroup was more linear than that in the No rule subgroup, F(1,27) = 19.7, p < 0.05/4, ηp2 = 0.42. No other interaction effects involving these two subgroups were significant (highest F = 5.1, n.s.). The skin conductance data aligned with the expectancy pattern, with the interaction effect between subgroups and linear trend again being significant, F(1,27) = 6.8, p < 0.05/3, ηp2 = 0.25. No other interaction effects involving these two subgroups were significant (highest F = 2.3, n.s.). For expectancy gradients between Similarity and No rule subgroups, no interactions were significant (highest F = 5.9, n.s.). Similarly, no interaction effects were significant in the SCL data (highest F = 2.0, n.s.). This pattern suggests that there were no clear differences between the SCL gradients in the Similarity and No rule subgroup.
4.1. Theoretical considerations Several of the findings are consistent with the idea that generalisation of conditioned fear in humans is associatively-driven. As predicted by associative accounts, both expectancy and SCL data in the single-cue conditioning group showed a similarity-based gradient. The highest responding fell at CS+, as would be expected by the formation of a strong associative link between CS+ and US (Rescorla & Wagner, 1972). The declining responses to stimuli towards the extreme ends of dimension could reflect low associative strength as stimuli share fewer common elements with CS+ (Blough, 1975; McLaren & Mackintosh, 2002). Other findings in the current study, such as the non-similarity based gradients, suggest the operation of rules. The formation of inferred rules is thought to involve inferential reasoning, which is a higher-level, controlled cognitive process that derives a logical conclusion from the available information (Premack, 1995). In other words, different rules could be formed, depending on factors such as the amount of information available during training. For instance, more participants reported inferred rules in the differential conditioning group than those in the single-cue conditioning group (41–19), presumably because they were exposed to more information whereas those in the single-cue conditioning group only experienced one CS+ during training. Furthermore, the majority of rule users in the single-cue conditioning group formed a similarity rule, which is the most conservative rule one can form when there is only one reinforced stimulus during training. In contrast, participants inferred a wider range of rules in the differential
3.5. Post-hoc analysis The expectancy gradients in both the differential Similarity and No rule subgroups were apparently more asymmetrical than those in the single-cue conditioning group. A post-hoc analysis was carried out by comparing expectancy ratings toward stimuli A, B and C to stimuli G, H and I between the two Similarity and the two No rule subgroups. The interaction effects were significant between the two Similarity subgroups, F(1,38) = 7.2, p < 0.05, ηp2 = 0.16, and also between the two No rule subgroups, F(1,36) = 11.6, p < 0.05, ηp2 = 0.24. This suggests that there was a substantial difference between the symmetry of the gradients across the two Similarity and the two No rule subgroups. This difference was likely to be driven by lower expectancy ratings towards stimuli near stimulus C in the differential subgroups. 4. Discussion By using a symmetrical spatial stimulus dimension, the current experiment aimed to further the understanding of associative and cognitive processes in fear generalisation in humans. Broadly speaking, the 118
Biological Psychology 129 (2017) 111–120
A.H.K. Wong, P.F. Lovibond
expected to run in parallel and independently. Secondly, most of the SCL gradients aligned with their corresponding reported rules and expectancy patterns. Though one may argue that the correspondence between the expectancy and skin conductance gradients in the Similarity subgroup could conceivably be the result of parallel but independent associatively-driven skin conductance responses and cognitively-driven expectancy ratings, the correspondence between both measurements in the Linear subgroup suggests otherwise. Some strict dual-systems accounts (e.g., Clark & Squire, 1998) would predict a dissociation between expectancy and skin conductance measurements whenever participants infer a non-similarity rule such as a linear rule. Instead, the skin conductance data in the Linear subgroup peaked at the extreme end of the dimension, corresponding to the expectancy data, as predicted by the single-system account. Similarly, the dual-systems account would predict a peaked SCL gradient even when participants did not come up with any rules; however, those in the single-cue No rule subgroup showed a relatively flat SCL generalisation pattern, which aligned with the expectancy data. Although the congruence between self-reported rules and generalisation patterns does not contradict the predictions of the dual-system account, it diminishes the potential role of a separate associative system. Furthermore, the alignment between SCL gradients and reported rules also favours the single-system account. As none of the current findings requires the postulation of a separate associative system, parsimony favours the single-system learning model.
conditioning group as they had more available information for rule induction. Despite receiving the same training within each conditioning group, participants inferred a variety of rules, perhaps because of individual differences they brought to the study. Such individual differences could range from motivation, prior history of learning, to personality. For example, participants more motivated to learn could be more engaged in goal-oriented learning, and may be more likely to infer rules (see De Houwer, 2009). In terms of personality, participants more open to experience may be more likely to entertain a rule during test (see Kaufman, 2013). The conditioning groups also differed in terms of the threat level of stimulus C, since it signaled safety in the differential conditioning group but was ambiguous in the single-cue conditioning group. This difference had an impact on the same rule subgroups between conditioning groups. For instance, the expectancy gradient in the differential Similarity and No rule subgroups were slightly asymmetrical compared to the same subgroups in the single-cue conditioning group. This was due to a lower level of responding to stimuli near stimulus C (CS-) in the differential conditioning group. This suggests that participants may have generalised from CS-, resulting in lower responding to stimuli near stimulus C than those right of CS+. Some traditional learning models view skin conductance responses as CRs generated by a low-level, automatic process, which is distinctive from a higher-level, cognitive process reflected by propositional knowledge (Razran, 1955; Squire, 1992). These models, referred to as dual-systems learning models, assume that both processes work in parallel and can dissociate (Clark & Squire, 1998; McLaren et al., 2014). The aforementioned findings suggest that fear generalisation in humans is driven both associatively and cognitively, seemingly consistent with the dual-systems learning models. However, the similarity-based gradient in the single-cue conditioning group is also consistent with the rule-based approach − ratings could derive from a rule based on perceptual similarity, leading to a peaked gradient too. Strong evidence in favour of this interpretation is the finding that the generalisation gradients in the Similarity subgroup were more peaked than those in the No rule subgroup, suggesting that the peakedness of the overall gradient in the single-cue conditioning group was driven by the similarity rule users. Additionally, the reported linear rule in the differential conditioning group aligned with the generalisation gradients in the Linear subgroup, which is also consistent with the rule-based approach. These findings lead to the consideration of an alternative, singlesystem learning model. This model proposes that both online self-reported ratings and CRs are the product of expectancies derived from propositional knowledge of the CS-US contingency (De Houwer & Beckers, 2002; Lovibond, 2003; Mitchell, DeHouwer, & Lovibond, 2009). Most findings in the current study can be explained in terms of the single-system learning model. Firstly, the distinctive gradients in different rule subgroups were consistent with the participants’ self-reported rules. For instance, participants who reported responding based on perceptual similarity formed peaked gradients, while those who reported inferring a linear rule showed their highest responding to one end of the dimension. Even expectancy ratings to test stimuli (except CS+) in the single-cue No rule subgroup were approximately at chance level, which was consistent with participants’ report of merely guessing the shock predictiveness of test stimuli. One apparent exception to the congruence between verbal rule report and observed gradients is the No rule subgroup in the differential conditioning group. This subgroup showed an asymmetrical peaked expectancy gradients, perhaps because participants had good memory of the CS+ and CS-, but were uncertain about the rest of the test stimuli. Nonetheless, the overall alignment between participants’ reported rules and the generalisation gradients is highly consistent with a singlesystem learning model and with Ahmed and Lovibond’s studies (submitted [a], submitted [b]). By contrast, dual-systems learning models (e.g., Clark & Squire, 1998) do not strongly anticipate the congruence between reported rules and generalisation gradients, since they are
4.2. Limitations The current study does have its limitations. Peak shift was not tested in the skin conductance data since stimulus F was not tested. One may argue that peak shift effect could have occurred in skin conductance if it was included in Test2. However, considering that such an effect was not observed in the expectancy data, including stimulus closer to CS+ in Test2 may not have revealed peak shift. Secondly, the number of participants in each rule subgroup could not be controlled. The variability in the number of participants between each subgroup may affect the statistical power, and certain subgroups were not able to be analyzed due to insufficient sample size (i.e., Linear subgroup in single-cue conditioning group). Thirdly, one may argue that asking participants to make expectancy ratings promoted a rule-based approach, and thereby impacted the nature of conditioning. There is little evidence in the literature to directly address this question. Hilgard, Campbell, and Sears (1937) examined the development of discrimination between CS+ and CS-, using an eyeblink conditioning paradigm. Participants in one group were asked to verbally report what stimuli were presented and how they responded to them immediately after each trial, while the other group were not asked for the online verbal report. The authors reported that both groups showed a similar level of conditioned discrimination. Given the similarity between online verbal report and expectancy ratings, this finding suggests that expectancy ratings have little impact on the nature of conditioning. Future studies examining the potential effect of expectancy ratings on conditioning would be valuable. Finally, having a single test trial for each stimulus may have reduced power for the skin conductance measure. However our past research has shown that participants often respond to subsequent test trials on the basis of the outcome to the initial test trials, rather than the acquisition trials. In addition, we were concerned that multiple test trials would promote generalised extinction and encourage participants to abandon any rules they had already formed. 4.3. Conclusions In conclusion, the present study sought to further our understanding of the underlying mechanisms of human fear generalisation by using both single-cue and differential conditioning paradigms. The finding of distinctive generalisation gradients in each rule-based subgroup and the 119
Biological Psychology 129 (2017) 111–120
A.H.K. Wong, P.F. Lovibond
Hull, C. L. (1934a). The concept of the habit-family hierarchy and maze learning: Part I. Psychological Review, 41, 33–54. http://dx.doi.org/10.1037/h0070758. Hull, C. L. (1934b). The concept of the habit-family hierarchy and maze learning: Part II. Psychological Review, 41, 134–152. http://dx.doi.org/10.1037/h0072855. Jenkins, H. M., & Harrison, R. H. (1960). Effect of discrimination training on auditory generalization. Journal of Experimental Psychology, 59(4), 246–253. http://dx.doi. org/10.1037/h0041551. Kaufman, S. C. (2013). Opening up openness to experience: A four-factor model and relations to creative achievement in the arts and sciences. The Journal of Creative Behavior, 47(4), 233–255. http://dx.doi.org/10.1002/jocb.33. LaBerge, D. (1961). Generalization gradients in a discrimination situation. Journal of Experimental Psychology, 62(1), 88–94. http://dx.doi.org/10.1037/h0043035. Lissek, S., & Grillon, C. (2010). Overgeneralization of conditioned fear in the anxiety disorders: putative memorial mechanisms. Journal of Psychology, 218(2), 146–148. http://dx.doi.org/10.1027/0044-3409/a000022. Lissek, S., Powers, A. S., McClure, E. B., Phelps, E. A., Woldenhawariat, G., Grillon, C., et al. (2005). Classical fear conditioning in the anxiety disorders: a meta- analysis. Behaviour Research and Therapy, 43(11), 1391–1424. http://dx.doi.org/10.1016/j. brat.2004.10.007. Lissek, S., Rabin, S., Heller, R. E., Lukenbaugh, D., Geraci, M., Pine, D. S., et al. (2010). Overgeneralization of conditioned fear as a pathogenic marker of panic disorder. The American Journal of Psychiatry, 167(1), 47–55. http://dx.doi.org/10.1176/appi.ajp. 2009.09030410. Lissek, S., Kaczkurkin, A. N., Rabin, S., Geraci, M., Pine, D. S., & Grillon, C. (2014). Generalized anxiety disorder is associated with overgeneralization of classically conditioned fear. Biological Psychiatry, 75(11), 909–915. http://dx.doi.org/10.1016/ j.biopsych.2013.07.025. Livesey, E. J., & McLaren, I. P. L. (2009). Discimination and generalization along a simple dimension: Peak shift and rule-governed responding. Journal of Experimental Psychology: Animal Behavior Processes, 35, 554–565. http://dx.doi.org/10.1037/ a0015524. Lovibond, P. F., & Shanks, D. R. (2002). The role of awareness in Pavlovian conditioning: empirical evidence and theoretical implications. Journal of Experimental Psychology: Animal Behavior Processes, 28(1), 3–26. http://dx.doi.org/10.1037/0097-7403.28. 1.3. Lovibond, P. F. (2003). Causal beliefs and conditioned responses: Retrospective revaluation induced by experience and by instruction. Journal of Experimental Psychology: Learning, Memory, and Cognition, 29, 97–106. http://dx.doi.org/10.1037/ 0278-7393.29.1.97. McLaren, I. P., & Mackintosh, N. J. (2002). Associative learning and elemental representation: II. Generalization and discrimination. Animal Learning and Behavior, 30(3), 177–200. http://dx.doi.org/10.3758/BF03192828. McLaren, I. P. L., Forrest, C. L. D., McLaren, R. P., Jones, F. W., Aitken, M. R. F., & Mackintosh, N. J. (2014). Associations and propositions: the case for a dual-process account of learning in humans. Neurobiology of Learning and Memory, 108, 185–195. http://dx.doi.org/10.1016/j.nlm.2013.09.014. Mitchell, C. J., DeHouwer, J., & Lovibond, P. F. (2009). The propositional nature of human associative learning. Behavioral and Brain Sciences, 32, 189–246. http://dx. doi.org/10.1017/S0140525x09000855. Pavlov, I. P. (1927). Conditioned reflexes: An investigation of the physiological activity of the cerebral cortex. Oxford: Oxford University Press. Premack, D. (1995). Cause/induced motion; intention/spontaneous motion. In J. P. Changeux, & J. Chavaillon (Eds.). Origins of the human brain (pp. 286–308). Oxford: Oxford University Press. Razran, G. (1955). Conditioning and perception. Psychological Review, 62(2), 83–95. http://dx.doi.org/10.1037/h0046875. Rescorla, R. A., & Wagner, A. R. (1972). A theory of Pavlovian conditioning: variations in the effectiveness of reinforcement and non-reinforcement. In A. H. Black, & W. F. Prokasy (Eds.). Classical conditioning II: Current research and theory (pp. 64–99). New York: Appleton-Century-Crofts. Schultz, D. H., & Helmstetter, F. J. (2010). Classical conditioning of autonomic fear responses is independent of contingency awareness. Journal of Experimental Psychology, 36(4), 495–500. http://dx.doi.org/10.1037/a0020263. Shanks, D. R., & Darby, R. J. (1998). Feature- and rule-based generalization in human associative learning. Journal of Experimental Psychology: Animal Behavior Processes, 24(4), 405–415. http://dx.doi.org/10.1037/0097-7403.24.4.405. Sokolov, E. N. (1963). Perception and the conditioned reflex. New York: Pergamon Press. Squire, L. R. (1992). Declarative and nondeclarative memory: Multiple brain systems supporting learning and memory. Journal of Cognitive Neuroscience, 4(3), 232–246. http://dx.doi.org/10.1162/jocn.1992.4.3.232. Tabbert, K., Stark, R., Kirsch, R., & Vatil, D. (2006). Dissociation of neural responses and skin conductance reactions during fear conditioning with and without awareness of stimulus contingencies. Neuroimage, 32(2), 761–770. http://dx.doi.org/10.1016/j. neuroimage.2006.03.038. Vervliet, B., Kindt, M., Vansteenwegen, D., & Hermans, D. (2010). Fear generalization in humans: impact of verbal instructions. Behaviour Research and Therapy, 48, 38–43. http://dx.doi.org/10.1016/j.brat.2009.09.005. Wheeler, D. S., Amundson, J. C., & Miller, R. R. (2006). Generalization decrement in human contingency learning. The Quarterly Journal of Experimental Psychology, 59(7), 1212–1223. http://dx.doi.org/10.1080/17470210600576342. Wills, S., & Mackintosh, N. J. (1998). Peak shift on an artificial dimension. Quarterly Journal of Experimental Psychology Section B: Comparative and Physiological Psychology, 51, 1–32. http://dx.doi.org/10.1080/713932669.
strong correspondence between generalisation patterns and self-reported rules suggest that fear generalisation in humans is mainly cognitively-driven. The alignment between expectancy and skin conductance gradients is also consistent with the single-system propositional model, which provides a parsimonious account of the current data. The current findings have potential clinical applications to anxiety disorders that involve excessive generalisation of fear, such as PTSD (Lissek et al., 2005). They suggest that identifying and modifying maladaptive beliefs of patients may more effectively reduce fear and its generalisation. Acknowledgements The study was funded in part by a Discovery Project from the Australian Research Council(DP160101907) awarded to Prof. Peter F. Lovibond. Appendix A. Supplementary data Supplementary data associated with this article can be found, in the online version, at http://dx.doi.org/10.1016/j.biopsycho.2017.08.056. References Ahmed, O., & Lovibond, P. F. (2015). The impact of instructions on generalization of conditioned fear in humans. Behavior Therapy, 46(5), 597–603. http://dx.doi.org/10. 1016/j.beth.2014.12.007. Ahmed, O., & Lovibond, P. F. (2017a). Rule-based processes in generalisation and peak shift in human fear conditioning. (submitted [a]). Ahmed, O., & Lovibond, P. F. (2017b). The influence of inferred rules on generalization in human predictive learning. (submitted [b]). Baron, A. (1973). Postdiscrimination gradients of human subjects on a tone continuum. Journal of Experimental Psychology, 101(2), 337–342. http://dx.doi.org/10.1037/ h0035206. Blough, D. S. (1975). Steady state and a quantitative model of operant generalization and discrimination. Journal of Experimental Psychology: Animal Behavior Processes, 1(1), 3–21. http://dx.doi.org/10.1037/0097-7403.1.1.3. Clark, R. E., & Squire, L. R. (1998). Classical conditioning and brain systems: The role of awareness. Science, 280, 77–81. http://dx.doi.org/10.1016/S1364-6613(02)02041-7. Cross, D. V., & Lane, H. L. (1962). On the discriminative control of concurrent responses: The relations among response frequency, latency, and topography in auditory generalization. Journal of Experimental Analysis of Behaviour, 5, 487–496. http://dx.doi. org/10.1901/jeab.1962.5-487. De Houwer, J., & Beckers, T. (2002). A review of recent developments in research and theories on human contingency learning. The Quarterly Journal of Experimental Psychology B: Comparative and Physiological Psychology, 55B, 289–310. http://dx.doi. org/10.1080/02724990244000034. De Houwer, J. (2009). The propositional approach to associative learning as an alternative for association formation models. Learning & Behavior, 37(1), 1–20. http://dx. doi.org/10.3758/LB.37.1.1. Dunsmoor, J. E., Mitrogg, S. R., & LaBar, K. S. (2009). Generalization of conditioned fear along a dimension of increasing fear intensity. Learning & Memory, 16, 460–469. http://dx.doi.org/10.1101/lm.1431609. Dymond, S., Dunsmoor, J. E., Vervliet, B., Roche, B., & Hermans, D. (2015). Fear generalization in humans: systematic review and implications for anxiety disorder research. Behavior Therapy, 46, 561–582. http://dx.doi.org/10.1016/j.beth.2014.10. 001. Esteves, F., Dimberg, U., & Öhman, A. (1994). Automatically elicited fear: Conditioned skin conductance responses to masked facial expressions. Cognition and Emotion, 8(5), 393–413. http://dx.doi.org/10.1080/02699939408408949. Friedman, H., & Guttman, N. (1965). A further analysis of effects of discrimination training on stimulus generalization gradients. In D. I. Mostofsky (Ed.). Stimulus generalization (pp. 255–267). Standford: Stanford University Press. Guttman, N., & Kalish, H. I. (1956). Discriminability and stimulus generalization. Journal of Experimental Psychology, 51, 79–88. http://dx.doi.org/10.1037/h0046219. Hanson, H. M. (1959). Effects of discrimination training on stimulus generalization. Journal of Experimental Psychology, 58(5), 321–334. http://dx.doi.org/10.1037/ h0042606. Hilgard, E. R., Campbell, A. A., & Sears, W. N. (1937). Conditioned discrimination: The development of discrimination with and without verbal report. The American Journal of Psychology, 49(4), 564–580. http://dx.doi.org/10.2037/1416381. Hoffman, H. S., & Fleshler, M. (1961). Stimulus factors in aversive controls: The generalization of conditioned suppression. Journal of the Experimental Analysis of Behavior, 8, 89–96. http://dx.doi.org/10.1901/jeab.1961.4-371. Honig, W. K., & Urcuioli, P. J. (1981). The legacy of Guttman and Kalish (1956): Twentyfive years of research on stimulus generalization. Journal of the Experimental Analysis of Behaviour, 36(3), 405–445. http://dx.doi.org/10.1901/jeab.1981.36-405.
120