Supporting information for
Exploring aeration-associated energy savings at a conventional water reclamation plant Jun-Jie Zhu*; Paul R. Anderson Department of Civil, Architectural and Environmental Engineering, Illinois Institute of Technology, Chicago, IL 60616-3793, USA. *Corresponding author; email:
[email protected]
Summary Number of pages Number of figures Number of tables
22 12 5
Content 1. Historical flow pattern 2. Influent concentrations during storm flows 3. Simple two-level factorial analysis of influent concentrations 4. Confidence in the model 5. Steady-state simulation in standard operating conditions 6. D.O. field measurement 7. Analysis of the importance of typical effluent variables 8. A.B. concentration profile along the aeration tank during a 4.4 m3/s storm event 9. Response of effluent D.O. and ammonia in high probability storm events 10. A simple example of comparing the effect of flow patterns on aeration savings
S1
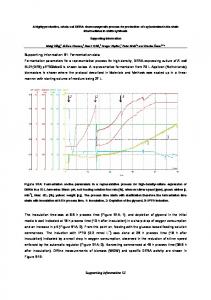
1. Historical flow pattern Tunnel and reservoir plan (TARP) operations create a unique step-shape flow pattern at MWRDGC WRPs. Each storm event, defined by its initial and final local minimum flow values, was characterized by its event duration (elapsed time between initial and final local minimum flow values), peak duration (elapsed time during peak flow), and amplitude (ratio of peak flowrate to initial minimum flow) (Figure S1(a)). A total of 222 storm events were found based on eight months of historical flow data (hourly data, n = 5850) at the Stickney WRP. Event duration and peak duration times ranged from 2 to 105 h (17.0 h average and 14.8 h standard deviation (SD)) and from 0.5 to 51 h (6.3 h average and 6.7 h SD), respectively; the average (dimensionless) amplitude was 1.6 and the maximum amplitude was 6.0 (Figure S1(b)). Because storm flows with higher amplitude have shorter duration and peak times, it is unlikely that the maximum values of these parameters occur simultaneously. Therefore, third-quartile values from the distribution for each of these variables were used to represent challenging storm flows, resulting in characteristic event duration and peak duration times of 22 h and 8 h, respectively, and characteristic amplitude of 1.7. To investigate the effect of flow magnitude on the WRP process, the amplitude was adjusted (1.3 – 4.0) to represent the variety of storm flows (2.6 – 5.3 m3/s) observed at the Calumet WRP.
S2
Figure S1. (a) Typical hourly flow change in the Stickney WRP (May 1, 2012 ~ May 4, 2012) (MWRDGC 2012a). (b) Flow pattern at the Stickney WRP based on eight months of hourly flow data (MWRDGC 2012a). Box plots of three major parameters (event duration, peak duration, and amplitude) and their data distributions. S3
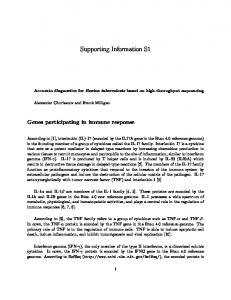
2. Influent concentrations during storm flows Influent concentrations (CBOD5, TKN, SS, NH3-N/TKN, and VSS/SS) required for WRP simulations were estimated based on their relationships with flowrate. To assess average and more challenging conditions, two respective groups of correlations (high probability and low probability) were developed from historical data. For example, influent TKN concentrations in average conditions (high probability) were estimated from correlations between historical flowrate data and corresponding TKN data (Figure S2(a)). This approach was applied to other influent variables (Table S1); although R2 values for these correlations were low (especially SS and NH3-N/TKN), they provided relationships needed to describe how the concentrations changed as a function of flow and to avoid negative input values to the GPS-X model. A subset of data was retained to develop correlations for more challenging conditions. This subset included higher TKN, higher CBOD5, and lower SS data (relative to their predicted mean) (Figure 2); more description is provided in the next section. For example, the correlation based on the subset of data was used to estimate influent TKN concentration in challenging conditions (low probability) (Figure S2(b)). Similarly, this approach was applied to other influent variables (Table S2).
S4
Figure S2. The relationship between influent (primary effluent) TKN concentration and flow at the Calumet WRP (battery E2) based on (a) all historical data from 2002 to 2011 (MWRDGC 2013a) that represents high probability and typical scenarios or (b) subset of data that represents low probability but extreme scenarios. Table S1. Regression relationships between influent variables and flow based on all data (MWRDGC 2013a). Regression equation
R2
TKN = 34.2 × exp(-0.231 × Flow)
0.46
CBOD5 = 109.8 × exp(-0.237 × Flow)
0.44
SS = 84.4 × exp(-0.047 × Flow)
0.01
VSS/SS = 0.8 × exp(-0.060 × Flow)
0.20
NH3-N/TKN = 0.6 × exp(-0.042 × Flow)
0.06
Table S2. Regression relationships between influent variables and flow based on a subset of data that represent low probability but extreme scenarios. Regression equation
R2
TKN = 39.3 × exp(-0.219 × Flow)
0.71
CBOD5 = 134.8 × exp(-0.243 × Flow)
0.79
SS = 72.3 × exp(-0.064 × Flow)
0.16
VSS/SS = 0.8 × exp(-0.045 × Flow)
0.14
NH3-N/TKN = 0.6 × exp(-0.037 × Flow)
0.06
S5
3. Simple two-level factorial analysis of influent concentrations The objective of the two-level factorial analysis was to determine the combination of influent concentrations that was responsible for the lowest effluent quality. In this factorial analysis, the values of low (code, -1) and high (+1) levels were “average – SD” and “average + SD” values for each influent variable, respectively (Table S3); the effluent quality was evaluated based on effluent D.O. concentration because D.O. is the limiting parameter with respect to permit requirements and aeration saving (Figure S8, upcoming section). The analysis showed that a combination of high-level TKN and CBOD5 concentrations and low-level SS concentration (combination 4) would result in relatively lower effluent quality (Table S4).
Table S3. Concentrations of low and high levels for influent SS, CBOD5, and TKN Level
Code
Low
-1
High
+1
SS
CBOD5
TKN
mg/L
mg O2/L
mg N/L
58.3
50.9
15.9
110.4
74.4
23.4
Table S4. Effluent D.O. concentrations in eight combinations of three influent variables Combination
SS
CBOD5
TKN
D.O. (mg/L)
1
-1
-1
-1
8.37
2
-1
-1
+1
7.89
3
-1
+1
-1
7.45
4
-1
+1
+1
6.94
5
+1
-1
-1
8.94
6
+1
-1
+1
8.53
7
+1
+1
-1
8.04
8
+1
+1
+1
7.57
S6
4. Confidence in the model The WRP process model was calibrated using data from the most common “steady-state” scenario; data from the other seven scenarios were used to assess the model. Based on an initial sensitivity analysis, we identified seven parameters that had the greatest effect on the calibration process and these values were adjusted during the calibration process (Zhu 2015). The calibrated model exhibits a much better prediction relative to the default model in the standard conditions (Figure S3). Specifically, the default model significantly underestimated three process variables (normalized errors < -33%) and the effluent CBOD5 (≈ -27%), and significantly overestimated the F/M ratio (≈ 75%) and the effluent ammonia (≈ 77%). Normalized errors of all variables were within a range from -10% to 7% in the calibrated model.
Figure S3. Normalized errors for predicted (a) process variables and (b) effluent variables for default and calibrated models.
S7
The calibrated values of seven parameters from the standard conditions (group 3) were subsequently applied to other seven scenarios. Meanwhile, influent data and operating conditions of these seven scenarios were adjusted based on their corresponding historical data (Table S5). It is interesting that influent SS and TKN concentrations are higher in higher temperature scenarios, regardless of dry (groups 4 > 3 > 2) or wet (groups 8 > 7 > 6) weather conditions; and these high influent concentrations may be responsible for higher aeration consumptions in groups 4 and 8. Verification of the calibrated values at the other seven groups shows a promising improvement in terms of typical process and effluent variables (Figure S4). In general, MLSS, F/M ratio, RAS SS, and effluent CBOD5 have significant corrections; effluent NH3-N has a slight improvement; and effluent SS almost remains the same. Specifically, simulated RAS SS and effluent CBOD5 concentrations based on calibrated values tightly surround the diagonal line; simulated MLSS concentrations based on calibrated values are slightly noisier. Simulated F/M ratios based on the default model are apparently overestimated, whereas the calibrated model provides a promising prediction of these ratios. Groups 1 and 5 provide slightly worse predictions for effluent NH3-N, but all other groups yield better results. All these results suggest that calibration was successful and the model yields credible results.
S8
Table S5. Average values of influent and process variables used in the GPS-X model of the MWRD Calumet plant for each of the eight “steady-state” groups. Group Variable
Unit 1
Count
days
Flow Water temperature
Influent
m3/s o
98 1.66
2
3
4
5
650
1220
251
32
2.79
2.29
2.67
1.84
6 483 3.14
7
8
670
146
2.73
3.21
C
17.4
7.7
16.8
24.4
17.9
7.7
16.4
23.7
SS
mg/L
91.7
70.0
82.5
113.9
102.4
74.3
93.0
121.0
CBOD5
mg O2/L
66.1
58.4
67.8
67.4
55.9
55.8
64.0
62.8
TKN
mg N/L
24.1
17.1
21.3
24.7
24.1
16.7
19.6
22.4
VSS/SS
0.74
0.69
0.67
0.64
0.70
0.68
0.65
0.65
0.55
0.55
0.55
0.49
0.52
0.53
0.53
0.47
NH3-N/TKN Aeration RAS flow Process
m3/s m3/s
WAS flow SVI
L/mg
14.9
12.6
13.9
18.8
15.0
12.8
13.7
18.5
2.32
2.62
2.25
2.32
2.03
2.56
2.18
2.33
0.04
0.03
0.04
0.05
0.03
0.03
0.03
0.05
63.7
47.7
54.0
S9
56.0
64.5
48.2
52.6
54.5
Figure S4. Measured typical process and effluent variables at the eight steady-state groups, and their simulated values based on default and calibrated models. S10
5. Steady-state simulation in standard operating conditions In the standard operating conditions and at the typical aeration rate, the NH3-N profile rapidly decreases with increasing length of tank and reaches to about zero in about 40% of total length of the tank (Figure S5). Meanwhile, D.O. remains over low levels at the first 20% of tank; as the majority of NH3-N is biodegraded throughout the nitrification process, D.O. quickly increases to about 7 mg O2/L before 50% of the length of the tank; there is little subsequent change as the D.O. is approaching saturation. The strictest NH3-N limit (2.5 mg N/L) and D.O. requirement (4 mg O2/L) are achieved in about 20% and 35% of the total length of the tank, respectively.
Figure S5. Simulated ammonia and D.O. concentration profiles along the aeration tank for standard operating conditions (total length of tank = 129.5 m).
S11
6. D.O. field measurement To get a better understanding of conditions in the aeration tank, field measurements were collected to determine the D.O. profile along the tank. Five D.O. sensor probes (WTW 2011) were attached to a three-pipe support system (Figure S6) so that three probes were submerged about 1.2 m, and two probes were submerged about 2.7 m. Measurements were recorded after a 20 min warm up. D.O. measurements were collected at nine locations along the aeration tank. A single measurement required one minute of monitoring; ten replicate measurements were obtained at each location. Measurements were collected on Sep. 6, 2013, when the facility was operating under dry-weather conditions, influent characteristics were relatively constant, and the water temperature was 22.0 ± 0.1oC. These D.O. profiles should represent the steady-state condition in characteristic group 4. According to the manufacturer (WTW 2011), D.O. sensors were calibrated at the factory and the sensor cap should help to keep the sensors stable for the specified service life of measuring. To confirm this condition, an additional test of measuring the oxygen concentration at two centimeters above an air-saturated water surface, was performed and suggested that these five sensors remained calibrated. Field measurements reveal a similar pattern for the D.O. profile simulated with the model (Figure S7). The simulation is in good agreement with the field measurements, and the D.O. concentration exceeds 4 mg/L after about 35% of the length. Furthermore, the final D.O. concentrations measured (7.4 mg O2/L), simulated (7.6), and reported by MWRDGC (7.5) are all in good agreement.
S12
Figure S6. D.O. measurement system. Top is its layout in cross section, bottom is a photograph from the field test.
S13
Figure S7. D.O. concentration profile (includes mean ±standard deviation) measured on Sep 6, 2013 (total length of tank = 129.5 m), compared with result of model simulation and MWRDGC record of the final D.O. concentration.
S14
7. Analysis of the importance of typical effluent variables The relative difference between concentrations of the three effluent variables (ammonia, CBOD5, and D.O.) and their corresponding strictest permit requirements (MWRDGC 2013b), denoted as relative margin (RM), were used to measure their importance with respect to permit requirements and aeration rate. Bigger positive RM values represent higher effluent quality, whereas negative RM values represent lower effluent quality relative to permit requirements; and a zero RM value means an equal value of effluent concentration and permit requirement.
𝑅𝑀(𝑎𝑚𝑚𝑜𝑛𝑖𝑎 𝑜𝑟 𝐶𝐵𝑂𝐷5 ) = 𝑅𝑀(𝐷. 𝑂) =
𝐿𝑖𝑚𝑖𝑡 − 𝑚𝑎𝑥𝑖𝑚𝑢𝑚 𝑒𝑓𝑓𝑙𝑢𝑒𝑛𝑡 𝑐𝑜𝑛𝑐𝑒𝑛𝑡𝑟𝑎𝑡𝑖𝑜𝑛 𝐿𝑖𝑚𝑖𝑡
𝑀𝑖𝑛𝑖𝑚𝑢𝑚 𝑒𝑓𝑓𝑙𝑢𝑒𝑛𝑡 𝑐𝑜𝑛𝑐𝑒𝑛𝑡𝑟𝑎𝑡𝑖𝑜𝑛 − 𝑟𝑒𝑞𝑢𝑖𝑟𝑒𝑚𝑒𝑛𝑡 𝑅𝑒𝑞𝑢𝑖𝑟𝑒𝑚𝑒𝑛𝑡
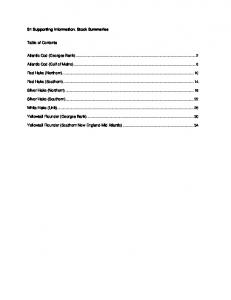
Different magnitudes of storm flows exhibit similar patterns with only slight changes of critical intersection points (RM = 0) (Figure S8). In general, D.O. is the variable most sensitive to the aeration rate and it leads to the greatest concern about permit violations; followed by ammonia and CBOD5. For example, the D.O. just meets the permit requirement (RM = 0) when the aeration is about 7.3 m3/s (about 50% of the standard aeration rate) in the 4.4 m3/s storm event. Effluent ammonia concentrations start to become sensitive to the aeration rate once it has been decreased to 5.9 m3/s, and the concentration meets its limit at about 3.9 m3/s (about 28% of current aeration rate). The CBOD5 is initially close to its permit limit (RM ≈ 60%), but it is always well below the limit even when the aeration rate has been decreased to about 2.7 m3/s. Importantly, the D.O. is always the limiting variable in different storm events with respect to aeration rate; its critical intersection points are about at aeration rate of 6.8, 7.0, 7.3, and 7.6 m3/s
S15
in 2.6, 3.5, 4.4, and 5.3 m3/s storm flows, respectively. Therefore, the effluent D.O. concentration is the critical indicator for an investigation of aeration savings.
Figure S8. Relative margin (RM, %) of effluent D.O., ammonia, CBOD5 to aeration rate during the simulated 2.6, 3.5, 4.4, and 5.3 m3/s storm events.
S16
8. A.B. concentration profile along the aeration tank during a 4.4 m3/s storm event A.B. concentration immediately decreases when the storm flow initially increases rapidly; in general, A.B. concentration does not start to recover until about 35 h and does not return to its original concentration (Figure S9(a) and (b)). The black curves in Figure S9(a) and (b) show respective A.B. concentration profiles along the aeration tank at different times. As the storm flow progresses through the tank, the profile pattern changes. The concentration is low in the beginning of the tank (“head”) but it initially remains at the original value in the end of the tank (“tail”). About four hour later, the concentration at the tail is also quickly depressed, suggesting that microorganisms were significantly washed out. When the main storm flow passed away at about 40 h, several peaks can be found in the time-series from the head to the tail, indicating the replenishment of A.B. from the return sludge flow. This information can also be interpreted from a contour plot (Figure S9(c)), where much clearer concentration patterns can be visualized. The distribution of one color (A.B. concentration) shows the movement of a wastewater wave (i.e. plug flow) along the tank; a right-side inclination suggests that the wave is pushed from the head to the tail as the time increases. The circles (at about 36 h and 42 h) show the responses of A.B. concentration to reductions in flowrate during the later part of the storm flow.
S17
Figure S9. Autotrophic biomass (A.B.) concentration profile contour in the aeration tank during a 4.4 m3/s high probability storm event (total length of tank = 129.5 m). (a) and (b) are the same three dimension A.B. profile but from two angles; (c) contour plot of A.B. profile.
S18
9. Response of effluent D.O. and ammonia in high probability storm events The response of effluent D.O. and ammonia to different storm events is shown in Figure S10. At about 30 h into the perturbation, the effluent D.O. concentration increases and the system gradually recovers after about 50 h. The larger the magnitude of the perturbation, the greater the increase in D.O. and the longer it takes the process to recover. The effluent ammonia concentration exhibits almost a mirror-image response through the perturbation. Storm flow causes lower D.O. concentration and a small ammonia concentration peak at around 27 h, probably because the increase in flow essentially short-circuits the treatment process, so the wastewater leaves the aeration tank before it has been treated sufficiently.
Figure S10. Response of effluent D.O. and ammonia to 2.6, 3.5, 4.4, and 5.3 m3/s high probability storm events at a typical aeration rate.
S19
10. A simple example of comparing the effect of flow patterns on aeration savings As long as the TARP can help transform the current flow pattern (an example of a 4.4 m3/s storm event adds about 190000 m3 water) to a relatively “smooth” (step-by-step) controlled pattern (Figure S11), more RM can be realized at the same aeration rate (Figure S12). When the aeration rate is high (> 12 m3/s), the testing flow pattern has little effect on the effluent quality. However, this situation is significantly changed when the aeration rate is below 10 m3/s. To satisfy the effluent D.O. requirement, the minimum aeration rate under the controlled flow pattern is about 6.9 m3/s, lower than the rate (≈ 7.3 m3/s) under the current flow pattern. The controlled pattern illustrated here is an example; even greater aeration savings could be possible with an “optimum” flow pattern.
Figure S11. Current and controlled (as an example) challenging flow patterns for a 4.4 m3/s storm event (additional 190000 m3 water).
S20
Figure S12. Relative margin (RM, %) of effluent D.O. to aeration rate during current and controlled challenging flow patterns for a 4.4 m3/s storm event.
S21
REFERENCES MWRDGC. 2012a Raw hourly flow data in the Stickney WRP from October to December, 2011, and from May to August, 2012 was provided by the Metropolitan Water reclamation District of Greater Chicago. MWRDGC. 2013a Raw data from 2002 to 2011 of the Calumet WRP were provided by the Metropolitan Water reclamation District of Greater Chicago. MWRDGC. 2013b A document of “Calumet physical plant data” was provided by the Metropolitan Water Reclamation District of Greater Chicago. Zhu, J.-J. 2015 Cyber-physical system for a water reclamation plant: Balancing aeration, energy, and water quality to maintain process resilience. Ph.D. Dissertation, Illinois Institute of Technology, Chicago, IL. ProQuest/UMI. Publication Number: AAT 3733990; ISBN: 9781339224329. WTW. 2011 Optical IQ sensor net D.O. sensor, model type FDO 700 IQ, manufactured by Wissenschaftlich-Technische Werkstätten (WTW) GmbH. http://www.wtw.de (accessed 12 March 2017)
S22