Dual Dimensional ABR Control Scheme Using Predictive Filtering of Self-similar Traffic Sven A. M. Ostring *
Harsha Sirisena +
Irene Hudson’/
* Department of Electrical & Electronic Engineering ~Departrnent of Mathematics & Statistics University of Canterbury, Christchurch, New Zealand. Email: * {ostrinsa, sirisena}@elec.Canterbury.ac.nz
[email protected]
Abstract This paper presents an ABR control scheme (ABR2 – DP) which maximises the utilisation of information
available about the net-
work traffic. Firstly, it takes into account the long-range dependence of the self-similar background network traffic, and utilises it for more accurate multi-step predictions of the explicit rate (ER). secondly, prediction errors for connections with greater network delay are compensated for in the ER calculations for connections with smaller delay. Hence, the available bandwidth is distributed both in temporal and spatial dimensions. The scheme allows a reduction in buffer requirements
and queueing delay. Performance
results are presented and compared with a previously proposed scheme which uses digital filtering.
1[ Introduction The Available Bit Rate (ABR) service has been defined by the ATM Forum for non-real time applications, such as data computer communications and file transfers. This service distributes any available bandwidth on a particular link to the ABR connections. Thus, a feedback mechanism is required to allocate this bandwidth. For other real-time connections, the ATM standards provide Quality of Service (QoS) guarantees which must be maintained throughout the duration of any connection. Hence, it is important that the feedback mechanisms included within the ABR service incorporate the characteristics of the background traffic so that the ABR connections can perform efficiently without degrading the QoS of other connections. There is also a delay in returning the control information to the ABR sources, and this delay must be included in the design of the feedback control. Most research has focused on developing explicit rate feedback mechanisms [1, 2]. The ABR source must ensure that its rate is not greater than the ER value returned by the network. More recently, Li has investigated the use of measurementbased resource management, and has demonstrated the improved performance of this approach [1, 3]. However, in all cases, the model for the background traffic has been simplistic and has not been justified by recent traffic analysis. Specifi-
cally, several recent studies have shown that there is significant statistical evidence that a large number of different types of network traffic have the property of self-similarity [4, 5]. A property of self-similar processes is that they are longrange dependent, which means that there is a significant amount of the information about the current state in previous states. Thus, using the property of long-range dependence can result in higher accuracy in predicting future states, and this can be used to improve the performance of the system, even with large network delays. Prediction of self-similar VBR traffic for resource management has been considered previously [6]. This present paper investigates the concept of incorporating the prediction of self-similar traffic into the feedback control mechanisms for the ABR service. The predictions are also stored at the network node and utilised in calculating the ER value for sources with shorter delay. This maximises the use of the information available at the network node.
II
System and Modelling
Background
Traffic
The ABR service distributes the available bandwidth of a particular network link between the ABR connections traversing the link. The Explicit Rate (ER) which the network allocates to a particular source is calculated at the node and entered into Resource Management (RM) cells in the connection stream which are forwarded through the network. There is also other background traffic which is traversing the network node and its associated link, and the QoS contract for this traffic must be maintained. The model for the system and the background traffic is described in this section.
A.
Network Node Model
The network model defined here is based on controlling the bandwidth of the outgoing link. This follows the model proposed by Zhao and Li [1]. This is in contrast with other ABR feedback schemes in which the control is based on the queue length. The control of the bandwidth is more easily stabilised
0-7803-5287-4/99/$10.00 (c) 1999 IEEE
compared with controlling the buffer which introduces inherent integration into the control system. We define the total bandwidth being used by ABR connections as U(k), the total background traffic as Rb (k) and the outgoing link capacity as C, all measured in bits/s. The system is modelled as a discrete-time system, since it is monitored in this framework. The congestion avoidance policy can be formulated as follows, U(k) + Rb(k) = p C
(1)
where the control aim is to keep the offered load at a proportion p (O < p < 1) of the outgoing link capacity. The total ABR bandwidth is made up of the summation of the individual bandwidths used by the N ABR connections. It is assumed that the number of connections N is slowly varying compared with the time constant of the system, and hence N can be considered constant. Each connection has its own delay dj through the network. Then the state variable of the system can be defined as deviation from the target utilisation, that is
hyperbolically rather than exponentially, and hence is nonsummable. In particular, long-range dependence means that the uncertainty in the prediction of self-similar processes is reduced since the correlations with past states are more significant [8]. Fractional ARIMA processes, the self-similar models used in this paper, have the particular advantage of modelling both short-range and long-range dependence. They are a natural extension of the ARIMA(p, d, q) models, where the differencing parameter d can take fractional values. Fractional ARIMA processes can be used for modelling discrete time functions, which is the type of information available from the system. For the f-ARIMA(O, d, O) process Ady~ = e~, the autocovariance function is given by [9]: (-I) ’I’(l -- 2d) 7g=a2r(l and for the f-ARIMA(l,
~uj(k–dj) j=l [
+Rb(k)
@)+ F(l, d-k;
l-d-k;
#)
l–#2
}
(6)
1
A metric for the state variable is its variance 13[x2(k)], and the aim of this control system is determine the inputs uj (k) so that the variance 13[z2 (k)] is minimised. By defining the variable W(k) = p (? – Rb (k), and introducing the sharing mechanism Wj(k) = w, j = 1,. ... N, the system now becomes a collection of N decoupled subsystems, each with their own controller:
where F(a, b; c; z) is the hypergeometric function. The differencing parameter d can be estimated using heuristic techniques such as the variance-time analysis and R/S statistic analysis, and the ARMA parameters q$i, i = 1, . . . , p and ej, j = 1,. . . , q can be found by standard least squares or maximum likelihood estimation techniques [10].
C.
21 (k) = –Ul(k – 61) + WI(k) X2(k) = –Uz(k – 62) + Wz(k) (3) z~(k)
{
(2)
(5)
-k-d)
d, O) process (1 – @l?)AdZ~ = .s~,
F’(l, d+k; l-d+k;
~: = ~: z(k) = PC’–
+k–d)I’(l
= –?JN(k – 6N) + w~(k)
Prediction of f-ARIMA Processes
For our system model, as defined in Section A., we require the prediction of the background network traffic which is traversing a particular node in the network. This information experiences a delay 6 in the network before the effects can be observed at the same node. Hence, we require a d-step ahead predictor. The long-range dependence property of network traffic can be employed to provide more accurate predictions. We seek the
where b1>d2 >... > 6N, without loss of generality. Our control aim now is to minimise 13[x~(k)]. This is equiv- best linear predictor G~) of the form: alent (refer to [7]) to requiring that the prediction ij (k) = O for all k. Taking the expectation of (3) and setting ij (k) = O, we have the following general control law for each subsystem: Uj(k) =Wj(k+aj
Iw(rn)
: m
2.5
There are three additional steps in the ABR connection setup procedure for the proposed algorithm. An estimate of the network delay is required for the particular connection. This can be obtained using an RM cell which traverses the complete connection. The ABR source then calculates the travel time, and notifies the switches of this delay. The switches then calculate ‘Jj) for the connection the discrete-time (digital) predictor GM
de11a=2
5 .: -
2 \
delti=l
I
1,5: 10
20
33
40
70 Prs4@e~Lenglh
80
SO
ICU
Mm
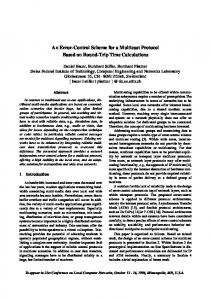
Figure 1: Trends of the Variance of the Prediction Errors (where 6 ~delta)
inverting 17~, or recursively using the Durbin-Levinson algorithm [10]. The variance of the prediction errors is given by
(o = ~(0) – VM
(0’ rM-1 TM (6)
TM
(9)
Figure 1 shows the variance in the prediction errors for various predictors of memory length M and delay 6. It is seen that there is greater uncertainty for predictions with larger delays. This variance can be decreased, to a degree, by increasing the memory of the predictor. However, beyond the “knee” which occurs in the graph, the variance is not decreased significantly by increasing the memory length. The dotted lines show the theoretical results, and these are closely matched with the prediction results using the self-similar VBR data set described in Section IV. The dashed line is the variance of the original data .-,--------- . >GYUG1lW,
..L.,.L W lll&ll
. . . . . . . . . . 1 G~l G.SC11L3
.cZ1l
. . . . U~~G1
. .
L,... -d UUU1lU
C,... lU1
+L L1lG
. . . . ------VCUICUIGG
-S U1
the prediction errors.
III
Connection Setup Procedure
Implementation of the Proposed ABR2 – DP Algorithm
A dual dimensional bandwidth allocation scheme for the ABR service is developed using the digital predictions of the background traffic (hence, the notation ABR2 – DP) and previous predictions to provide compensation for prediction errors. The source rates are determined using a digital predictive filter constructed from the autocovariance function of the underlying self-similar model of the background traffic and information regarding the average network delay experienced by the connection. In addition, a prediction compensation algorithm is also used to compensate for larger prediction errors for sources with larger network delays. In this manner, the available bandwidth is distributed in the temporal dimension, where individual sources are allocated a share of the bandwidth at a particular point in time, and in the spatial sense, where connections with smaller round-trip delay are allocated bandwidth to compensate for longer connections which have greater variance in predic-
j based on the &j-step ahead prediction required and with the information of the autocovariance function of the background traffic. We assume that this has been determined off-line using a self-similar model for the background traffic. A reference to the connection j is then placed in the list of ABR sources with decreasing network delay. This ordering process is required for the prediction compensation algorithm.
B.
Digital Prediction (DP) Algorithm
The digital prediction algorithm determines the explicit rate feedback for the ABR sources using predictions of the background network traffic. This is accomplished by storing sampled data from bandwidth used by all other traffic using the network node in a block of memory of size M. This sampled data is used to predict the future network traffic for use in the ABR connection according to the equation
uj
(k) =
pc– Ab(k+ f5j) N
(lo)
where N is the total number of ABR connections. For simplicity, we have assumed that the available bandwidth is uniformly divided between the ABR connections, but this could be generalised to have an arbitrary weighting between them. The predicted traffic level is given by
where {Rb (m)} is the vector of M samples of the level of background traffic updated at each calculation instant. Rb (k) is assumed to be a stationary stochastic process with mean Pb, variance a; and autocovariance function ~b(k). In particular, Rb (k) is modelled as a fractional ARIMA process in this paper, where the autocovariance function is given by (5) and (6). For this study, the mean Pb is determined off-line.
C.
Prediction Compensation Algorithm
The value for the explicit rate determined by the feedback mechanism is returned to the ABR source using the RM cells in the connection cell stream. These values are also required for
0-7803-5287-4/99/$10.00 (c) 1999 IEEE
..policing and tariffing the connection to ensure that It 1s complying with the feedback from the switches. This means that the ER values are stored at the switch. For this algorithm, we propose using these values within the feedback mechanism to provide compensation for the prediction errors which occur when determining the ER values. In particular, the prediction errors for connections which have a smaller network delay will have smaller variance than the connections with larger delay. In addition, the ER values for the connections with larger delay will be available when calculating the values for the connections with smaller delay. Hence, we can use these to provide a compensation component to the ER values for the smaller delay connections. In the derivation which follows, the focus is on the prediction compensation component for source j when its ER value is calculated at time k. The partial ABR rate (the proportion of the total ABR rate known at time k) arriving at the node after dj time slots is determined from the stored ER values:
D.
Explicit Rate Algorithm
The complete algorithm for determining the explicit rate value which is returned to the ABR source is outlined below (the values PeakRatej and MinRateJ are negotiated at the connection setup time): BEGIN Step 1: Sample background traffic level and update vector of samples Rb; Step 2: Forj = 1 toN (a) Calculate the predicted rate uj (k); (b) Calculate the prediction component Auj (k);
compensation
(c) Calculate the explicit rate to be returned to the ABR source:
j–l
duj(k+dj) =~ui(k–di+bj) (12)
ERj
= min [PeakRatej,
‘i=l
max (MinRatej,
13Uj is the partial ABR rate. This is the total rate from ABR sources i with di > dj (i = 1,. ... j – 1) which have previously been allocated bandwidth for time slot k+ C$j.It is assumed that the transmission of these sources is at their specified ER rate. In reality, the source rates may transmit below their ER rate, so (12) is the worst case scenario. The optimal rate Uj (k) for source j is also calculated at time k. Since the available bandwidth is shared uniformly, this is the optimal rate (which can be predicted at time k) for all the ABR sources arriving at the node at time slot k + dj. This is because the best predicted value for the background traffic has been used to calculate Uj (k), which is more accurate than previous predictions where the delay was greater. This results in the optimal partial ABR rate for sources i = 1, . . . , j – 1 as: dUj(k+6j
I Rb(ria), m E [k– M+
l,k])
= (j – I)uj(k) (13)
We can compensate for the deviation of partial ABR rate from its optimal by providing a prediction compensation component for source rate j, calculated as:
Auj (k) =
Ml;(k + C$)– ixlj(k + f.$j) iv-j+l j–l
(~ -l)%(~)- ~w(~ - ~i+ ?) — —
(14)
i= 1
N–j+l
where 61 > dj, i = 1, . . . , ~ – 1. This formula assumes that sources have been ordered with decreasing network delay, and that the predicted rates are calculated following that order. In addition, the deviation from the optimum has been shared uniformly between the source j and the ABR sources which have not yet been allocated bandwidth for time slot k + bj.
Uj (k) + Auj (k))] (15)
End FOL Step 3: Enter ERj nection j;
value into each RM cell for con-
Step 4: Go to Step 1. END
IV
Performance Results and Comparison
The performance of the proposed ABR2 – DP algorithm is investigated using computer simulation. The network system for the simulations is shown in Figure 2. It consists of six ABR sources and a VBR source which are competing for the use of a congested link. The ABR sources have round trip delays of {6j} = {10,8,6,4,2, 1}. The VBR source is composed of 10 MPEG video streams which have been randomly shifted relative to each other. The original MPEG stream was generated from the Star Wars movie [11] and filtered to remove the correlations resulting from the GOP frame sequence in the MPEG encoding [6]. A fractional ARIMA(l, d, O) model was identified for the resulting data series, and the model parameters were estimated giving the following equation: (1 - 0.302-1)
A“’’(R,(k)
- 3.74X 10’)=
c(k)
(16)
where {e(k) } is a white noise process with zero mean and variance ~2 = 7.76 ~ 1o1o. The autocovariance function for the traffic is obtained for this model using (5) and (6). The switch has memory allocation for 64 samples of background traffic (ie the memory length of the digital predictors
background
0-7803-5287-4/99/$10.00 (c) 1999 IEEE
ABF?2-DP Buffer Rw”,rements!
M==
1774, Mm”=
2,42.2,119
~ 2CC0 . ,503
I
:
2 g 10X . g
5CU
:
5c00
I
DP BuH.r Reaul’ement%
%4 I I
II
I r I Owo 1984, Mean .8
1
Mm=
15400
1,
II
: ~
1,111,1
63=11s
i
llml
o
:
Figure 2: The network model for the simulation study.
503
#
11,1 1s ,, 5CO0 LPF Bull., Requlrmmntx
i
t mo Max= 7293, Mean=
,,1 I 15CO0 88 -!1s
@ 2CWJ
,5X!0’ -
A“. Thrwg$.ut
. 4.97e+05
~ ,W : , : 1CW3 o
10
$
:
35
.s
5C0
00 00R ~~x
10’
SOW
,Omo
A“. mmlg!xlt
= 4.97.+05
5030
1moo
1moo
,mo
Figure 4: Comparison between the buffer requirements of the ABR2 – DP and low-pass filter schemes (p = 0.9)
~ 10 $ 05
00 x 10’ 15~
~
&
,o~o
A.. Thmgp.t
,moo
= 5.+05
10
# : 05
9
2 05 00
moo
10000
Figure3:
15000
00
sow
10000
15000
Individual ABRSource Rates
M = 64). The link capacity is set at 7.48 Mbits/s, which means that the background traffic is using, on average, 50% of the link capacity. The six ABR sources are attempting to utilise the remaining capacity up to the target utilisation, which is set at 90%. A fluid-flow model is used to describe the dynamics of the buffer contents. From the simulation study, the average link utilisation is 89.8%, the maximum queue size is 1774 cells and the mean is 2.4 cells. The individual ABR source rates are shown in Figure 3. This figure demonstrates the prediction error compensation which is accomplished by sources with smaller network delay. These sources have higher variability in their output rates, which is due to the algorithm attempting to reduce the accumulated prediction error of previous sources. This results in lower buffer requirements (see Figure 4). The performance of the proposed ABR2 – DP scheme is compared with two other schemes in Figure 4: a scheme which only uses the digital prediction DP algorithm described in Section 111.B., and a low-pass filtering LPF scheme. Zhao, Li and Sigarto [1] proposed an ABR control scheme which low-pass filters the background network traffic. For comparison with our proposed scheme, we have implemented a 64-tap low-pass filter using a Hamming window with L+ = ~ [3]. The simulations show that for this control scheme, the maximum queue length using a low-pass filter is 7293 cells and the mean is 88.5 cells. This compares with the ABR2 – DP algorithm proposed in this paper, where the maximum is 1774 and the mean is 2.4 cells. This means that buffer resource requirements are greatly reduced, and so is the average delay of cells in the ABR system due to buffering. The simulations using only the digital
prediction algorithm (DP) show that prediction compensation reduces the mean queue length significantly (from 8.6 cells to 2.4 cells). Hence, the effect of the prediction compensation algorithm is to reduce the average delay due to the buffering process. It is well known that the effect of self-similar traffic on the performance of an uncontrolled finite buffer in a network system is that cell loss ratio only decreases hyperbolically with buffer size. This means that significant increases in the buffer size do not achieve the desired service objectives. The comparison of the cell loss ratios of the two control schemes for different link utilizations is shown in Figure 5. It can be observed from Figure 5 that the LPR scheme does not adequately address this effect of self-similarity. The ABR2 – DP control scheme, however, does compensate for the effects of the self-similar traffic by incorporating the underlying stochastic structure of the self-similar traffic into the prediction method. The cell loss ratio decreases approximately logarithmically with buffer size, as can be observed from Figure 5. This comparison demonstrates the improved performance which the ABR2 – DP algorithm contributes to the ABR service. In particular, the use of system information is maximised, where we have used the self-similarity of the background traffic and previous control information. This is traded for an increase in computational complexity.
V
Conclusions
In this paper, a congestion control scheme for the ABR service has been proposed. The scheme uses the self-similarity of the background network traffic to reduce the uncertainty in predictions of future bandwidth allocations. In addition, the available bandwidth is also distributed to sources depending on the round-trip delay of the connection as well as simply distributing the bandwidth at each instant in time, thus allocating bandwidth in a dual dimensional sense. This optimal use of system information results in a significantly improved buffer performance. This is traded for an increase in computational complexity of
0-7803-5287-4/99/$10.00 (c) 1999 IEEE
Petimmanca
, ~.,
CmPanson
of &ll Loss Rat,.,
sion),” IEEE/ACM Transactions on Networking, pp. 1-15, Feb. 1994.
how
10-’ ---
.—_____
__-__.—
_______________
---
*..O95 -----. to-’
.099 ----_— ,+m.09
[6] G. Chiruvolu and R. Sankar, “An approach towards resource management and transportation of VBR video traffic~’ Proceedings of ICC ’97, pp. 55@554, 1997.
_____ ___
[7] K. ~strom and B. Wittenmark, Computer-Controlled Systems Theory and Design. Prentice Hall, New Jersey, 3rd cd., 1997.
.095
[8] G. Gripenberg and I. Norros, “On the prediction of fractional brownian motion,” Journal of Applied Probability, vol. 33, pp. 400–410, 1996.
iw.09 ‘:
vol. 2,
%s
[9] J. Hosking, “Fractional differencing~’ Biometrika, vol. 68, no. 1, pp. 165–176, 1981.
Figure 5: Comparison between the cell loss ratios of the ABR2 –DP scheme (solid) and low-pass filter scheme (dashed) for different link utilizations p.
[10] P. Brockwell and R. Davis, Time Series:
the congestion control algorithm. Further work in progress ineludes the development of an adaptive control scheme which can handle the potential uncertainty and non-stationarity of the statistics of the background network traffic.
[11] M. Garrett and W. Willinger, “Analysis, modelling and generation of self-similar VBR video traffic;’ Computer Communications Review Proceedings of ACM SIGCOi14M, vol. 24, pp. 269–280, Aug. 1994.
Theory and Methods. Springer-Verlag, New York, 2nd cd., 1991.
Acknowledgement The authors wish to acknowledge the financial support of the Royal Society of New Zealand R H T Bates Postgraduate Scholarship, and thank Krys Pawlikowski of the Department of Computer Science, University of Canterbury for his constructive comments on the paper.
References [1] Y. Zhao, S. Q. Li, and S. Sigarto, “A linear dynamic model for design of stable explicit-rate ABR control scheme;’ Proceedings of INFOCOM ’97, pp. 283–292, Apr. 199’7. [2] S. Ostring, H. Sirisena, and M. Hassan, “Optimization of a rate feedback control with feedforward for traffic management in ATM networks,” Proceedings of APCC ’97, vol. 3, pp. 1551–1555, Dec. 1997. [3] S. Li, S. Chong, and C. Hwang, “Link capacity allocation and network control by filtered input rate in highspeed networks,” IEEE/ACiW Transactions on Nehvorking, vol. 3, pp. l&25, Feb. 1995. [4] J. Beran, R. Sherman, M. Taqqu, and W. Willinger, “Long-range dependence in variable-bit-rate video trafiic;’ IEEE Transactions on Communications, vol. 43, pp. 1566-1579, Feb/Mar/April 1995. [5] W. Leland, M. Taqqu, W. Willinger, and D. Wilson, “On the self-similar nature of ethernet traffic (extended ver-
0-7803-5287-4/99/$10.00 (c) 1999 IEEE