Left Lateral Occipital Cortex inferior division. -61 -95 -17 ... Left Temporal Occipital Fusiform Cortex. -45 -63 -17 ... Right Juxtapositional Lobule Cortex. 3. 1. 47.
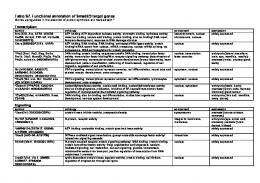
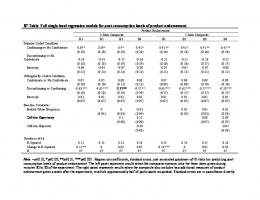
S7 Table. Full single-level regression models for post-consumption levels of product endorsement. ... Stepwise regression was conduced twice, using either.
signature in Caenorhabditis elegans Dauer larvae and long-lived daf-2 mutants implicates detoxification system in longevity assurance. J Biol Chem 279:.
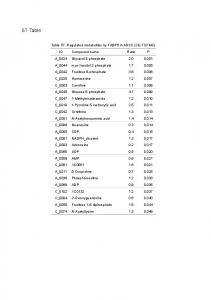
Table S7. Regulated metabolites by FABP5 in ADSC (CE-TOFMS). ID. Compound name. Ratio. P. A_0024 Glycerol 3-phosphate. 2.0. 0.001. A_0044 ...
LOC_Os02g57280 (Brown planthopper-induced resistance protein 6). 22.545 0.359 20.959. 0.279. 0.002. 0.205. LOC_Os01g53020 (heat shock protein DnaJ).
1.01 ± 0.07 bc 1.25 ± 0.31 ab 0.92 ± 0.15 bc 0.47 ± 0.19 c. FaMYC2. 19.07 ± 2.37 a. 5.62 ± 2.40 b. 1.97 ± 1.10 b. 1.15 ± 0.43 c 1.14 ± 0.27 c 0.69 ± 0.26 c 0.29 + ...
S8 Table: Full model selection table for linear mixed models, testing nutrient values and food quality in stomachs of wild boar from Berlin and. Brandenburg ...
(B) Distribution of LAM-25/128/163/190/213/224/246 group and these two subgroups LAM-190/213/246 (subgroup A) and LAM-25/128/163/224 (subgroup B). A.
S7 Table: Relative variable importance for linear mixed models, testing nutrient values and food quality in stomachs of wild boar from Berlin and Brandenburg between 2012 and 2015. Only models with an AICc value below 2 were used to calculate the variable importance. Only variables above 0.4 are used for the final model and visualized in Figure 4. Explanatory Sealing Houses Human Deciduous Coniferous Agriculture Grassland Variable Density Response Energyrural Energyurban MOF AIA Protein Starch Fat Fibre