IEEE TRANSACTIONS ON SMART GRID, VOL. 5, NO. 1, JANUARY 2014
381
Split- and Aggregated-Transmission Control Protocol (SA-TCP) for Smart Power Grid Tarek Khalifa, Atef Abdrabou, Member, IEEE, Kshirasagar Naik, Maazen Alsabaan, Amiya Nayak, and Nishith Goel
Abstract—This paper introduces our proposed Split- and Aggregated-TCP (SA-TCP) scheme’s enhanced TCP performance in a smart metering infrastructure (SMI). The scheme is based on upgrading intermediate devices (e.g., regional collectors) to aggregate TCP connections. An SA-TCP aggregator collects data packets from smart meters in a certain region over separate TCP connections, then reliably aggregates them in one TCP connection to the management server of the utility. Our proposed scheme responds better to data traffic dynamics of smart meters and makes TCP congestion control effective. A full mathematical model of SA-TCP is provided. Validated by extensive ns-2 simulations, the model accurately and flexibly predicts the SA-TCP scheme’s throughput, packet loss rate and packet delay. Furthermore, we formulate an optimization problem to find the optimal number of SA-TCP aggregators that ensures acceptable packet loss rate and delay. Index Terms— Congestion control, network reliability, smart metering infrastructure, telecommunication traffic, transport protocols.
I. INTRODUCTION
T
HE SMI system is characterized by the deployment of a large number of smart meters. The meters typically produce data at low rates (e.g., one packet of 200 bytes every minute) either periodically or in response to triggered events. Data packets are collected at the utility server for processing and decision making. A massive volume of data is expected to be transferred through the utility network of limited bandwidth with the requirement of guaranteeing end-to-end reliability [1]. The TCP protocol [2] is designed to provide the required end-to-end reliability; however, what is questioned here is the effectiveness of the protocol’s congestion control for smart meter communication. In an SMI, each meter transmits at a
Manuscript received December 02, 2012; revised April 16, 2013; accepted July 18, 2013. Date of publication September 10, 2013; date of current version December 24, 2013. Paper no. TSG-00837-2012 T. Khalifa and K. Naik are with the Department of Electrical and Computer Engineering, University of Waterloo, Waterloo, ON N2L 3G1, Canada (e-mail:
[email protected];
[email protected]). A. Abdrabou is with the Department of Electrical Engineering, United Arab Emirates University, P.O.Box 15551, Al-Ain, United Arab Emirates (e-mail:
[email protected]). M. Alsabaan is with the Department of Computer Engineering, King Saud University, Riyadh 11421, Saudi Arabia (e-mail:
[email protected]). A. Nayak is with the School of Information Technology and Engineering, University of Ottawa, Ottawa, ON K1N 6N5, Canada (e-mail: anayak@site. uottawa.ca). N. Goel is with Cistech Limited, Ottawa, ON K2E 7L5, Canada (e-mail:
[email protected]). Color versions of one or more of the figures in this paper are available online at http://ieeexplore.ieee.org. Digital Object Identifier 10.1109/TSG.2013.2279756
Fig. 1. Split and aggregation mechanism.
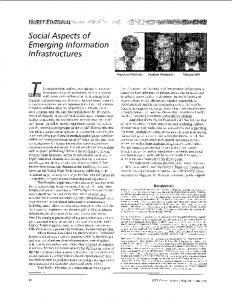
low rate. The TCP congestion control mechanism falls short as the traffic transmission rate cannot be lowered even when congestion occurs. The volume of traffic does not come from a single source with a significant data rate. Rather, it comes from a large number of sources, each transmitting at a low data rate [3]–[6]. The lack of an effective transport congestion control mechanism causes a high packet loss rate and low throughput for the meters and any data traffic passing across the utility network [7]. We propose a TCP-based scheme called Split- and Aggregated-TCP (SA-TCP) to enhance TCP congestion control performance. In this scheme, instead of having the smart meters and sensors communicate over separate TCP sessions with the utility server, we introduce the idea of consolidating those individual TCP connections at intermediate devices we call SA-TCP aggregators. As Fig. 1 demonstrates, the SA-TCP aggregator establishes TCP connections with the smart meters on one side, over which the meters’ data is received, and establishes another TCP connection with the utility server on the other side, over which the data is forwarded (explained further in Section V). Existing devices known as regional collectors [6] are exploited for this added functionality. We further develop a mathematical model to capture the application behavior of metering device traffic in the proposed scheme.1 Considering the two stages of the scheme, the modelling approach uses Markovian models to represent smart meters in the first stage and SA-TCP aggregators in the second. Then, the approach studies the interaction of smart meters and SA-TCP aggregators with the network by means of standard queuing models. Thereby, given the number of meters, the number of SA-TCP aggregators, and the network properties, the model is able to calculate the average load offered by a meter (i.e., throughput), packet loss rate and end-to-end delay. Additionally, we formulate the mathematical model as 1A
preliminary version of this paper has appeared in [8].
1949-3053 © 2013 IEEE
382
IEEE TRANSACTIONS ON SMART GRID, VOL. 5, NO. 1, JANUARY 2014
an optimization problem to find the right number of SA-TCP aggregators that lead to satisfactory performance results. This paper makes the following contributions: • It introduces a mathematical model to accurately predict the performance of SA-TCP in terms of packet loss rate, end-to-end delay and throughput. A combination of Markovian and queuing models is employed for this purpose. For validation, extensive ns-2 simulations have been conducted. • It provides an optimization framework to determine the optimal number of SA-TCP aggregators to include in the SMI design so that the desired performance is achieved. Although the addition of SA-TCP aggregators enhances TCP congestion control performance (i.e., higher throughput and less packet loss rate), it increases packet delay. Therefore, finding the optimal number of SA-TCP aggregators is important. The rest of the paper is organized as follows: Section II summarizes the related research done for SMI. Section III presents the smart metering system model and assumptions. Section IV provides a detailed explanation of how the TCP congestion mechanism would be ineffective in the smart metering infrastructure. Section V describes the mechanism of our proposed SA-TCP scheme. Section VI provides the analytical formulation of SA-TCP. Model validation follows in Section VII. Section VIII describes the optimization model. Finally, Section IX provides concluding remarks. II. RELATED WORK Transport-level issues have recently caught researchers’ attention. To the best of our knowledge, our previous work [7], [8] were the first to highlight the special requirements and shortcomings of TCP in supporting SMI traffic. This paper extends that work as it analyzes the performance of a complete SMI network, from meters to the utility server. Allalouf et al. [9] resolve congestion by performing hop-by-hop traffic reduction. The paper assumes that meters’ data samples are required at certain intermediate devices but not at the utility center. Kim and Thottan [10] propose a transmission control protocol that deals with delay-sensitive smart grid applications. They identify the different causes that lead to increased delay in the TCP protocol so as to avoid the unnecessary delays. Consequently, their proposed protocol reduces end-to-end delay; however, congestion control is not studied. Large scale wireless sensor networks (WSN) represent a rich area to look into their transport control protocols because of their similarity to SMI (e.g., [11] and [12]). However, it is important to notice major differences. WSNs employ data aggregation (e.g., min, max and average), which is not suitable for certain SMI applications such as real-time pricing and load management. Moreover, for reliability, WSNs provide multiple readings of the same measurement from multiple sensors; however, that is not viable in SMI. Data collection on the Internet have been addressed recently in [13] proposing a new transmission congestion mechanism. The mechanism is based on adjusting the number of probes sent
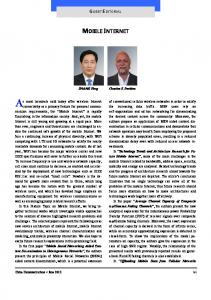
Fig. 2. Smart metering conceptual system.
from a collector device to data sources according to the congestion state of the network. The mechanism would face challenges in SMI because much of meters’ data is event-driven. Second, distributing the probe signals to a large number of meters requires studying the overhead that may result, especially if the meters are connected wirelessly, and thus experience high packet loss rate and delay variability. The idea of split TCP was introduced earlier in wireless networks to reduce variability of round trip time and to lessen the effect of wireless-related issues on TCP performance. Indirect-TCP (I-TCP) [14] splits a TCP connection between a wireless mobile host and a fixed host into two, one formed between the wireless host and an intermediate support router and the other between the support router and the wired host. However, I-TCP does not combine multiple TCP connections at the support router. Aggregation of TCP connections appeared in General Packet Radio Service (GPRS) to control bandwidth distribution among cellular devices and to improve link utilization [15]. TCP aggregation in [15], however, is in the form of sharing the TCP state information (e.g., round trip time and congestion window size) among a set of TCP connections that a single mobile device initiates; thus, the number of TCP connections does not change. III. SYSTEM MODEL AND ASSUMPTIONS Smart Metering Infrastructure involves various entities to achieve two-way end-to-end connectivity. Fig. 2 shows a conceptual SMI system. The system is composed of a large number of meters connected by means of a wireless communication network or Power Line Carrier (PLC). Depending on the underlying communication technology, meters may connect to a wireless base station in a single hop (e.g., WiMAX) or over multiple hops forming a mesh topology [16]. Isolated meters (e.g., in rural areas) may connect to the rest of the network through repeaters to boost their signals. Intermediate devices known as Regional Collectors (RCs) (a.k.a concentrators) are installed on poles at preselected locations in every region to route the meters’ data packets to the wide area network. At the other end, utility servers, where metering and sensory data are collected, are also connected to the wide area network [6], [17]. The number of smart meters is expected to be in the range of hundreds of thousands to millions, whereas the number of regional collectors is expected to remain as small as in the tens [6]. These devices are assumed to fully support the TCP/IP
KHALIFA et al.: SPLIT- AND AGGREGATED-TRANSMISSION CONTROL PROTOCOL
communication stack as defined by the Device Language Message Specification/COmpanion Specification for Energy Metering (DLMS/COSEM) standard [18]. The network is required to operate in both directions between meters and utility servers. It is expected, however, that the bulk of the traffic will flow from the meters to the utility server [19]. Although wireless and PLC links are employed, for the sake of studying TCP, we assume that all the links are loss-free to ensure that any packet loss is indeed due to congestion. Data packets vary in size from tens of bytes to a few hundreds of bytes, depending on the information carried and security system employed [3], [20]. Reliable delivery of every report sent by a meter or sensor is required. Data aggregation is not applicable. Because the utility provider is interested in each measurement, rather than some statistical summary of the data, data aggregation techniques, such as mean, median, maximum and minimum [21], cannot be employed here. Meeting this requirement is essential for major applications such as Real-time pricing and demand side management; that is for the utility provider to be able to calculate and present the cost to every customer and to control a customer’s power consumption as needed [3], [22], [23]. Security and privacy measures also necessitate encrypting the carried information end-to-end [24].
383
Fig. 3. SA-TCP architecture.
Fig. 4. Layered architecture of SA-TCP aggregator.
IV. PROBLEM DESCRIPTION The common behavior of the transport control protocols in achieving congestion and flow control is to adjust the source’s congestion window. A traffic source keeps increasing its transmission speed by enlarging the window size, but if a packet goes unacknowledged, indicating congestion in the network, the source lowers its speed. With SMI traffic, the typical congestion control mechanism of TCP becomes ineffective for the following reason. The high volume of traffic in SMI does not come from a single source; rather, it comes from a large set of sources, each transmitting at a low data rate. The TCP congestion window always stays at its minimum value of one or two, so reducing the sending rate upon congestion in the network is not viable. Therefore, the SMI traffic is highly aggressive as there will be hundreds of thousands of TCP connections transmitting at a low flat rate. The lack of an effective congestion control mechanism leads to major problems, namely, congestion collapse and unfairness [25]. Congestion collapse occurs when the network is busy transmitting packets that will be dropped at some congested router before reaching the final destination. That is, even though SMI traffic may suffer packet drops, the total traffic rate stays unchanged [7]. In other words, in times of congestion, SMI traffic acts as non-TCP friendly, or what is known as unresponsive [25]. Unless an effective congestion control is in place, bandwidth is wasted and, in turn, not utilized efficiently. Increasing a link capacity does not resolve congestion since the available bandwidth changes randomly [13], [25]. Increasing link capacities should be utilized in the support of more meters and more applications. Accordingly, our goal is to enhance TCP performance by making SMI traffic TCP-friendly. The next section explains how our proposed SA-TCP scheme works and how it improves TCP performance.
V. SPLIT- AND AGGREGATED-TCP SCHEME(SA-TCP) We propose a new TCP-based scheme named Split- and Aggregated-TCP (SA-TCP). In SA-TCP, we introduce the concept of aggregation at the transport layer. Intermediate devices (e.g., RCs) take on the task of splitting and aggregating TCP connections (depicted in Fig. 3). The SA-TCP aggregator, as we call it, creates a unified TCP connection with the utility server on behalf of several meters’ TCP connections. Each meter initiates a TCP connection with an SA-TCP aggregator in its region, over which data packets are reliably transmitted. The SA-TCP aggregator in turn forwards the reports over the unified TCP connection with the utility server. In other words, the TCP connections between the meters and the utility server are no longer one-hop, but rather, two-hop connections. More precisely, as Fig. 4 shows, every meters establish TCP connections with an SA-TCP aggregator. The meters’ data packets are received at the application layer and forwarded by the aggregation application over a single TCP connection with the utility server. No change occurs to the TCP Protocol mechanisms at end points (i.e., meters, SA-TCP aggregators and the utility server). VI. SA-TCP ANALYTICAL MODEL The objective of mathematically modelling SA-TCP is to conduct performance analysis and ultimately to optimize the SA-TCP architecture design, specifically, decide on the optimal number of SA-TCP aggregators for satisfactory performance results. The model considers various components at different communication layers, mainly, application and transport behavior. It also takes into account the network characteristics, such as the capacity, propagation delay, queuing, and number of meters and SA-TCP aggregators. The model allows us to
384
Fig. 5. SA-TCP model architecture.
reproduce the actual behavior of the meters’ traffic in SMI, depicted in terms of the performance metrics, namely, offered load, packet loss rate and packet end-to-end delay. Offered load is the source’s throughput, calculated as the rate at which data segments are produced by a TCP source. Packet loss rate is the probability of packets getting dropped due to buffer overflow in the network. Packet end-to-end delay is the time a packet takes to arrive at the destination. A. Modelling Approach Fig. 5 gives a big picture of the SA-TCP model. SMI traffic passes through two stages, the first recognized by the first-hop TCP connection between the meters and the SA-TCP aggregators, and the second by the aggregated TCP connections between the SA-TCP aggregators and the utility server. We apply a modified procedure from the fixed-point approximation method [26], [27] in modelling both stages. The fixed-point solution is the operating point of the network given in terms of the average offered load rate, loss rate and delay. The method is based on the idea of modelling the sources and network separately and then finding a common solution that satisfies both models. In brief, the procedure is as follows: 1) The traffic load offered by the sources is modeled as a function of the network parameters, probability of loss and delay. 2) These network parameters are modeled as functions of the sources’ offered traffic load. 3) Starting with an initial value for the sources’ offered load, the same network parameters are calculated. The obtained values are used to calculate a new value for the offered load. Iteratively, every time new values of loss and delay or offered load are calculated, they are fed back to obtain another set of new values. This iterative procedure is continued until no further change in the performance parameters occurs. The solution of this last iteration corresponds to the fixed point solution. The detailed steps are given in Algorithm 1. In the first stage, meters are grouped into regions, with each region connecting to the same SA-TCP aggregator. The aggre-
IEEE TRANSACTIONS ON SMART GRID, VOL. 5, NO. 1, JANUARY 2014
gated traffic from the meters in a region goes through a network bottleneck modelled as a queuing model. The meter’s offered load, packet loss rate and packet delay are determined by each meter’s application characteristics, TCP congestion window dynamics, and the network bottleneck parameters. We assume that each source produces data segments where the arrival rate follows Poisson distribution at rate . Consequently, the total rate seen by the network bottleneck is since the summation of independent Poisson processes is Poisson [28]. The combined behaviour of the application and TCP congestion mechanism is represented as a continuous time Markovian model. Individual meters may have different application characteristics, for example, the time duration being active or inactive and propagation delay to the SA-TCP aggregator. The network is modelled as a queue with a certain buffer size and service rate. The input rate to the queue is . The queue service rate, however, is calculated from the second stage. It is the rate at which the SA-TCP aggregator is able to serve the received segments. Packets entering the queue are subject to a certain dropping probability and queuing delay. The Markovian model (mimicking the congestion window dynamics) takes those two measures into account to recalculate the segment generation rate accordingly. Our goal is to find the network operating point, so we let this interaction between the meters and the network continues iteratively until a fixed point is reached, as explained in the procedure above. The fixed point is determined when there is no more change in the input rate . and Thereby, we get the approximate average offered load probability of loss , and end-to-end delay . In the second TCP stage, each region’s data is received at the corresponding SA-TCP aggregator, then sent collectively to the utility server through a wide area network (WAN) link. The same modelling approach is applied: the SA-TCP aggregator’s segment generation mechanism is represented as a Markov chain model (mimicking the TCP congestion window dynamics) and the WAN bottleneck as a queue model. Iterating between the aggregator’s segment generation process and the queue model is performed until a fixed-point solution is reached. At that point, the necessary parameters are obtained, , delay and the including the second stage’s loss rate . The obtained offered SA-TCP aggregators’ offered load load is used as the service rate of a region in the first stage. B. Model of Meters This section models meters for the purpose of finding the operating point of a region. By assuming a certain number of aggregators, the loss rate and delay is calculated in terms of meters’ traffic. Thus, as the number of aggregators changes, the meter model calculates loss and delay in the first stage of SA-TCP accordingly. We assume that TCP connections are long lived, so there is no need for repeated connection setup. Moreover, Nagle’s and the delayed ACK algorithms are turned off. A meter is expected to generate data at a low rate, with relatively long pauses. Therefore, the application behavior is modelled as a process alternating between on and off periods. We assume that a meter’s application stays inactive (i.e., no data is produced) for an av-
KHALIFA et al.: SPLIT- AND AGGREGATED-TRANSMISSION CONTROL PROTOCOL
Fig. 6. Meter Markov model.
erage time of seconds and follows an exponential distribu. Similarly, it spends an average tion with parameter time of time as active following an exponential distribution . We follow this approximation bewith parameter cause it is close to the anticipated real activity. The meters are not synchronized. Thus, even if each meter sends its data in a deterministic manner, it still leads to that every meter operates as an on-off traffic source. Aggregating a large number of on-off sources leads to a Poisson distribution [27], [28]. Additionally, by adjusting the on and off durations, we can easily adapt the application’s behavior. When the meter’s application is active, TCP encapsulates segments and transmits them over the TCP connection in ac. Regardless of cordance with the congestion window size the TCP variant used, the meter’s congestion window will not exceed 2, for two reasons: (i) the amount of data is low (Small ); (ii) is large, which causes the congestion window to reset to its initial size. The on-off model used here characterizes the data traffic generation in a generic and flexible way in order to adapt to different SMIs’ implementations. For low rate meters, the Markov chain will be dominated by the state 1 . If a meter is configured to generate more, State will be visited more, which makes the limiting 2 probability higher. As per the existing SMI anticipations and assumptions, these two states are enough to accurately repretransmission sent SMI traffic traffic of up to 3 packets per rate. Fig. 6 depicts the state diagram of the Markov chain describing the combined model of the application and TCP behavior. The numbered states correspond to the size of the TCP congestion window, and the transition rates among states correspond to the rate of success or failure of delivering segments. time in the idle state, during which it The system spends sends zero segments. Then it moves to State 1 with rate , corresponding to sending one segment every RTT. If the segment is delivered successfully, the window size grows to two segments (State 2). If a segment is lost while in State 2 or State 1, it enters into State 0, which corresponds to an acknowledgement (ACK) packet timeout. The congestion window is then expires, the reset to one (State 1) for retransmission. As system moves to State ‘idle’ (with rate ). RTT is assumed to be exponentially distributed. Due to the randomness of the network traffic, it is difficult to tell how much time is left for an ACK to arrive given a waiting time of has already passed. In other words, the probability that an ACK arrives after some time , is almost equal to the probability that the ACK arrives
385
after some time . This is an inherent characteristic of the exponential distribution (it is memoryless) that makes it suitable to approximately model the RTT. The transition rates are further explained as follows: segment, the probability of successfully sending • For , where is the probability the segment is of packet loss on the meter-aggregator side. segments, assuming independent losses, the • For probability of sending the two segments successfully is . • Assuming an exponential distribution of RTT with average , the transition rate becomes , where is the propagation delay, is the queuing delay and is the average round trip time. • The transition rate from State 1 to State 2 is , weighted by , the probability of successful delivery of one segment. • The transition rate from State 1 or State 2 to State 0 is rate , weighted by the probability of the unsuccessful delivery of either one of the segments. • Acknowledgement timeout is approximated to be , based on the assumption that the TCP protocol estimates timeout as the average RTT plus 4 times its standard deviation. Since RTT is assumed to be exponentially distributed, the average and standard deviation are the same (i.e., ). Thus, the transition rate from State 0 to State 1 is calculated as . We solve the balance equations of the Markov chain model to and . The obtain the stationary probabilities, , , probabilities and correspond to the transmission of 1 and 2 segments, respectively. Thus, the average traffic generated by a single source is as follows: (1) The total traffic generated by all the meters in a region, each with its On/Off and RTT characteristics, is as follows. (2)
C. Model of SA-TCP Aggregators In the second stage in Fig. 5, the SA-TCP aggregators act as data sources for the utility server. An SA-TCP aggregator establishes a long-lived TCP connection with the utility server, over which it continuously and immediately forwards the received packets from the first stage in accordance with its congestion window dynamics. The congestion window grows to large sizes, and it depends on the TCP variant, which we assume to follow the Reno standard (RFC5681). Fig. 7 details the Markov chain model of the aggregator’s TCP congestion mechanism. The diagram demonstrates how TCP behaves and shows how Markov states and transitions are designed. This design is inspired by [27]. The states are numbered to represent the congestion window size. A state , for instance, corresponds to the transmission rate of segments per RTT. State 0 represents the period of timeout, in which no
386
IEEE TRANSACTIONS ON SMART GRID, VOL. 5, NO. 1, JANUARY 2014
as well as reduce to half (i.e., ), and then TCP enters into the CA phase again. In the diagram, this case corresponds to the transitions to the right-most column of states. For example, with the loss of only one segment when the window is 4 (State 4), the transition is made from State 4 to State 2 and then to State 2 under , 2 so that the window grows linearly after that. Further to the above discussion, state transitions can be explained as follows: • The probability of successfully delivering all segments while in a state of congestion window size is calculated , where is the probability of packet as loss on the aggregator-collector side. • State transitions representing window growth (whether . doubling or linearly incrementing) are calculated as • Assuming losses occur independently, the probability of the loss of segments while in a state of window size is calculated as • For states of , the loss of any segment causes transition to State 0 of column . The rate of transition is • For states of , the loss of one segment causes transition to FR states. The rate of transition is . However, for two or more losses, the transition is made to State 0, and the transition rate is calculated as
Fig. 7. SA-TCP Aggregator Markov model.
segment transmission takes place. Numbers with dashes in the right-most column states represent the fast retransmit phase but do not correspond to actual transmissions. We assume that the maximum congestion window is (determined by the receiver window), and the initial slow start threshold is (e.g., and as in the diagram). The TCP protocol starts with an initial congestion window size of 1 and operates in three phases: Slow Start (SS), Congestion Avoidance (CA), and Fast Retransmit/Recovery (FR). In the diagram, the initial states correspond to the left-most column , starting at State 1. During SS, the window doubles every RTT, so it moves to states 2, 4, then 8. After that, it enters into the CA phase, in which the window grows by only one MSS every RTT, so the next states to be visited are 9, 10, as long as all the segments are acknowland upward up to edged successfully each time. However, as packet loss occurs (depicted by dashed lines), the window shrinks in two ways. If no ACK arrives for the lost packets before the timeout, then is halved. This sitthe congestion window resets to one and uation corresponds to the loss of multiple packets in a window without giving a chance for triple duplicate acknowledgements (3Dup). For example, if the window is less than four, 3Dup does not occur, forcing the window to reset to the SS phase. This situation is modelled as a transition to State 0 to capture the time duration of an ACK timeout. In the case of 3Dup, the FR phase is triggered, in which the congestion window size
• For states of or 12, one or two losses lead to a transition to the FR states of . The transition rate is . If more than two losses occur, the transition is made to and . The rate in this case is a state with . or 14, a loss of 1, 2, or 3 segments • For states of causes a transition to an FR state of with a transition rate as . However, in the case of more than three losses, the transition is for a state with and at a rate . The same form of analysis is performed on the higher states ( 14). • Transitions from the FR states take the rate . This transition captures the TCP Reno’s recovery mechanism. The FR states do not correspond to the transmission of actual segments. • Transition from 0 states takes the rate , assuming an exponential distribution for RTT with average and standard deviation of . • For simplicity, is approximated as or . • Unlike a meter, an SA-TCP aggregator does not have an idle state because it is unlikely that an aggregator stays inactive with a large number of meters sending asynchronously. The probability of an aggregator being idle is the probability of none of the meters send data. To calculate that, assume that the probability of a meter transmits . Thus, with meters in a is is calculated as follows: region, (3)
KHALIFA et al.: SPLIT- AND AGGREGATED-TRANSMISSION CONTROL PROTOCOL
387
For example, if and , and , then . , we Next, to calculate the load served by an aggregator solve the balance equations of the Markov chain model to obtain the stationary probabilities , where is a state. Equation (4) calculates the average traffic load on the jth SA-TCP aggregator . The FR states are excluded because they do not correspond to the actual transmission of segments. Thus (4) is the congestion window size of State . The sumwhere calculates the mean size of the congestion mation window. Multiplying all that by results in the offered load because corresponds to the average time between two successive segments. The total traffic from all the SA-TCP aggregators going into the stage 2 bottleneck is as follows. (5)
Fig. 8. Existence of unique solution.
meters to SA-TCP aggregator) and second stage (i.e., SA-TCP aggregators to the utility server) models. Algorithm 1: Finding the Fixed-Point Solution
D. The Network Model We use an M/M/1/B queuing model [29] to calculate the probability of dropping packets (i.e., packet loss rate) and the average queuing delay, which impact a source’s segment generation process. A queue is characterized by three parameters: the queue size, input traffic rate, and service rate. In the SMI’s first stage (Fig. 5), a region’s network model is characterized by , input traffic rate , and service rate . In queue size the network model of the SMI’s second stage, these parameters become , , and , respectively. The input traffic rates, and , are derived from the Markov models of the meters and SA-TCP aggregators, respectively. The service rate, , is equal to an SA-TCP aggregator’s offered load . The service rate, , is computed as the link capacity (C) over the segment size segment/sec). The loss rate (MSS) in bytes (i.e., and expected queuing delay are given by (6) (7) (8) (9) (10) (11) and are the queue utilization factors in the first where and second stages of the SMI model, respectively. and are the expected values of the queuing delay and end-to-end delay, respectively. Algorithm 1 illustrates the search procedure by which we find the fixed-point solution for each region of the first stage (i.e.,
Step 1) The offered load is expected to be close to the bottleneck service rate, , because the TCP protocol tries to utilize the available capacity, so we . start initially with Step 2) We linearly increment or decrement by a small and calculate and from the queue amount model ((10) and (11)). Step 3) We apply and to the TCP Markov model ((5)) to is compute . If the absolute relative error close to zero (e.g,, 0.01), then this is the fixed point solution. If not, we repeat Step 2. Remark: The first two iterations lead to the right search direction (i.e., whether is higher or lower than ). To speed in Step 2 and up the search, we start with a relatively large then reduce it as the relative absolute error shrinks. On average, the fixed point solution is reached in 400 to 500 iterations. We show here that a unique fixed point solution that solves the meter model and the network model exists. The equations that control the interaction between the network bottleneck model and the source TCP model are (8), (6) and (4). Solving them together leads to a unique fixed-point, which corresponds to the network operating point. Equations (6) and (8) characterize the . Equation (4) queue model as a function of the input rate describes the behaviour of the TCP Markov model in terms of the loss rate and RTT. increases, the Equation (6) is non-decreasing in . As number of enqueued packets increases, leading to higher packet loss rate. Equation (4) is non-increasing in packet loss rate. The higher the probability of loss, the less the offered load. Fig. 8 demonstrates the equations simultaneously as a relation
388
IEEE TRANSACTIONS ON SMART GRID, VOL. 5, NO. 1, JANUARY 2014
Fig. 9. Validation of first and second stage Markov and network models. (a) Meter offered load; (b) SA-TCP aggregator offered load; (c) meter loss rate; (d) meter delay; (e) SA-TCP aggregator loss rate; (f) SA-TCP aggregator delay.
between the offered load and packet loss rate . It is evident that the two curves intersect at a single point, which . This figure considers is the fixed point solution 15 SA-TCP aggregators and the utility server. The obtained fixed point solution is validated by ns-2 simulations. A similar experiment is performed for a region of meters connecting to also proves that an SA-TCP aggregator. Plotting versus the network operating point is obtainable in the same manner. The figure is dropped to save space. VII. SIMULATION RESULTS AND DISCUSSION We validate the SA-TCP scheme analytical model through extensive computer simulations using the network simulator ns-2. The focus is mainly on three measures: source traffic offered load (i.e., throughput), packet loss rate, and packet end-to-end delay. The simulation parameters are presented in the corresponding subsections below. The link capacities experimented refer to rather a bottleneck capacity, which is the available bandwidth in a shared link in times of congestion. In a network that serves traffic from various applications that transmit at random, the chance for bottlenecks to build is high. The chance is even higher if the network is formed by heterogeneous technologies with mismatched bandwidths, which is the case with smart grids. The typical bandwidth values for SMIs vary greatly from one country to another and from one utility company to another depending on the communication technology employed. The values range from a few hundred kilobytes as in narrow-band PLC to ‘Mbps’s as in WiMAX to ‘Gbps’s as in fiber (although thought to be too costly to use) [22].
A. Validation of Meter’s Model The meter Markov model presented in Fig. 6 considers two input parameters, packet loss rate and round trip time RTT, in order to compute the network throughput . Thus, validating the meter model can be achieved in two steps. First, ns-2 simulation is performed to calculate , RTT and the throughput . By feeding and RTT, obtained from the simulation results, into the model ((2)), we get the analytical throughput value. Fig. 9(a) shows a comparison of the analytical and the simulated throughput values. Validation is done for a large range of meters (15,000 to 25,000) sharing a link of 1 Mbps bandwidth and 50 msec propagation delay. Each meter is characterized by an average and . As the figure shows, the analytical model provides a close match to the simulation results. B. Validation of SA-TCP Aggregator The SA-TCP aggregator Markov model (Fig. 7) in the second stage block is validated in the same way as the meters’ model. Fig. 9(b) shows the SA-TCP aggregator throughput that is calculated by the model ((5)) using the simulation results of and RTT as inputs and the throughput measured by the simulation. Fig. 9(b) shows a match of within 2% of the simulation results. In this experiment, the implemented model is assumed to have and an initial , thus forming 46 Markov chain states. The SA-TCP aggregators share a network in the second stage (Fig. 7) limited by an E1 link (2.048 Mbps data rate).
KHALIFA et al.: SPLIT- AND AGGREGATED-TRANSMISSION CONTROL PROTOCOL
389
Fig. 10. Validation of fixed-point approach in a region. Performance metrics are obtained using fixed-point solution. (a) Offered traffic load in a region; (b) packet loss rate in a region; (c) end-to-end delay in a region.
C. Validation of Network Model The queuing model ((10) and (11)) takes the traffic load from the sources (i.e., meters or aggregators) as an input and estimates the packet loss rate and delay. Therefore, we test the network model by measuring the throughput by the simulator and feeding it to the model. The calculated values of and for a region in the first stage and and for the second stage are compared against those obtained from the simulator. Figs. 9(c), 9(d), 9(e) and 9(f) show the results for M/M/1/B for the first and second stages. It is observed from the figures that M/M/1/B gives good matching results as the number of sources increases. This is explained by the fact that the large number of TCP connections makes the assumption that the statistical independence (i.e., less correlation) of the input traffic to the queue is realistic. Thereby, the assumption that the network sees a segment generation process given by a Poisson distribution is valid [27]. D. Validation of Fixed-Point Approach in a Region In Fig. 5, a region is a collection of meters transmitting their data to an SA-TCP aggregator. Fig. 10 shows that our model is highly accurate in predicting all region performance measures, namely, offered load , packet loss rate and delay , taking into account the interactions between the sources’ Markov model and the queue model. In other words, the performance results (i.e., the network operating point) are obtained using the fixed point solution. In this experiment, meters’ traffic is modelled as independent on-off sources where the on and off times follow exponential distributions with parameters and , respectively. During the on time, the source produces data packets of size 240 bytes (40 bytes TCP header). The shared link is characterized by a bandwidth of 1 Mbps, buffer capacity , and propagation delay of 50 msec. In the simulation tests, the sources use FTP and run for 12,000 seconds. VIII. OPTIMIZING THE NUMBER OF SA-TCP AGGREGATORS Indeed, keeping the number of SA-TCP aggregators as low as possible keeps the cost of SMI deployment low. In fact, a large number of aggregators leads to the same problem of ineffective congestion control on the aggregator-collector side. In the following, we formulate an optimization problem to minimize the
number of SA-TCP aggregators for certain requirements on loss rate and packet delay. (12) (13) (14)
The above equations form an integer stochastic optimization model. Inequality (13) constrains the total average time for delivering a packet from the smart meters to the utility collector. It is computed as the average time a packet spends in the first stage queue, the second stage queue, and the propagation delay from the meters to the utility server. Equation (8) shows how the averages are calculated, assuming an M/M/1/B queuing model. Inequality (14) constrains the percentage of packet loss allowed. Equation (10) shows loss calculation at bottlenecks. To find the optimal number of SA-TCP aggregators, we perform an exhaustive search. For every value of , starting from an initial value 1, we solve for the SMI network operating point in terms of the total loss rate and delay. To do that, first, we find the fixed point solution of the SMI second stage. Then, using the obtained SA-TCP aggregator offered load, we find the fixed-point solution for a region. We apply the Inequalities (13) and (14), by which the total delay (i.e., meters to the utility server) and packet loss rate are calculated and checked against the delay and loss rate constraints (i.e., and ). If not satisfied, we increment by one and repeat. Impact of Varying Number of Aggregators: Another experiment is performed to determine how the number of aggregators influences the SA-TCP scheme performance. In this experiment, the mathematical model is used to model 400,000 meters distributed in regions evenly. Each region has an SA-TCP aggregator. We assume that each region shares a and . The aggregators share a and on the WAN side. We vary the number of aggregators from zero to 25. Fig. 11 shows the performance results pertaining to packet loss rate and end-to-end delay. Clearly, the loss rate is high when no aggregators are used. As we increase the number of aggregators, the packet loss rate decreases, approaching
390
IEEE TRANSACTIONS ON SMART GRID, VOL. 5, NO. 1, JANUARY 2014
Fig. 11. Impact of number of SA-TCP aggregators.
zero; however, the latency increases. Latency increases in response to congestion since packets tend to wait longer in the queue, rather than being dropped. IX. CONCLUSION The large volume of SMI traffic has been shown to cause performance degradation because the TCP congestion control mechanism will be ineffective as it cannot scale to the large number of smart meters. To correct the situation, a two-hop TCP-based scheme (SA-TCP) has been introduced. The scheme enhances the performance of the TCP congestion control mechanism in an SMI. A mathematical model for capturing the performance achieved as the meter application and network characteristics change is provided. The mathematical model splits the SMI network into two stages and analyzes each by means of Markov and queueing models. It then finds the overall SMI network performance (i.e., throughput, packet loss rate and delay). The simulator ns-2 validates such performance results. We have also shown that performance can be balanced by finding the optimal number of SA-TCP aggregators that ensures low deployment cost on one hand, and satisfies the packet loss rate and delay constraints on the other. REFERENCES [1] M. Kezunovic, V. Vittal, S. Meliopoulos, and T. Mount, “The big picture: Smart research for large-scale integrated smart grid solutions,” IEEE Power Energy Mag., vol. 10, no. 4, Jul. 2012. [2] A. Afanasyev, N. Tilley, P. Reiher, and L. Kleinrock, “Host-to-host congestion control for TCP,” IEEE Communications Surveys Tutorials, vol. 12, no. 3, pp. 304–342, 2010. [3] Engage Consulting Ltd, High-Level Smart Meter Data Traffic Analysis Document Ref.: ENA-CR008-001-1.4, May 2010. [4] G. Lutz and M. Schwarz, “Aami and Mdms Deployment Best Practices,” EcoLogic Analytics, May 2009. [5] B. Louie, “MDMS—Meeting the Meter Data Management Challenge,” Metering International, vol. 2, 2009. [6] D. Relich, “Smart Meters on a Roll in Canada,” Hydro One Networks Inc., Sep. 2008. [7] T. Khalifa, K. Naik, M. Alsabaan, A. Nayak, and N. Goel, “Transport protocol for smart grid infrastructure,” in Proc. IEEE Int. Conf. Ubiquitous Future Networks (ICUFN), Jun. 2010.
[8] T. Khalifa, A. Abdrabo, K. Naik, M. Alsabaan, A. Nayak, and N. Goel, “Design and analysis of split- and aggregated-transport control protocol (SA-TCP) for smart metering infrastructure,” in Proc. IEEE SmartGridComm, Nov. 2012, pp. 139–144. [9] M. Allalouf, G. Gershinsky, L. Lewin-Eytan, and J. Naor, “Data-quality-aware volume reduction in smart grid networks,” in Proc. IEEE Int. Conf. Smart Grid Commun., Oct. 2011, pp. 120–125. [10] Y.-J. Kim and M. Thottan, “SGTP: Smart grid transport protocol for secure reliable delivery of periodic real time data,” Bell Labs Tech. J., vol. 16, pp. 83–99, Dec. 2011. [11] A. D. A, J. Alonso, and V. T, “Making TCP/IP viable for wireless sensor networks,” in Proc. Eur. Workshop Wireless Sensor Netw., Jan. 2004. [12] O. Akan and I. Akyildiz, “Event-to-sink reliable transport in wireless sensor networks,” IEEE/ACM Trans. Netw., vol. 13, no. 5, pp. 1003–1016, Oct. 2005. [13] M. Sbai and C. Barakat, “Experiences on enhancing data collection in large networks,” Comp. Networks, vol. 53, no. 7, pp. 1073–1086, 2009. [14] A. Bakre and B. Badrinath, “I-TCP: Indirect tcp for mobile hosts,” Distributed Computing Syst., 1995. [15] R. Chakravorty, S. Katti, I. Pratt, and J. Crowcroft, “Flow aggregation for enhanced tcp over wide area wireless,” in Proc. INFOCOM, 2003, pp. 136–143. [16] V. C. Gungor and F. C. Lambert, “A survey on communication networks for electric system automation,” Computer Networks, vol. 50, no. 7, pp. 877–897, 2006. [17] M. Dohler, T. Watteyne, T. Winter, and D. Barthel, “Routing Requirements for Urban Low-Power and Lossy Networks,” IETF RFC 5548, May 2009. [18] “Companion Specification for Energy Metering,”, DLMS/COSEM Architecture and Protocols Green Book, DLMS UA, 1997–2007. [19] Engage Consulting Ltd, “Smart Metering System Requirements Update,” ENA-CR006-002-1.1, Apr. 2010. [20] G. Deconinck, “An evaluation of two-way communication means for advanced metering in flanders (belgium),” in Proc. IEEE Instrum. Meas. Technol.Conf., 2008, pp. 900–905. [21] K. Fan, S. Liu, and P. Sinha, “Data aggregation in wireless sensor networks,” in Wireless Sensor Networks and Applications, ser. Signals and Communication Technology. New York, NY, USA: Springer, 2008, pp. 331–347. [22] D. J. Leeds, “The smart grid in 2010: Market segments, applications and industry players,” GTM Research, Jul. 2009. [23] W. H. Kersting, Distribution System Modeling and Analysis. Boca Raton, FL, USA: CRC Press, 2012. [24] A. Cavoukian, “Operationalizing privacy by design: The ontario smart grid case study,” in Information and Privacy Commissioner, Feb. 2011. [25] S. Floyd and K. Fall, “Promoting the use of end-to-end congestion control in the internet,” IEEE/ACM Trans. Networking, vol. 7, no. 4, pp. 458–472, Aug. 1999. [26] A. Misra, T. Ott, and J. Baras, “The window distribution of multiple tcps with random loss queues,” in Proc. GLOBECOM ’99, 1999, vol. 3, pp. 1714–1726. [27] C. Casetti and M. Meo, “An analytical framework for the performance evaluation of TCP Reno connections,” Computer Netw., vol. 37, no. 5, pp. 669–682, 2001. [28] J. Kingman, Poisson Processes. New York, NY, USA: Wiley, 2005. [29] L. Kleinrock, Queuing Systems, Vol. 1: Theory. New York, NY, USA: Wiley, 1975.
Tarek Khalifa received the B.Sc. degree in electrical and computer engineering from Tripoli University, Libya, in 2000. He received the M.Sc. and Ph.D. degrees from the University of Waterloo, Waterloo, ON, Canada, in 2007 and in 2013, respectively. He has five years of industrial experience in Networking with Libya & Telecom & Technology and with Schlumberger Overseas. Currently, he is a research associate at the University of Waterloo. His research interests include smart grid communication, network security, wireless sensor networks, and intelligent transportation systems.
KHALIFA et al.: SPLIT- AND AGGREGATED-TRANSMISSION CONTROL PROTOCOL
Atef Abdrabou (M’09) received the Ph.D. degree in electrical engineering from the University of Waterloo, Waterloo, ON, Canada, in 2008. In 2010, he joined the Department of Electrical Engineering, United Arab Emirates University, Al-Ain, Abu Dhabi, UAE, where he is an Assistant Professor. His research interests include smart grid communication, network resource management, quality-of-service provisioning, and information dissemination in self-organizing wireless networks. Dr. Abdrabou is a co-recipient of a Best Paper Award of IEEE WCNC 2010. In 2009, he received the National Science and Engineering Research Council of Canada (NSERC) postdoctoral fellowship for academic excellence, research potential, communication, and leadership abilities. He is an Associate Editor of the Journal of Circuits, Systems, and Computers.
Kshirasagar (Sagar) Naik received the B.Sc.Eng. degree from Sambalpur University, India, and the M. Tech. degree from the Indian Institute of Technology, Kharagpur, India. He received the M.Math degree in computer science from the University of Waterloo, Waterloo, ON, Canada, and the Ph.D. degree in electrical and computer engineering from Concordia University, Montreal, QC, Canada. He worked as a software developer in Wipro Technologies, Bangalore, for three years. Next, respectively. He worked as a faculty member at the University of Aizu in Japan and Carleton University in Ottawa. Currently, he is a full professor in the Department of Electrical and Computer Engineering at the University of Waterloo. He was a Co-Guest Editor of three special issues of IEEE JOURNAL ON SELECTED AREAS IN COMMUNICATIONS. He is an Associate Editor of Journal of Peer-to-Peer Networking and Applications, International Journal of Parallel, Emergent and Distributed Systems, and IEEE TRANSACTIONS ON PARALLEL AND DISTRIBUTED SYSTEMS. In addition, he is serving as the editor (Americas) of Journal of Circuits, Systems, and Computers. His research interests include dependable wireless communication, resource allocation in wireless networks, mobile computing, peer-to-peer communication, vehicular networks, energy efficiency of smart phones and tablet computers, energy performance testing of mobile apps, and communication protocols for smart power grids. He has published more than 140 research articles in international journals and conferences. His book entitled Software Testing and Quality Assurance: Theory and Practice (Wiley, 2008) has been adopted as a text in many universities around the world.
391
Maazen Alsabaan received the B.S. degree in the electrical engineering, from King Saud University, Saudi Arabia, in 2004, the M.A.Sc. and Ph.D. degrees in Electrical and Computer Engineering from University of Waterloo, Canada, in 2007 and 2013, respectively. He is currently an Assistant Professor in the Department of Computer Engineering, King Saud University, Saudi Arabia. His current research interests include vehicular networks, green communications, and Intelligent Transportation Systems.
Amiya Nayak received the B.Math. degree in computer science and combinatorics and optimisation from the University of Waterloo, Waterloo, ON, Canada, in 1981, and the Ph.D. in systems and computer engineering from Carleton University, Ottawa, ON, Canada, in 1991. He has over 17 years of industrial experience, working at CMC Electronics, Defence Research Establishment Ottawa, EER Systems and Nortel Networks, in software engineering, avionics and navigation systems, simulation and system level performance analysis. Currently, he is a Full Professor at the School of Information Technology and Engineering at the University of Ottawa, Canada. His research interests are in the areas of mobile ad hoc and sensor networks, fault tolerance, and distributed systems/algorithms, with over 150 publications in refereed journals and conference proceedings. Dr. Nayak is on the Editorial Board of IEEE TRANSACTIONS ON PARALLEL & DISTRIBUTED SYSTEMS, International Journal of Parallel, Emergent and Distributed Systems, International Journal of Computers and Applications, International Journal of Computer Information Technology and Engineering, International Journal of Computing and Information Science, International Journal of Autonomic Computing, and EURASIP Journal on Wireless Communications & Networking.
Nishith Goel received the M.A.Sc. degree in electrical engineering in 1978 and the Ph.D. degree in systems design engineering in 1983 from the University of Waterloo, Waterloo, ON, Canada. He is the CEO of Cistel Technology, Ottawa, ON, Canada, a technology consulting company he founded in 1995 which has operations in Canada and the U.S. A veteran technology executive and entrepreneur, Nishith is also co-founder of CHiL Semiconductor, IPine Networks and Sparq Systems. He began his professional career at Bell Northern Research in Ottawa in 1984 before moving on to Northern Telecom in 1988. His research interests are in the field of telecommunications and information technology. He has served on the boards of various technology companies and community organizations.