Original Article International Journal of Fuzzy Logic and Intelligent Systems Vol. 15, No. 4, December 2015, pp. 289-294 http://dx.doi.org/10.5391/IJFIS.2015.15.4.289
ISSN(Print) 1598-2645 ISSN(Online) 2093-744X
Saliency Score-Based Visualization for Data Quality Evaluation Yong Ki Kim1 and Keon Myung Lee2 Department of Computer Science, Chungbuk National University, Cheongju, Korea
Abstract Data analysts explore collections of data to search for valuable information using various techniques and tricks. Garbage in, garbage out is a well-recognized idiom that emphasizes the importance of the quality of data in data analysis. It is therefore crucial to validate the data quality in the early stage of data analysis, and an effective method of evaluating the quality of data is hence required. In this paper, a method to visually characterize the quality of data using the notion of a saliency score is introduced. The saliency score is a measure comprising five indexes that captures certain aspects of data quality. Some experiment results are presented to show the applicability of proposed method. Keywords: Data analysis, Visualization, Data quality analysis, Data quality metrics
1.
Received: Sep. 17, 2015 Revised : Sep. 24, 2015 Accepted: Sep. 25, 2015 Correspondence to: Keon Myung Lee (
[email protected]) ©The Korean Institute of Intelligent Systems
cc
This is an Open Access article distributed under the terms of the Creative Commons Attribution Non-Commercial License (http://creativecommons.org/licenses/ by-nc/3.0/) which permits unrestricted noncommercial use, distribution, and reproduction in any medium, provided the original work is properly cited.
289 |
Introduction
Most organizations and companies collect and maintain large volumes of data in the expectation that they may discover some information that is of value to their business. Garbage in, garbage out is a well-recognized idiom in data processing, representing that poor quality data may produce irrelevant or misleading analysis results. To obtain good intelligence from data, their quality should be guaranteed. Prior to their analysis, the quality of the data of interest should be evaluated, and hence, several data quality evaluation methods have been developed. [1–3] Data quality metrics have been proposed that evaluate data quality in terms of numeric values. Data quality can be evaluated either by subjective judgment or by objective measurement. Because there are various aspects of quality that concern analysts, data quality metrics are usually focused on only specific aspects. [1, 4, 5] Visualization techniques have also been used in the assessment of data quality. Visualization has been actively used to effectively summarize data and facilitate the analyzers’ perception of the underlying structures embedded in data. Outliers are closely related to data quality, although they do not always constitute errors or noise. A detected noticeable volume of outliers may imply that the data quality is poor. This paper is concerned with data quality metrics, based on the notion of a saliency score, that are developed in terms of outliers. The proposed data quality metrics utilize a visualization technique to provide a holistic view of data quality in terms of outliers. The remainder of this paper is organized as follows. Section 2 provides a brief introduction to data quality issues and in Section 3 the notion of a saliency score and the data quality metrics based on it are presented. Section 4 addresses a procedure for applying the metrics for
http://dx.doi.org/10.5391/IJFIS.2015.15.4.289
assessing data quality, and Section 5 presents the results of experimental in which the proposed method was applied. Finally, Section 6 gives our conclusions.
2.
Related Work
Data quality is of paramount concern for data analysts, because the validity of analysis results depends on it. Hence, data quality assessment is of considerable interest to practitioners. [1, 4, 5] Pipino et al. [1] addressed 16 subjective and objective data quality dimensions: accessibility, appropriate amount of data, believability, completeness, concise representation, consistent representation, ease of manipulation, free-of-error, interpretability, objectivity, relevancy, reputation, security, timeliness, understandability, and value-added. They also proposed three functional forms for developing objective data quality metrics: simple ratio, min or max operation, and weighted average. The simple ratio is the ratio of desired outcomes to the total number of outcomes, which gives a value from the interval 0-1. Such quality dimensions as free-of-error, completeness, and consistency can be evaluated using a functional form of the simple ratio. When multiple data quality dimensions are evaluated in terms of ratios and supposed to be aggregated into a single quantity, either the min or max operation can be employed to obtain a value in either the pessimistic or optimistic view. When the relative importance of each quality dimension can be specified, the weighted average can be used to obtain the overall quality. Heinrich et al. [2] presented six requirements that must be met in order for the data quality measures to hold: normalization, interval scale, interpretability, aggregation, adaptability, and feasibility. They proposed metrics for correctness and timeliness that meet these requirements. Their correctness measure computes the ratio of the distances between the data and real outcomes, and their timeliness measure is defined by an exponentially decaying function in terms of decline and age. The Environmental Protection Agency of the United States developed a data quality assessment (DQA) process that allows project managers and planners to determine whether the required data quality has been achieved. [3] The DQA process consists of the following five steps: review data quality objectives and sampling design; conduct a preliminary data review; select the statistical method; verify the assumptions; draw conclusions from the data. In the preliminary data review stage, statistical quantities and graphical representations are computed and created for the given data set in order to capture the information about data quality. www.ijfis.org
Outlier detection techniques are used to measure a certain aspect of data quality. Outlier detection can be a valuable validation method; however, not all outliers constitute errors. [1, 6, 7]
3.
Proposed Data Quality Evaluation Index
Although there are various types of data quality dimension, in this paper we propose a data quality index based on the distribution of outliers in the data. For data with only numerical attributes, many outlier detection methods have been developed [8–10]. Distance and distribution density can be easily defined in numerical space, and outliers are characterized according to the distance of specific data from other data or the sparseness of their neighborhoods. When evaluating the quality of data in a numerical space, the number of potential outliers is a good indicator of data quality. Most data usually contain both numerical and categorical attributes. Thus far, no distance or density functions for such data exist. It is therefore difficult to create outlier detection methods based on distance or density that will be widely accepted. A specific value that is rarely observed and that has a sparse neighborhood could be an outlier. According to this observation, we developed a new index to give a degree of outlierness to the specific value combination of an attribute set. To handle both numerical and categorical attributes together, the numerical attributes are discretized into intervals so that their continuous data spaces are partitioned into subspaces. When the number of values in the domain of a categorical attribute is large, similar or related categorical values can be grouped into clusters so that the value combination in the later analysis stage is of a manageable size. 3.1
Saliency Score
To assess the data quality, we evaluate the saliency of each data item in associated attribute sets. The data space in associated attribute sets is partitioned into subspaces and the distribution of data in the subspaces suggests the data quality in the data set. For description convenience, let DS = {di|i = 1, . . . , n} be a data set, AT be the set of attributes for DS, AS be a subset of attributes such that AS ⊆ AT , and ΠAS (DS) be the projection of the data set DS onto the data set AS. v(AS) denotes the set of attribute values that occur in ΠAS (DS). ai indicates a specific attribute value in v(AS), which is a combination of the attribute values on AS. In fact, ai corresponds to a subspace on AS, because the discretization of numerical attributes is Saliency Score-Based Visualization for Data Quality Evaluation
| 290
International Journal of Fuzzy Logic and Intelligent Systems, vol. 15, no. 4, December 2015
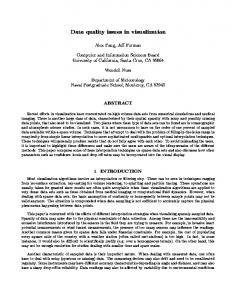
role of a normalizing factor, which penalizes attributes with a certain number of spaces. When pi ≥ p ¯, the data ai are frequently observed, and hence, they cannot be outliers in terms of frequency. Thus, the saliency degree of data with higher probability is ignored, because they cannot be outliers in the perspective of statistics. Figure 1 shows the behavior of the function −(1/pi) log2 pi .
Figure 1. Plot of −(1/pi) (log2 pi − log2 |v(AS)|). assumed to be complete and the values of categorical attributes may be clustered into groups based on their similarity. In a partitioned space constructed according to the abovementioned strategy, when a subspace contains a very small number of data, the data falling into the subspace potentially constitute outliers and possibly noise. An effective method to easily determine the characteristics of data is therefore required. As such a method, we propose a new index called the saliency score, which is sensitive to outliers in data assessment. The saliency score SC(AS, ai) for data ai over subspace AS is defined as ( ¯; − p1i {log2 pi − log2 |v(AS)|} if 0 < pi ≤ p SC(AS, ai) = 0 otherwise. (1) Here, |v(AS)| indicates the number of elements in v(AS), pi is the ratio of data records di with attribute value ai for the attribute set AS to the data set DS, and p ¯ is the mean value of pi over v(AS).
The saliency score has the following properties. First, the value given to data increases as the frequency of the data decreases; second, its values are always non-negative; and third, a value of 0 is given to data that cannot be regarded as outliers. 3.2
Saliency Score-Based Outlier Indicators
The saliency score is defined for each data record and a larger score is given to infrequent value combinations. To achieve a general picture of the quality of a data set, the saliency scores need to be aggregated into a number. Instead of taking a single quality value, in this study we used an approach that uses multiple quality values, focusing on different aspects. The saliency scores of data are relative values, which means that when the score of one data record is high, certain others are discounted. maxSC = max SC(AS, ai)
(4)
X
(5)
ai∈AS
avgTopk SC =
SC(AS, ai)/k
SC(AS,ai)∈topk of SC
P {di|ΠAS (di) ∈ ai and ΠAS (di) ∈ ΠAS (DS)} pi = |DS|
(2)
Here, ΠAS (di) denotes the projection of data di onto the attribute set AS and ΠAS (di) ∈ ai means that the projected value ΠAS (di) belongs to the subspace corresponding to ai , which is expressed in discretized values for continuous attributes and, if needed, in clustered representative values for categorical attributes. P ai∈ΠAS (DS) pi p ¯= (3) |v(AS)| In Eq. (1), log2 pi is the amount of information content, well-known in information theory, which gives a higher value to rare cases. When log2 pi is multiplied by 1/pi , its value becomes more sensitive to smaller pi values. The larger |v(AS)| is, the smaller is pi , and hence, ΠAS (DS)pi|v(AS)| comes the data set with large at −1/pi{log2 pi}. − log2 |v(AS)| plays the 291 | Yong Ki Kim and Keon Myung Lee
avgSC =
ai∈v(AS) SC(AS, ai)
entropy = −
|v(AS)| X
pi log2 pi
(6)
(7)
ai∈AS
maxSC is the maximum saliency score value for the possible attribute values. When a value larger than maxSC is observed, this implies that a record with very low frequency exists. avgTopk SC indicates the average of the top k saliency scores, where k is a pre-specified number. When k attributes are likely outliers, avgTopk SC has a higher value. avgSC is the average of the saliency scores over all the attributes. entropy is the well-known measure of the amount of information. When the distribution of a data set is uniform over a space, the entropy has a larger value. Since the maximum possible entropy is log |V (AS)|, we can obtain an idea of the degree of the skewness of data distribution by measuring the difference between
http://dx.doi.org/10.5391/IJFIS.2015.15.4.289
entropy and log |V (AS)|. The data quality plot for data set D with attribute set AS is defined as a radiation plot with axes maxSC, avgTopk SC, avgSC, and entropy. 3.3
Ranking Method for Suspicious Subspaces
Our data quality evaluation method attempts to find the subspaces in which noticeable outliers may exist and where the data quality characteristics are displayed. The saliency score gives information about the extent to which the corresponding attribute value is outstanding with respect to other values in the subspace under consideration, but its value is a relative quantity affected by the frequency of other values. In order to compare the data quality of one subspace with that of another, their values must be comparable. To achieve this, we first normalize the saliency scores so that the largest score becomes 1 by dividing the scores by the largest one: nSC(AS, ai) =
SC(AS, ai) maxj {SC(AS, aj )}
(8)
The next step is to rank the subspaces according to the possibility that they contain outliers. The proposed method uses the following ranking score RS for attribute set AS: RS(AS) =
m X
SC(AS, a(i))
(9)
i=1
Here, SC(AS, a(i)) is the i-th largest score among all the saliency scores on AS, and m indicates the number of attribute value combinations under consideration, which is determined when multiple attribute sets are considered. For an attribute set AS the saliency scores are computed for the distinct value combinations appearing in data set DS. The number of distinct value combinations depends on attribute sets. The larger the ranking score, the greater the possibility that the subspace contains more outliers. For candidate attribute subsets, the proposed method computes the ranking scores and suggests a small number of subspaces to the analysts for further visual review.
4.
Data Quality Visualization Using Saliency Scores
The saliency score counts the frequency of the combinations of values across related attributes. Increase in dimensionality of attributes makes such counting difficult because the number www.ijfis.org
of frequency for possible combination grows too small which make it difficult to discriminate normal cases from outliers. When applying the saliency score-based metrics, associated attributes are first identified. Usually, sets of attributes of size not greater than 4 are discovered as candidate subspaces on which data quality is evaluated. Various methods have been developed to select associated attributes, such as χ2 -measure [11] and association rule mining techniques [12]. The χ2 -measure evaluates the difference between real frequencies and expected frequencies. The expected frequencies are determined under the assumption that the attributes are independent each other. It treats the cases with large differences as associated one. Association rule mining techniques are used to identify frequent value combinations observed in a data set. They are basically applied to discrete or categorical attribute values. For numeric attributes, therefore, their domains are discretized by utilizing widely used techniques, such as those involving equi-length and equi-frequency. Using an association rule mining algorithm like Apriori [12], the frequent attribute value combinations are first selected, and then attribute sets are selected as associated attribute sets when they contain at least as many as frequent attribute value combinations as the pre-specified threshold. For each associated attribute set, its saliency score of data are evaluated and its ranking score RS are also computed. When the ranking score is computed, the upper index m for the ranking score computation is determined to be the smallest value of the number of value combinations for the selected attribute sets. The attribute sets with the top-k ranking score are determined as the candidates of suspicious attribute subspaces. For the attribute sets, their radar plots are generated using the scores in the decreasing order of ranking scores. They attribute sets are then suggested for further evaluation by the analysts.
5.
Experiments
To show the applicability of the proposed method, experiments were conducted. In the experiment, the bank marketing data set from UCI Machine Learning Repository [13] was used, which consists of 45,211 data records with 17 attributes. In the experiments, we selected the associated attribute sets using the Apriori algorithm, where the attribute sets of size 3 or 4 are selected when they contain at least 8 frequent attribute value combinations in themselves. For the selected attribute sets, the saliency scores of the data set were computed using Eq. (1). Saliency Score-Based Visualization for Data Quality Evaluation
| 292
International Journal of Fuzzy Logic and Intelligent Systems, vol. 15, no. 4, December 2015
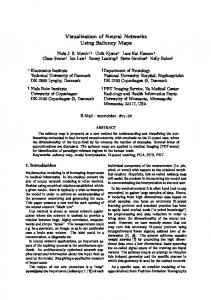
Figure 2. Data quality plot for a set of associated attributes of the original bank marketing data. To visualize the data quality with respect to a certain attribute set, we computed maxSD, avgTopk SD, avgSD, and entropy for the attribute set, where avgTopk 0.01% and avgTopk 0.05% averages were computed. Figure 2 shows the data quality visualization result for an attribute set of the original bank marketing data set. To show the effects of outliers on the measures, we added noise to the data set. Figure 3 shows the visualization results for the same attribute set of the noise-added data set. When noises are contained, the change difference between maxSD and avgTopk 0.01% is relatively small, and the change difference between avgTopk 0.01% and avgTopk 0.05% is relatively large. The rank score RS for each selected attribute set was computed in which m was set to the smallest number of value combinations among all considered attribute sets. In the experiments, 43 attribute sets were selected as associate ones and top 4 attribute sets were suggested as suspicious ones. To see the quality evaluation capability of the proposed method, we inserted some random noises into 5 attributes and checked whether such attributes were detected as members of suspicious subspaces. On 10 times repetitions of the experiments, it was observed that all those noise-contaminated attributes were successfully found in the top-5 attribute sets.
6.
Conclusions
Data quality is an important concern for analysts. We proposed a new visualization-based data quality evaluation method, which examines the outliers in data sets. The notion of a saliency score was proposed, which considers the rare occurrence of combination values in the associated attributes set. Our experimental results showed that the proposed saliency score 293 | Yong Ki Kim and Keon Myung Lee
Figure 3. Data quality plot for a set of associated attributes of noiseinserted bank marketing data. effectively elicits the existence of outliers in the data set.
Conflict of Interest No potential conflict of interest relevant to this article was reported.
Acknowledgements This research was supported by the MSIP (Ministry of Science, ICT and Future Planning), Korea, under the ITRC (Information Technology Research Center) support program (NIPA-H850115-1013) supervised by the NIPA (National IT Industry Promotion Agency).
References [1] L. L. Pipino, Y. W. Lee, and R. Y. Wang, “Data quality assessment,” Communications of the ACM, vol. 45, no. 4, pp. 211-218, 2002. http://dx.doi.org/10.1145/505248. 506010 [2] B. Heinrich, M. Kaiser, and M. Klier, “How to measure data quality? A metric-based approach,” in Proceedings of the 28th International Conference of Information Systems (ICIS), Montreal, Canada, 2007, pp. 1-15. [3] US Environmental Protection Agency, “Data quality assessment: statistical methods for practitioners,” US Environmental Protection Agency, Washington, DC, EPA/240/B06/003, 2006. [4] A. D. Chapman, Principles of Data Quality. Copenhagen: Global Biodiversity Information Facility, 2005.
http://dx.doi.org/10.5391/IJFIS.2015.15.4.289
[5] R. Y. Wang and D. M. Strong, “Beyond accuracy: what data quality means to data consumers,” Journal of Management Information Systems, vol. 12, no. 4, pp. 5-33. 1996. [6] E. M. Knorr and R. T. Ng, “Finding intensional knowledge of distance-based outliers,” in Proceedings of the 25th International Conference on Very Large Data Bases (VLDB), Edinburgh, Scotland,1999, pp. 211-222. [7] M. M. Breunig, H. P. Kriegel, R. T. Ng, and J. Sander, “LOF: identifying density-based local outliers,” in Proceedings of the 2000 ACM SIGMOD International Conference on Management of Data, Dallas, TX, 2000, pp. 93-104. http://dx.doi.org/10.1145/342009.335388 [8] D. M. Hawkins, Identification of Outliers. London: Chapman and Hall, 1980. [9] H. P. Kriegel, P. Kroger, and A. Zimek, “Outlier detection techniques,” presented at the 13th Pacific-Asia Conference on Knowledge Discovery and Data Mining (PAKDD), Bangkok, Thailand, April 27-30, 2009. [10] K. P. Murphy, Machine Learning: A Probabilistic Perspective. Cambridge, MA: MIT press, 2012. [11] C. M. Bishop, C. M. (2006). Pattern Recognition and Machine Learning. New York, NY: Springer, 2006. [12] C. C. Aggarwal, Data Mining: The Textbook. Cham, Switzerland: Springer, 2015.
www.ijfis.org
[13] G. Merz and P. Murphy, “UCI repository of machine learning databases,” Department of Information and Computer Science, University of California, Irvine, CA, Technical Report, 1996. Yong Ki Kim is a graduate student in the Dept. of Computer Science of Chungbuk National University. He received his B.S. in computer science from the Chungbuk National University. His research interests include big data processing and data mining.
Keon Myung Lee is a professor in the Department of Computer Science, Chungbuk National University, Korea. He received his B.S., M.S., and Ph.D. degrees in computer science from KAIST, Korea and was a post-doctorate fellow at INSA de Lyon, France. He was a visiting professor at the University of Colorado at Denver and a visiting scholar at Indiana University, USA. His principal research interests are data mining, machine learning, soft computing, big data processing, and intelligent service systems.
Saliency Score-Based Visualization for Data Quality Evaluation
| 294