page of GLIMMPSE, we input âtimeâ in the âUnitsâ text box to ... repeated measures, a dropdown âHypothesis Typeâ ... Therefore, we input the expected baseline.
STATISTICS AND RESEARCH DESIGN
Sample-size calculation for repeated-measures and longitudinal studies Yi Guoa and Nikolaos Pandisb Gainesville, Fla, Corfu, Greece, and Bern, Switzerland
I
n orthodontic research, investigators often design studies in which the main response variable is measured repeatedly over time. Compared with cross-sectional designs, repeated-measures designs allow a more definitive evaluation of within-person changes in the response variables across time. Moreover, collecting repeated measures can increase statistical power for detecting differences. Thus, fewer participants are required for conducting a study. Despite the many advantages of repeated-measures designs, sample-size calculation for such designs is difficult because repeated measurements taken from the same participant are correlated. To compute a sample size, the researcher must specify the expected correlation pattern in the repeated measurements and find a software package that allows such a pattern.1 In addition, many other inputs are also needed for sample-size calculation. In this article, we provide a step-by-step guide for how to calculate a sample size for repeated-measures designs. First, we discuss the greatest challenges of sample-size calculation for repeated-measures and longitudinal studies. Second, using an orthodontic example trial in which we compare the effectiveness of 2 appliances on overjet reduction, we guide the reader through the steps of sample-size calculation.
THE CHALLENGES Choosing a primary hypothesis
Sample-size calculation is based on a particular hypothesis of the study. The researcher must choose a primary hypothesis and base the sample-size calculation on a Assistant professor, Department of Health Outcomes and Policy, College of Medicine, University of Florida, Gainesville, Fla. b Private practice, Corfu, Greece; visiting assistant professor, Department of Orthodontics and Dentofacial Orthopedics, Faculty of Medicine, University of Bern, Bern, Switzerland. Yi Guo's support included NIH/NIDCR 1R01DE020832 and NIH/NIDCR 1U54DE019261. Address correspondence to: Yi Guo, Department of Health Outcomes and Policy, College of Medicine, University of Florida, PO Box 100177, Gainesville, FL 32610-0177; e-mail, yiguo@ufl.edu. Am J Orthod Dentofacial Orthop 2015;147:146-9 0889-5406/$36.00 Copyright Ó 2015 by the American Association of Orthodontists. http://dx.doi.org/10.1016/j.ajodo.2014.10.009
146
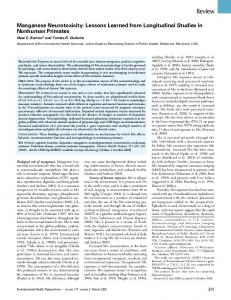
that hypothesis. With repeated measures, the researcher could possibly choose to test a several hypotheses. The treatment-by-time interaction hypothesis is usually of most interest. This hypothesis tests whether the trend of the response variable across time is the same between the treatment and the control groups. The Figure is an example of a treatment-by-time interaction. The change in overjet across time is assumed to be linear in both groups, and we could test whether the rate of overjet change differs between the treatment and control groups during the 18-month study period. Another possible hypothesis is the main-effect hypothesis, where we can test the effect of a particular predictor variable averaged across all other factors. For example, we could test whether the responses of participants in the treatment group differ from those of participants in the control group, averaged across all the repeated measurements. Specifying the variances and correlations among the repeated measurements
A big challenge in sample-size calculation for repeated-measures designs is that the researcher must specify the variances (or standard deviations) and the correlations among the repeated measurements. With 4 repeated measurements, 4 variance or standard deviation values and 6 correlation values need to be specified. To compute an accurate sample size, the specified values should match as closely as possible the values expected to be observed in the data.2 To specify the variance values, it is often possible to estimate one variance value based on a previous study or to make an educated guess based on experience and then specify the other variance values based on the expected variance trend across time. To determine the variance trend across time, the scientific context often provides a reasonable model for variance change. For example, disease development often leads to monotonically increasing the variance among repeated measurements of responses. Often, we can assume that the variance stays constant across time. To estimate the correlations, the same principles for specifying variances apply. We first estimate one
Statistics and research design
147
that there are no particular correlation patterns and that each correlation between any 2 repeated measurements is unique and needs to be specified. The number of correlations that need to be specified is p 3 (p 1)/2, where p is the number of repeated measurements. Assuming “unstructured” correlations requires estimating the most correlations. Moreover, the number of correlations that needs to be specified increases dramatically as the number of repeated measurements increases. Choosing an appropriate software Fig. Illustration of an interaction between the treatment and the trend of overjet. The graph shows that the 2 lines are not parallel, indicating a treatment-by-time interaction. On the y-axis, on average the control and the treatment groups start with similar average overjets; however, with time, the reduction in overjet is greater in the treatment group compared with the control group.
correlation value based on a previous study or an educated guess, and then we specify the other correlation values based on the expected correlation patterns. Three types of correlation patterns can be considered, in increasing complexity: equal correlations, rule-based patterns, and “unstructured” correlations (no specific pattern). The simplest pattern of correlations assumes a constant correlation among the repeated measurements. However, this pattern is often not valid in longitudinal studies because measurements taken farther apart in time are usually less correlated than measurements taken closer in time. For instance, in our example study of overjet reduction, we would expect the correlation between the baseline measurement and the 6-month measurement to be larger than the correlation between the baseline measurement and the 12-month measurement. A more realistic hypothesis is that correlations among repeated measurements decline exponentially with time. In this case, we could consider modeling the decline in correlation with a rule-based pattern. A commonly used pattern is the first-order autoregressive, which belongs to the linear exponent first-order autoregressive family.3 Using the more general linear exponent first-order autoregressive model requires providing 2 correlation parameters: the base correlation and the decay rate. The base correlation is the correlation between 2 measurements taken next to each other in time. The decay rate is the rate of decline in base correlation as time between repeated measurements increases. Our experience with biologic and behavioral data leads us to suggest specifying a decay rate between 0.05 and 0.5. Finally, we could assume
Currently, there are only a few software packages or programs that compute sample sizes for a limited range of repeated-measures and longitudinal designs. Therefore, it is crucial that the researcher carefully chooses a program that can support the assumptions of the study design. For example, if a program operates under the assumption of equal correlation among repeated measurements, this program is most likely unsuitable for computing sample sizes for longitudinal studies, for which the assumption of equal correlations is rarely true. Another challenge is that powerful sample-size programs may require strong knowledge in statistical theories and programming skills.4 Few graphical user interface sample-size programs have the ability to support longitudinal designs and various variance and correlation patterns. PASS (NCSS) and GLIMMPSE (http://glimmpse.samplesizeshop.org/) are graphical user interface programs designed for applied researchers.5,6 PASS is a commercial product that must be purchased and installed on a computer. GLIMMPSE is a free, Internet-based program. Both programs support repeated-measures and longitudinal designs and require no programming experience. THE EXAMPLE
In this section, we provide a step-by-step tutorial on how to calculate a sample size for repeated-measures and longitudinal studies using the “guided study design” mode of GLIMMPSE. We show what information is needed and how to gather the information. Readers are reminded that although GLIMMPSE is the choice of samplesize program in this example, the same information is required even if another software program is preferred. Overview of the orthodontic study
In the study being planned, the researcher is interested in comparing the effect of the Twin-block appliance with the headgear appliance on overjet reduction. Patients eligible for the study are those between the ages of 10 and 13 years, and with overjet greater than
American Journal of Orthodontics and Dentofacial Orthopedics
January 2015 � Vol 147 � Issue 1
Statistics and research design
148
Table. Steps and inputs for sample-size calculation Step Specify a power value
Input Statistical power:
0.8
Specify the model
Response: Repeated measures: Predictor: Primary hypothesis: Statistical test: Type I error:
Overjet 4 (T1 5 0, T2 5 6, T3 5 12, T4 5 18 months) Twin-block appliance vs headgear Treatment-by-time interaction Hotelling-Lawley Trace 0.05
Twin-block (0.35 mm/mo): Headgear (0.30 mm/mo): Standard deviations: Correlations:
T1 5 0 mm, T2 5 2.1 mm, T3 5 4.2 mm, T4 5 6.3 mm T1 5 0 mm, T2 5 1.8 mm, T3 5 3.6 mm, T4 5 5.4 mm Constant (1.2 mm) LEAR (base correlation 5 0.7; decay rate 5 0.5)
Specify the hypothesis
Specify the mean values Specify the standard deviations and correlations LEAR, Linear exponent first-order autoregressive.
8 mm, no craniofacial syndrome, and no previous orthodontic treatment. Eligible patients who consent to participate in the trial are randomly assigned to either the Twin-block group or the headgear group. After treatment initiation, overjets in the 2 groups of patients will be measured repeatedly across time during their revisits. The steps and inputs for computing a sample size are summarized in the Table. The calculation with GLIMMPSE is also demonstrated in the Video (available at www.ajodo.org.) 1. Specify a power value. A power value is a number between 0 and 1, and it is usually set at 0.8 or 0.9. In the example, we chose 0.8 for calculation. 2. Specify the model. Specifying the model requires the researcher to define the response and predictor variables, determine the number of repeated measurements and the spacing in them, and determine the relative group sizes. In GLIMMPSE, we name the main response variable “overjet,” which is a continuous variable measured in millimeters. The researcher decides to measure overjet 4 times with equal spacing between measurements: at 0 month (baseline), 6 months later, 12 months later, and 18 months later. On the “Repeated Measures” page of GLIMMPSE, we input “time” in the “Units” text box to indicate that the measurements will be taken over time. The spacing in the repeated measurements is determined based on the researcher's knowledge of how the treatments affect overjet over time. We name the main predictor variable of interest “treatment,” which has 2 categories: Twin-block appliance and headgear appliance. Finally, we assume equal numbers of patients in the treatment groups. 3. Specify the hypothesis. In this step, we need to choose the primary hypothesis, a statistical test, and a type I error rate. For the overjet reduction
January 2015 � Vol 147 � Issue 1
4.
study, the researcher is primarily interested in testing whether the trend of overjet is different between the group using the Twin-block appliance and the group using the headgear appliance. Therefore, the primary hypothesis of the study is a test of whether there is a treatment-by-time interaction. In GLIMMPSE, after specifying the variables and the repeated measures, a dropdown “Hypothesis Type” menu with all possible hypotheses will appear. To specify our primary hypothesis, we select “Interaction” from the menu and then choose “treatment” under “Between Participant Factor” and “time” under “Within Participant Factors.” Several multivariate tests are available for repeated-measures designs. They include the Hotelling-Lawley Trace test, the Pillai-Bartlett Trace test, and the Wilks lambda test. There are also several univariate approaches that could treat repeated measures. The choice of the most powerful statistical test depends on the specific study design and the hypothesis of interest. In our example, we chose the Hotelling-Lawley Trace test, which is recommended for many repeatedmeasures designs.7 A detailed discussion of the guidelines for choosing a statistical test for sample-size calculation is available on the GLIMMPSE Web site.7 The type I error rate is set at 0.05 for our sample-size calculation. Specify the mean values. Next, the researcher needs to specify the expected mean values for the response variable in each treatment group at each time point. In the study being planned, the researcher expects that the overjet reduction rate with the headgear appliance will be on average 0.3 mm per month. In addition, the researcher considers a clinically important difference to be an average overjet reduction rate of 0.35 mm per month using the
American Journal of Orthodontics and Dentofacial Orthopedics
Statistics and research design
5.
Twin-block appliance. Because of the randomization of treatment, we assume that the average overjet at baseline is the same for the 2 treatment groups. Therefore, we input the expected baseline overjet reduction values at 0 for both treatment groups. At 6 months, the expected overjet reduction values are 0.3 3 6 5 1.8 mm for the headgear group, and 0.35 3 6 5 2.1 mm for the Twinblock group. Following the same computation routine, the expected overjet reduction values are 3.6 and 4.2 mm at 12 months, and 5.4 and 6.3 mm at 18 months, for the headgear and Twinblock groups, respectively. For this example, we provide the overjet reduction values instead of the actual overjet values because the former are slightly easier to specify. Providing the actual overjet values will yield the same sample-size value as long as the expected reduction rates are the same. Specify the standard deviations and correlations. It is assumed that the standard deviations of overjet measurements range from 0.5 to 1.2 mm. To be conservative, we chose 1.2 mm as the input for sample-size calculation. For correlations, we chose to use a linear exponent first-order autoregressive pattern for estimation. The researcher estimates the correlation between 2 overjet measurements that are 6 months apart to be 0.7. Assuming a conservative decay rate of 0.5, we input 0.7 under “Base Correlation” and 0.5 under “Decay Rate” in GLIMMPSE. After specifying the 2 parameters required by the linear exponent first-order autoregressive model, the estimated correlations are generated. The researcher should examine the estimated correlations and adjust the decay rate to find the most suitable correlation pattern for the study being planned.
Sample-size results
Based on the inputs we made, the total sample size was computed to be 66. Considering an attrition rate
149
of 10%, the final total sample size was 66 O (1 10%) z 74. Since we assumed equal group sizes, the researcher would need 37 patients in the headgear group and another 37 patients in the Twin-block group for the selected assumptions. The computed sample size changes if any of the estimated input values changes. Therefore, we recommend that the researcher examine a range of values for the inputs in which some flexibility is allowed. In our example, we could also perform sample-size calculations varying the value of the expected standard deviation of overjet, since the literature suggests a range of 0.5 to 1.2 mm. Computing multiple sample sizes with a range of input values helps the researcher better balance between the precision needed to meet the research goals and the cost of having more participants. SUPPLEMENTARY DATA
Supplementary data related to this article can be found in the online version at http://dx.doi.org/10. 1016/j.ajodo.2014.10.009. REFERENCES 1. Guo Y, Logan HL, Glueck DH, Muller KE. Selecting a sample size for studies with repeated measures. BMC Med Res Methodol 2013;13: 100. 2. Muller KE, Lavange LM, Ramey SL, Ramey CT. Power calculations for general linear multivariate models including repeated measures applications. J Am Stat Assoc 1992;87:1209-26. 3. Simpson SL, Edwards LJ, Muller KE, Sen PK, Styner MA. A linear exponent AR(1) family of correlation structures. Stat Med 2010; 29:1825-38. 4. Johnson JL, Muller KE, Slaughter JC, Gurka MJ, Gribbin MJ, Simpson SL. POWERLIB: SAS/IML software for computing power in multivariate linear models. J Stat Softw 2009;30:1-27. 5. Hintze J. PASS 12. Kaysville, Utah: NCSS, LLC; 2013. Available at: www.ncss.com. 6. Kreidler SM, Muller KE, Grunwald GK, Ringham BM, CokerDukowitz ZT, Sakhadeo UR, et al. GLIMMPSE: online power computation for linear models with and without a baseline covariate. J Stat Softw 2013;54:1-26. 7. Kreidler SM, Bar�on AE, Glueck DH. Tutorial: selecting a test. Available at: http://samplesizeshop.org/files/2012/12/Tutorial_ SelectingATest.pdf. Accessed September 21, 2014.
American Journal of Orthodontics and Dentofacial Orthopedics
January 2015 � Vol 147 � Issue 1


![Reading for pleasure - Centre for Longitudinal Studies - IoE [PDF]](https://m.moam.info/img/260x300/reading-for-pleasure-centre-for-longitudinal-studi_647c3bd9098a9e686a8b45b4.jpg)