is responding to the user's input and notifies the user of changes of the system's ... Effective feedback should be timely and presented as close to the ..... Result: The system adds the current sampling line to the sample, and starts a new line.
SAMPLETALK: A SPEECH-ENABLED APPLICATION FOR PLANT STAND SAMPLING
By Xiaofeng Ma
A Directed Project Submitted to the Faculty of Mississippi State University in Partial Fulfillment of the Requirements for the Degree of Master Science in Computer Science in the Department of Computer Science Mississippi State, Mississippi May 1997
ACKNOWLEDGMENTS
I wish to express sincere appreciation to Dr. Susan Bridges, my major advisor, for her guidance, supervision, support, and encouragement during the whole process. Great appreciation is given to Dr. Jeffery Willers of USDA/ARS for his help and support. Dr. Willers has given me his generous help during the whole project with his expertise and experience in statistics and sampling techniques. I express my gratitude to Dr. Donald Dearholt. Dr. Dearholt’s instruction in Human-Computer Interaction give me a lot of help in this project. I am grateful to Dr. Gene Boggess for being on my committee. I am also grateful to the entire Computer Science faculty for their help. Special thanks is given to USDA/ARS/CSRU for supporting this project. Finally, for the sacrifice, understanding, and inspiration from my family, I am forever grateful.
ii
TABLE OF CONTENTS Page ACKNOWLEDGMENTS......................................................................................... ii LIST OF FIGURES ................................................................................................. iv LIST OF TABLES................................................................................................... vi CHAPTER I. INTRODUCTION ................................................................................... 1 Speech-Enabled Applications.................................................................... 1 Overview of Plant Stand Sampling............................................................ 3 Software Requirements ............................................................................ 3 II. INTERFACE DESIGN ........................................................................... 6 Defining the Vocabulary and Grammar..................................................... 6 System Feedback .................................................................................... 10 Error Recovery and Human-Computer Dialog ........................................ 11 Graphical User Interface......................................................................... 13 III. SYSTEM DESIGN AND DEVELOPMENT ......................................... 15 Design Methodology and Tools .............................................................. 15 System Analysis ..................................................................................... 16 Software Design ..................................................................................... 28 Implementation ...................................................................................... 41 IV. TESTING .............................................................................................. 43 V. CONCLUSIONS.................................................................................... 46 Future Work .......................................................................................... 47 REFERENCES ...................................................................................................... 48 APPENDIX A. PROJECT CONTRACT ......................................................................... 50
iii
LIST OF FIGURES
Figure
Page
1.1. Basic Elements of the Plant Stand Sampling Process........................................ 4 2.1. State Transition Diagram for Speech Input .................................................... 12 3.1. Object Model ................................................................................................ 17 3.2. System Object Model .................................................................................... 18 3.3. Scenario for Add New Field Name................................................................ 20 3.4. Scenario for Speech Input of Sample Data..................................................... 21 3.5. Scenario for Analysis..................................................................................... 21 3.6. Life-cycle Model........................................................................................... 22 3.7. Schema for start_sampling............................................................................. 22 3.8. Schema for specify_field_name...................................................................... 23 3.9. Schema for specify_unit................................................................................. 23 3.10. Schema for quit_sampling.............................................................................. 23 3.11. Schema for new_unit..................................................................................... 24 3.12. Schema for new_line...................................................................................... 24 3.13. Schema for input_data................................................................................... 24 3.14. Schema for correction.................................................................................... 25 3.15. Schema for close ........................................................................................... 25 3.16. Schema for start_analysis_g........................................................................... 25 3.17. Schema for select_field ................................................................................. 26 3.18. Schema for select_unit................................................................................... 26 3.19. Schema for select_sample.............................................................................. 26 3.20. Schema for start_analysis_t............................................................................ 27 3.21. Schema for select_field_t............................................................................... 27 iv
3.22. Schema for start_add_field_name.................................................................. 27 3.23. Schema for new_field_name.......................................................................... 28 3.24. Schema for compile....................................................................................... 28 3.25. Object Interaction Graph for start_sampling................................................... 29 3.26. Object Interaction Graph for specify_field_name............................................ 29 3.27. Object Interaction Graph for specify_unit...................................................... 30 3.28. Object Interaction Graph for quit_sampling................................................... 30 3.29. Object Interaction Graph for new_unit........................................................... 31 3.30. Object Interaction Graph for new_line........................................................... 31 3.31. Object Interaction Graph for input_data......................................................... 32 3.32. Object Interaction Graph for correction ......................................................... 32 3.33. Object Interaction Graph for close................................................................. 33 3.34. Object Interaction Graph for start_analysis_g................................................. 33 3.35. Object Interaction Graph for select_field ....................................................... 33 3.36. Object Interaction Graph for select_unit ........................................................ 34 3.37. Object Interaction Graph for select_sample.................................................... 34 3.38. Object Interaction Graph for select_field _t.................................................... 35 3.39. Object Interaction Graph for start_analysis_t................................................. 36 3.40. Object Interaction Graph for start_add_field_name........................................ 36 3.41. Object Interaction Graph for new_field_name................................................ 36 3.42. Object Interaction Graph for compile............................................................. 36 3.43. Visibility Graph for Mic_speaker................................................................... 37 3.44. Visibility Graph for Field............................................................................... 38 3.45. Visibility Graph for Unit................................................................................ 38 3.46. Visibility Graph for Sample............................................................................ 39 3.47. Visibility Graph for Line................................................................................ 39
v
LIST OF TABLES
Table
Page
2.1 Error Rate for Digit-by-digit and Cardinal Methods............................................ 8 3.1 Data Dictionary................................................................................................ 40 4.1 Error Rates and Input Speed using SampleTalk and the Keyboard................... 44
vi
CHAPTER I INTRODUCTION
Plant stand sampling is an important method for monitoring plant growth and production. To do the sampling, the user typically goes to a field, manually records the data, and then comes back and types this data into the computer. This procedure is timeconsuming and requires a lot of effort by the user. Also, the user needs to enter the data twice, once on the data sheet and again on the computer. This increases the potential error rate. The purpose of this project is to design a software system (SampleTalk) to facilitate the sampling process. Plant stand sampling is a typical hand/eye busy application. Speech interfaces allow users to interact with a computer by voice. In the plant stand sampling case, the goal is to allow the user to enter data directly into the computer using voice while doing the sampling in the field.
Speech Enabled Applications Speech is the most natural and widely-distributed human communication method. A speech-enabled application allows the user to interact with the computer by voice. It will recognize the user’s speech input and extract the meaning based on the application context. Speech-enabled applications can be used in many areas, such as command and control systems, information retrieval, and multilingual and multimedia interactions (Cole
1
2
et al. 1995). Speech-enabled applications have some advantages in the situation when the user’s hands and eyes are busy with something else. Under that circumstance, traditional keyboard/screen user-computer interaction is inconvenient. Speech provides an additional communication channel between the user and the computer. Speech-enabled applications will support man-machine interaction in a natural way that requires no special training. However, there are several problems that need to be solved before speech-enabled applications can reach their full potential. Speech-enabled applications must be “ robust at all levels, so that they handle background or channel noise, the occurrence of unfamiliar words, new accents, new users, or unanticipated inputs. They must exhibit more intelligence, knowing when they don’t understand or only partially understand something, and interacting with the user appropriately to provide conversational repairs and graceful degradation.”(Cole et al. 1995, 1) Today, there are many applications using speech as a user-computer interaction method. Among them, CottonTalk, a speech-enabled application for cotton plant mapping has been developed cooperatively by the Computer Science Department at Mississippi State University and Crop Simulation Research Unit of the United States Department of Agriculture(USDA)/Agricultural Research Service(ARS) (Liang et al. 1996). CottonTalk allows the user to input cotton plant mapping data by voice. CottonTalk has provided a very useful example for this project.
3
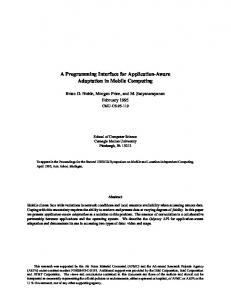
Overview of Plant Stand Sampling The purpose of this project is to design a speech-enabled application for plant stand sampling. The line-intercept sampling method will be used in this project (McDonald 1991). In the line-intercept sampling method, a baseline is established which is parallel to the rows. Then, transect lines are randomly positioned at right angles to the baselines. Plant data are collected from rows in a 3 feet wide area intercepted by transect lines. Transects may be of variable line lengths. Also, the number of transect lines may be different for each sample. From a crop management perspective, each farm is divided into several fields. Each field has a field name. Each field can also be subdivided into several management units. Sample data are collected based on each unit. Figure 1.1 shows the basic elements of the plant stand sampling process. Statistical methods will be applied to analyze the sample data. Crop attributes such as estimated yield of the unit can be obtained from such an analysis. The results of the analysis will provide information for the farmer to make decisions such as whether or not to re-plant. Software Requirements The system requirements were acquired by interaction with the user. The user for this project is Dr. Jeff Willers of the Crop Simulation Research Unit/USDA/ARS. First, the user provided an outline of task the system should accomplish. Then the developer observed the user conducting the current sampling process in the field to give a better view of the task to be accomplished. The requirements were further specified based on observations of the actual sampling process.
4
Field Row
MU
Transect lines
MU Sample width MU Base line Management unit
MU
Figure 1.1 Basic Elements of the Plant Stand Sampling Process
The name SampleTalk will be used to refer to the system that has been developed. The software requirements state that SampleTalk will allow the user to enter plant stand data for a management unit and will perform analysis on the sampling data. The data entry task will be speech-enabled, while the interface for the analysis task will be a graphical user interface (GUI). SampleTalk will archive sample data from multiple management units, from multiple fields, for different sampling dates, for up to one year. The software requirements also state that the speech-enabled component of SampleTalk will allow the user to enter a field name and the name of management unit within the field. The field names vary from farm to farm. SampleTalk must provide a utility that will allow users to define new field names which may not exist in the dictionary.
5
During the sampling process, the user will use speech to input the plant data for each row. SampleTalk will keep track of the row number for the user. Because the process will be carried out in the field where visual feedback is hard to obtain, SampleTalk will provide auditory feedback for most user inputs. SampleTalk will provide an undo function for voice input that will allow the user to correct errors. SampleTalk will save the data to the hard disk frequently to prevent data loss caused by potential field operation problems ( i.e., a dead battery). The sampling data must be stored for each row in the transect line. SampleTalk will need to deal with up to 300 fields for each farm. The requirements also state that SampleTalk will use an empirical cumulative distribution function (Snedecor and Cochran 1956) to analyze the sampling data. The results will be displayed in both graphical and tabular forms. SampleTalk needs to have the ability to simultaneously display multiple graphs (up to four) for the same management unit for different time periods. SampleTalk will run under Windows 3.1.
CHAPTER II INTERFACE DESIGN
The user interface design is becoming more and more important in software systems as computers become widely accessible to people from various backgrounds. “The user interface of a system is often the yardstick by which that system is judged” (Sommerville 1992, 262). A well-designed user interface will improve the users’ work performance and enhance their environments (Fischer and Girgensohn 1990). SampleTalk was designed to be a highly interactive system. The interface will affect its performance and usability. The goal of interface design is to achieve a natural humancomputer interaction and keep the dialogue between man and machine smooth. The interface of SampleTalk consists of a speech interface for data sampling and a graphical user interface for data sampling and data analysis.
Define Vocabulary and Grammar To develop a practically useful speech-enabled application, we need to keep the input errors as low as possible. A high recognition error rate will reduce the speech input speed due to frequent error correction. It also prevents the system from being userfriendly and eliminates the advantages of speech in human-computer interaction. Currently, the performance of speech recognition engines is far from perfect. At the application level, accuracy is achieved by defining a suitable vocabulary and grammar 6
7
(Baber et al. 1992). IBM VoiceType Application Factory (VTAF) is used as the speech recognizer in SampleTalk. The old version of VTAF, IBM Continuous Speech Series (ICSS), had been used in CottonTalk. VTAF is a speaker-independent, continuous speech recognition engine. The speech engine can handle a vocabulary size of 1,000 words. The average perplexity of the 1,000-word vocabulary is about 30, which means on average 30 words can follow any given word within a context and good recognition can still be achieved. This is suitable for SampleTalk. The speech engine will try to match every possible sound, even the background noise, to the vocabulary defined in the grammar. The plant stand sampling process primarily uses numerical data (numbers) as input. There are two commonly used ways to input numbers by voice. One way is to use the cardinal representation of the number (i.e. saying eighty-five for 85) and another is to use the digit-by-digit representation of the number (i.e. saying eight five for 85). An experiment was conducted to compare those two methods to determine which is better for entering numeric data by voice. The hypothesis was that the digit-by-digit representation would result in fewer recognition errors, because it has a smaller sized vocabulary and does not have similar utterance words. On the other hand, the cardinal representation has a larger vocabulary size and some similar utterance words, such as those ending in “-teen” and “-ty”, which are likely to cause recognition errors. The experiment was conducted in a relatively quiet office environment. There was little background noise except for the hum of the air conditioner which was constant and was filtered by adjusting the threshold of the speech engine. Fourteen subjects were
8
selected, half male and half female. All subjects were native English speakers. Each subject was asked to enter the same set of 50 numbers using two different methods. The set of numbers consisted of randomly selected numbers between 0 and 99. The subjects were given several minutes to practice the task before the actual experiment. Each subject was given a single trial. Table 2.1 shows the results of the experiment.
Table 2.1 Error rates for Digit-by-digit and Cardinal Methods. Subject
female female female female female female female average error rate (female) standard deviation (female) male male male male male male male average error rate (male) standard deviation (male) average error rate for all subject average difference standard deviation for difference t
Cardinal error rate (%) 8 12 6 18 10 2 16 10.28 5.17 32 14 18 36 12 4 4 17.14 11.7 13.7
1.42
Digit-by-digit error rate(%)
Difference
4 4 2 28 4 0 4 6.56 8.68 38 0 0 26 6 2 2 10.56 14.05 9.56
4 8 4 -10 6 2 12
0.6
-6 14 18 10 6 2 2
5.14 7.12 2.7
9
The average error rate for the digit-by-digit method was 9.56%, and the average error rate for the cardinal method was 13.7%. Using a t-test to do statistical analysis (Howell 1992), t=
D−0 SD N
where D and SD are the mean and standard deviation of the difference of the error rate between the two methods and N is the number of test results, we have t = 2.6 > t
0.025
(13).
This means that there was a significant difference in the error rate between the two methods. The error rates of males and females for each of the two methods were compared. Using a t-test, t=
( X 1 − X 2) s12 s2 − 1 N1 N2
where X 1 and X 2 are the means of the error rates for two different genders for a method of entry, s1 and s2 are the respective standard deviations, and N1 and N2 are the number of subjects of each gender, we have t = 1.42 for the cardinal method and t = 0.6 for the digitby-digit method. Both results are less than t0.025 (12). So, there was no significant difference between males and females for the two input methods. For flexibility, thesystem was designed to allow users to enter numbers using either the cardinal or the digit-by-digit representations for numbers. The user can select
10
the representation based on his/her personal preference and system performance. When used in a noisy environment, the digit-by-digit method is likely to be more accurate.
System Feedback Feedback is an important aspect of human-computer interaction design. System interfaces are designed to carry on a continuously interactive dialogue so that users are informed of actions in progress at each step. Without feedback, users might begin to wonder what the system is doing and whether the input should be re-entered. Software systems use feedback to communicate with the user. Feedback confirms that the software is responding to the user’s input and notifies the user of changes of the system’s states (Baber et al. 1992). Effective feedback should be timely and presented as close to the point of the user’s interaction as possible. A user cannot tolerate an unresponsive interface. For a speech-enabled application, feedback is usually considered essential, because the speech recognition system cannot achieve complete accuracy (Jones and Hapeshi 1989). Feedback can be in auditory and visual forms. While we receive a lot of sensory data using our ears, our eyes are still quicker. We can glance at a sentence, but it takes us a few seconds to listen it. There are two characteristics of auditory feedback. It is linear and transient. “Speech output should be used primarily for providing short prompts to the user”(Philip et al. 1991, 21). To define the feedback structure for SampleTalk, we need first to consider the typical scenario of the plant stand sampling process. The user goes to a field, he/she
11
inputs the field/unit name, and then goes to each transect line to do the sampling. The user will sample 32 rows per line and 3 to 4 lines for each management unit. The user will focus his/her attention on the plant inspection. Visual feedback is not convenient during the sampling process. In this case, auditory feedback is more natural and faster than visual feedback. The feedback includes both an auditory prompt to inform the user of the state of the system, such as the line and row number of the current sample, and the sample data that the system has recognized (Ainsworth and Pratt 1992). Due to the lack of voice synthesis capability of our tool, a waveform sound file is used in the system, which will consume some disk storage. Each waveform sound file requires about 30KB of disk space. Sound files for three hundred field names would require 9MB of disk space. To save disk space, auditory feedback is not used for field/unit name input. A field/unit name will be input only once for a particular sampling unit and visual feedback can be used for this input without affecting the sampling process. Visual feedback is also provided in addition to auditory feedback for all other user input. In a field situation, however, the user would be expected to rely primarily on auditory feedback.
Error Recovery and Human-Computer Dialog Error recovery is provided for correcting both human errors and recognition errors. The typical scenario in a dialog style interaction is that when the user perceives the feedback is not correct, he/she will make the correction immediately. Considering that it will be unusual for the user to go back several rows to change the sample data, SampleTalk only provides an undo ability for the latest input. The undo function will keep
12
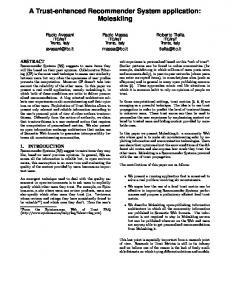
track of the state of system. The dialog between the user and the computer in the sampling process can be described using a state transition diagram (Figure 2.1).
s0 start sampling / please input field name s1 field name / please input management unit s2 management unit / line-row number prompt s3 sample data / recognized data and row number prompt s4 next line / line-row number prompt s5 new unit / please input management unit s6 new field / please input field name s7 finish sampling / shutdown the speech engine
s8
Figure 2.1 State Transition Diagram for Speech Input
13
One characteristic of the stand sampling process is that the user will take some time to inspect the plant after each sample input and more time will be taken after each sampling line, unit, and field. To avoid unnecessary recognition errors caused by background noise, an attention word, “Start-sampling”, is used after each sampling line, unit, and field to put the system into a dormant state. To activate the system, the user needs to say the attention word, which will put the system back in a listening state. Other inputs are ignored while the system is dormant. An attention word is not used after each sample input. The user will typically be able to enter a series of sample data rapidly. Also, state transition is time consuming. Instead of attentions, keywords are used in combination with the actual data to overcome the problem of mis-understanding due to background noise. Each sampling input will be followed by one of the keywords “Plants” or “Counts”. Only when SampleTalk finds those keywords, will the preceding number be treated as input data. Although use of keywords is not as effective as attention words to deal with noise, this approach is faster and keeps the human-computer dialog smooth.
Graphical User Interface A dialog box is used in SampleTalk to display the visual feedback. The dialog box has several fields that are used to display the current field/unit name, the sampling data, and a prompt for the next input. The initial design of the GUI for SampleTalk only provided feedback. After prototyping, the dialog box was changed to provide a limited input ability. There are two reasons for the change. One is that the speech recognition engine sometimes cannot recognize a particular word spoken by a particular user after
14
several trials. Keyboard input is a necessary backup. Another is that when the system is in the dormant state waiting for the attention word, the speech engine might not understand the attention word due to background noise and therefore cannot be reactivated. The only solution is to use the keyboard to interrupt the dormant state. The analysis part of the system is mainly handled by the GUI. The data is displayed in graphical form using an accumulative distribution function. The user can select up to four different samples from one unit and display them at the same time. A selection dialog box is provided to allow the user to select a field, a unit, and samples. A dialog box is used to display the statistical results in a tabular form. The dialog box provides information such as average stand count per acre, average stand count per 3 feet, and stand coverage, etc., for each management unit in a list box. The tabular form provides all of the information for one field. The user needs only to select a field name. Field names are different for each farm. SampleTalk provides a dialog box to allow the user to add and delete field names. The user can list the existing field names. The user can add new field names to the system dictionary and grammar file. The user can also delete field names and modify the phoneme of an existing field name. The system will compile a new speech context for the modified grammar file.
CHAPTER III SYSTEM DESIGN AND DEVELOPMENT
Design Methodology and Tools An object-oriented software development method, the Fusion method (Coleman et al. 1994), was used in the software design. Fusion is a full-coverage software development method that provides a process for software development. It follows the waterfall model by dividing the software process into phases and provides guidelines to be followed by software designers in each software development phase. It also provides “a set of well-defined and comprehensive notations for capturing analysis and design decisions.” (Coleman et al. 1994, 8) The prototype method was used in the user interface design. A prototype provides an effective tool for communicating the design between users and designers (Rosson et al. 1987). It can help the designer to define the task flow and better visualize the design. Prototyping can be adopted in Fusion’s analysis model. Using the prototype, we can define scenarios to model the interaction and event flow between the user (agent) and the system. The initial prototyping was done by pencil and paper to define task and conceptual ideas. Operational prototypes were used for the user interaction. The project adopts the approach by which the prototype is the system, and the iteration that takes place ultimately evolves into the final system (Rosson et al. 1987). 15
16
IBM VoiceType Application Factory toolkit was used as the speech recognition engine. The toolkit provides a set of utilities to adjust the engine for different environments. It also provides a set API function to establish the session linking the speech recognition engine and the application. Currently, the API only supports C. Microsoft Visual C++TM was used as programming language for this project. The project used the Microsoft Foundation Class (MFC) to abstract the lower level Windows message passing architecture. Although using MFC leads to a slightly bigger executable, it makes the source code easy to understand and maintain. The MFC Application Framework also reduces the development time and improves source reuse, which is very helpful for prototyping iteration.
System Analysis The purpose of the analysis phase is to capture as many of the requirements of the system as possible in a complete, consistent, and unambiguous fashion (Sommerville, 1992). There are two models generated in the analysis phase. The object model describes the static structure of the system and the interface model defines the dynamic aspects of the system (Coleman et al. 1994). The objects that were identified in the plant stand sampling context are field, unit, transect line, row, plant, microphone, speaker, and user. Row and plant can be treated as attributes of transect line. The object model defines objects and their relations (Figure 3.1). A system object model is a subset of an object model that contains only the objects that will be built as part of the system (Figure 3.2).
17
Field *
Unit *
Sample *
Line
*
*
mic_speaker sampling
1
User analyze
Figure 3.1 Object Model
1
name
18
Field Unit *
Sample *
Line
*
*
mic_speaker sampling
1
User analyze
Figure 3.2 System Object Model
1
name
19
The interface of a system describes the set of system operations and events. An interface model uses two models to define different aspects of the system behavior. The operation model describes the effect of each system operation in terms of the state change it causes and the output events it sends (Coleman et al. 1994). The life-cycle model characterizes the allowable sequence of system operations and events. The life-cycle model is defined by analyzing scenarios. A scenario is a “sequence of events flowing between agents and the system”(Coleman et al. 1994, 45). It describes how the agent interacts with the system. A scenario is represented as a timeline diagram. Figures 3.3, 3.4, and 3.5 show the scenarios for sampling, for modifying the field name, and for analysis. From scenarios, we can define the life-cycle model. The life-cycle model is described by life-cycle expressions. “Life cycles are simple extensions to regular expressions and grammars”(Coleman et al. 1994, 31). The interface models are highly related to the user interface design. The prototype is used to define the interface models. Figure 3.6 shows the life-cycle model of the system.
20
User
start_sampling
System
input_field_name
field_name
input_unit_name unit_name
line_row_number sample_data
feedback
close_field
Description: The user tells the system to start the sampling process. The system asks the user to enter the sampling field name. The user enters the field name. The system asks for the management unit name. The user enters the unit name. The system asks for the sample data. The user inputs the sample data. The system gives the user feedback. The process is repeated for each line. When finished sampling, the user tells the system to close the field.
Figure 3.3 Scenario for Speech Input of Sampling Data
21
System
User add_field_name new_field_name speak accept end_add_field_name
Description: The user tells the system to add the field name. The user types in the new field name and speaks the new field name. The system displays the new name that has been added for the user. The user instructs the system to store the new name in the dictionary.
Figure 3.4 Scenario for Adding a New Field Name
User
System start_analyze list_of_field select_field list_of_unit select_unit sample_list select_sample analysis_result
Description: The user tells the system to start the analysis process. The system shows a list of fields which have been sampled. The user selects the field to analyze. The system shows the management units in the field. The user selects the management unit. The system shows the available samples. The user selects the sample data. The system shows the analysis results.
Figure 3.5 Scenario for Analysis
22 Lifecycle plant_stand_sampling: (Sampling | Analysis | Add_field_name) * Sampling = start_sampling . (Field_name . (Management_unit1. Sample_data1) *)* Field_name = (#field_name . specify_field_name | quit_sampling). Management_unit1 = #unit_name. ((correction . Field_name) | specify_unit | Close_field). Management_unit2 = #management_unit . ((correction . Sample_data2) | specify_unit | Close_field). Sample_data1 = #line_row_number . (correction . Management_unit | Sample_data2) * Sample_data2 = (new_unit . Management_unit2) | ((input_data | new_line) . # feedback . [correction] . Sample_data2 ) | Close_Field. Close_field = close . Field_name. Analysis = graphics | table. graphics = start_analysis_g . #field_list . select_field_g . #unit_list . (select_unit . #sample_list . select_sample . #result_graphic) *. table = start_analysis_t . #field_list . select_field_t . #result_table Add_field_name = start_add_field_name . #field_list . (new_field_name. #new_name_added) * . compiler
Figure 3.6 Life-cycle Model
The operation model specifies the “behavior of the system operations by defining their effect in terms of change of state” (Coleman et al. 1994, 26). The operation model uses schema to define the system operations. The following figures show the system operations of SampleTalk. Table 3.1 shows the data dictionary.
Operation: start_sampling Description: Instructs system to start the sampling process Read: Change: Send: Assume: Result:
field, mic_speaker user: {field_name} The system is in sampling mode, starts the speech engine, and initializes mic_speaker. The contents of field are cleared.
Figure 3.7 Schema for start_sampling
23
Operation: specify_field_name Description: Informs system of the field name to be processed Read: Change: Send: Assume: Result:
supplied field_name field, mic_speaker user: { unit_name} field name is valid The system checks the field name, loads an existing field or creates a new field if one does not exist
Figure 3.8 Schema for specify_field_name
Operation: specify_unit Description: Informs system of the management unit to be processed Read: Change: Send: Assume: Result:
supplied unit_name unit, mic_speaker user: {line_row_number} unit_field name is valid The system checks the unit name, creates a new unit if one does not exist
Figure 3.9 Schema for specify_unit
Operation: quit_sampling Description: Instructs system to quit sampling process Read: Change: Send: Assume: Result:
mic_speaker system is in sampling mode and waits for user to input field_name The system closes the speech engine.
Figure 3.10 Schema for quit_sampling
24
Operation: new_unit Description: Instructs system to change to new management unit Read: Change: Send: Assume: Result:
unit, sample, mic_speaker user: {unit_name} system is in sampling mode. The system adds the current sample to the unit, closes the current unit and waits for a new unit name.
Figure 3.11 Schema for new_unit
Operation: new_line Description: Instructs system to start a new transect line Read: Change: Send: Assume: Result:
sample new line user: {line_row_number} system is in sampling mode. The system adds the current sampling line to the sample, and starts a new line
Figure 3.12 Schema for new_line
Operation: input_data Description: speech input of the sample data Read: Change: Send: Assume: Result:
supplied data line user: {feedback (data, line_row_number)} system is in sampling mode. The system adds the data to the current sampling line, and waits for data for the next row.
Figure 3.13 Schema for input_data
25
Operation: correction Description: Instructs system to go back to undo the previous input Read: Change: Send: Assume: Result:
sample, line, mic_speaker user: {field_name, unit_name, line_row_number} system is in sampling mode. The system undoes previous input, changes the corresponding object state.
Figure 3.14 Schema for correction
Operation: close Description: Informs system to close current field Read: Change: Send: Assume: Result:
field, mic_speaker user: {field_name} system is in sampling mode. The system closes the current sampling field, saves the sample data, and waits for a new field name.
Figure 3.15 Schema for close
Operation: start_analysis_g Description: Instructs system to start the analysis process for graphics display Read: Change: Send: Assume: Result:
user: {field_list} The system shows the user the list of available fields, and prepares for analysis.
Figure 3.16 Operation Model For start_analysis_g
26
Operation: select_field Description: Informs system of the field to be analyzed Read: Change: Send: Assume: Result:
supplied field_name field user: {unit_list} system is in analysis mode, field name is valid. The system loads the data for the field and shows the user the list of available units.
Figure 3.17 Schema for select_field
Operation: select_unit Description: Informs system of the management unit to be analyzed Read: Change: Send: Assume: Result:
supplied unit_name user:{times} system is in analysis mode, unit name is valid. The system shows the available sample for the unit
Figure 3.18 Schema for select_unit
Operation: select_sample Description: Informs system of the samples to be analyzes and to perform the analysis Read: Change: Send: Assume: Result:
supplied sample user:{result_graphics} system is in analysis mode. The system does the analysis on the selected sample, and graphically displays the result.
Figure 3.19 Schema for select_sample
27
Operation: start_analysis_t Description: Instructs system to start the analysis process for table display Read: Change: Send: Assume: Result:
user: {field_list} The system displays the list of available fields, and prepares for analysis.
Figure 3.20 Schema for start_analysis_t
Operation: select_field_t Description: Informs system of the field to be analyzed and to perform analysis Read: Change: Send: Assume: Result:
supplied field_name field user: {result_table} system is in analysis mode, field name is valid. The system does the analysis on the selected sample, and displays the result table.
Figure 3.21 Schema for select_field_t
Operation: start_add_field_name Description: Instructs system to begin to add new field names Read: Change: Send: Assume: Result:
user:{field_list} The system starts the speech engine.
Figure 3.22 Schema for start_add_field_name
28
Operation: new_field_name Description: Informs system of the new field name Read: Change: Send: Assume: Result:
supplied field_name
system is in add_field_name mode The system gets the field name from the keyboard and via speech input.
Figure 3.23 Schema for new_field_name
Operation: compile Description: Informs system to compile the new context Read: Change: Send: Assume: Result:
The system generates a new speech context.
Figure 3.24 Schema for compile
Software Design In the software design phase, software structures are defined to implement the abstract definitions generated from analysis (Coleman et al. 1994). The output of design is an object-oriented software structure that “contains the same information and preserves the relationships defined in the system object model” (Coleman et al. 1994, 62). There are four design models developed in the design phase. The object interaction graphs describe how objects interact with each other at run-time to carry out the system operations. The visibility graphs describe the object communication paths and references.
29
Inheritance graphs describe the class/subclass relations. The class descriptions provide a specification of the class interface (Coleman et al. 1994). For each system operation defined in the operation model, there is a corresponding object interaction graph. The object interaction graph defines the sequence of the messages that occur between objects to realize a particular operation (Coleman et al. 1994). The goal is to distribute the functional behavior among the objects. The following figures show the object interaction graphs for SampleTalk.
start_sampling( )
Mic_speaker
clear ( )
Field
Description: operation Mic_speaker:start_sampling( ) start the listening process. method
Field: clear( ) initialize the field content to empty.
Figure 3.25 Object Interaction Graph for start_sampling
(1) load_data( ) specify_field_name(name:String )
(2) initialize ( ) Field
Mic_speaker
Description: operation Mic_speaker:specify_field_name(name:String) get field name via speech.
(1’) create( )
method
mic_speaker:load_data( ) load the data for the field
method
field:initialize( ) initialize the field contents with the data, create unit, sample, and line objects.
Figure 3.26 Object Interaction Graph for specify_field_name
30
specify_unit(name:String )
Mic_speaker
(1) Unit get_unit (name:String) Unit
(1’) Create( )
(3) create ( ) (2) Create( )
u:Unit
Line
Sample
Description: Operation Mic_speaker:specify_unit(name:String) get the unit name via speech look up the name in the units if(not found) then create a new unit create a new sample create a new line method Unit:get_unit(name:String) if(Unit.name equals to name) then return this unit
Figure 3.27 Object Interaction Graph for specify_unit
quit_sampling( )
Mic_speaker
Description: operation Mic_speaker:quit_sampling( ) closes the speech engine
Figure 3.28 Object Interaction Graph for quit_sampling
31
new_unit( )
Mic_speaker
(1) add_line(Line)
Sample
(2) add_sample(Sample) Unit Description: operation Mic_speaker:new_unit( ) adds the current line to the sample adds the sample to the unit method
Sample:add_line(Line) adds the line to the line list increments the line count
method
Unit:add_sample(Sample) adds the sample to the sample list increments the sample count
Figure 3.29 Object Interaction Graph for new_unit
new_line( )
Mic_speaker
(1) add_line(Line)
Sample
Description: operation Mic_speaker:new_line(Line) adds the line to the sample
Figure 3.30 Object Interaction Graph for new_line
32
input_data(data )
Mic_speaker
(2) add_row(data)
Line
(3) feedback( )
Description: operation Mic_speaker:input_data(data) validate the data // internal method adds the data to the line gives the feedback // internal method method
Line:add_row(data) adds the data to row increments row count
Figure 3.31 Object Interaction Graph for input_data
correction( )
Mic_speaker
Description: operation Mic_speaker:correction( ) change the state of mic_speaker to previous state.
Figure 3.32 Object Interaction Graph for correction
33
Mic_speaker
close( )
save( )
field
Description: operation Mic_speaker:close() closes the sample field changes the state to wait for new field name method
Field:save() saves the sampling data for the field to the hard disk.
Figure 3.33 Object Interaction Graph for close
start_analysis_g( )
Mic_speaker
Description: operation:Mic_speaker:start_analysis_g() loads the field name list and displays it.
Figure 3.34 Object Interaction Graph for start_analysis_g
(1) load_data( ) select_field_g(name:String )
Mic_speaker
Description: operation:Mic_speaker:select_field(name:String) maps the name to sample data file. loads the data for the field. displays available unit
(2) initialize( )
Field
(2.1) create( ) Unit (3) String get_unit_name()
method
Field:initialize( ) loads the data from the field, creates unit, sample, and line objects.
method
Unit:get_unit_name() return the unit name
Figure 3.35 Object Interaction Graph for select_field_g
34
select_unit(name:String ) Mic_speaker
(1) Unit find(name:String )
Description: operation Mic_speaker:select_unit(name:String) finds the unit that matches the name for that unit, gets the sample date. displays the available sample date.
Unit
(2) get_timestamp( )
Sample method
Unit:find(name:String) if the unit name is equal to name then return this unit otherwise return null
method
Sample:get_timestamp( ) return the time of the sample
Figure 3.36 Object Interaction Graph for select_unit
select_sample(time)
Mic_speaker
(1) analyze(time)
(2) Description: plot( ) operation Mic_speaker:select_sample(time) for the specified sample, performs the analysis shows the analysis result.
Sample
(1.1) analysis( )
(2.1) plot( )
Line method
Sample:analyze(time) performs the analysis on the each line in the sample
method
Sample:plot( ) plots the results
method
Line:analyze() performs the analysis on the data
method
Line:plot( ) plots the results
Figure 3.37 Object Interaction Graph for select_sample
35
select_field_t Mic_speaker (name:String) (1) analyze( )
(2) table( )
Field
(1.1) analyze( ) (2.1) table( )
Unit
(2.2) table( )
Description: operation Mic_speaker:select_field_t(name:String) gets the field with name performs analysis on the field displays the analysis results in table.
Sample
method
Field:analyze( ) for each unit in the field, perform analysis
method
Unit:analyze( ) for each sample in the unit, perform analysis
method
Sample:analyze( ) for each transect line in the sample, performs analysis gets the statistical results.
method
Line:analyze( ) sort the data rank the data calculate Q1, Q2, Q3
method
Field:table( ) for each unit in the field, format the table output
method
Unit:table( ) for each sample in the unit, format the table output
method
Sample:table( ) for each line in the sample, format the table output
method
Line:table( ) format the table output
(1.2) analyze( ) (1.3) analyze( )
(2.3) table( )
Figure 3.38 Object Interaction Graph for select_field_t
Line
36
start_analysis_t( )
Mic_speaker
Description: operation:Mic_speaker:start_analysis_t() loads the field name list and displays it.
Figure 3.39 Object Interaction Graph for start_analysis_t
start_add_field_name( ) Mic_speaker
Description operation Mic_speaker:start_add_field_name() starts the speech engine.
Figure 3.40 Object Interaction Graph for start_add_field_name
new_field_name(name:String)
Mic_speaker
Description operation Mic_speaker:new_field_name(name:String) gets the field name via speech and keyboard
Figure 3.41 Object Interaction Graph for new_field_name
compile( )
Mic_speaker
Description operation Mic_speaker:compile() generates new speech context.
Figure 3.42 Object Interaction Graph for compile
37
The visibility graph defines the reference structure of classes in the system (Coleman et al. 1994). Four kinds of visibility relation are defined in the visibility graph: reference lifetime, server visibility, server binding, and reference mutability. The following figures show the visibility graphs.
Mic_speaker
f: Field
u: Unit
s: Sample
l: Line
Figure 3.43 Visibility Graph for Mic_speaker
38
Field u: Unit
m: Mic_speaker s: Sample
l: Line
Figure 3.44 Visibility Graph for Field
Unit Sample
m: Mic_speaker
Figure 3.45 Visibility Graph for Unit
39
Sample m: Mic_speaker l: Line
Figure 3.46 Visibility Graph for Sample
Line m: Mic_speaker
Figure 3.47 Visibility Graph for Line
40
Table 3.1 Data Dictionary
Name
Kind
Agent
Description
user field unit sample time line row length mic_speaker state
agent class class class attribute class attribute attribute class attribute
start_sampling specify_field_name specify_unit quit_sampling new_unit new_line one input_data correction close start_analysis select_field select_unit do_analysis start_add_field_name new_field_name compile
system op. system op system op system op system op system op
user user user user user user
start sampling processing specify name of the field to be sampled specify unit name in the sampling field quit the sampling processing end current unit, begin a new one end current transect line, begin a new
system op system op system op system op system op system op system op system op system op system op
user user user user user user user user user user
input the sample data correct previous input close current sampling field. start analysis process select the field to be analyzed select management unit in the field do analysis on the data start add_field_name process input the new field name generate new speech context
field_name unit_name line_row_number feedback field_list unit_list times result_graphic result_table
event event event event event event event event event
user user user user user user user user user
wait for field name wait for unit name wait for input data for line/row confirm user’s input, wait for next one list of available field list of available unit for a field list of availabel sample data set the analysis result in graphical for m the analysis result in tabluar form
people who do the data sampling plant field being sampling management unit of field sample data for the unit time of the data be sampled transect line for sampling hold the sampling data for the row number of row in the line speech interface current sampling state
41
The file structure of SampleTalk is defined in the design phase. Since the system will need to manage up to 300 management units, it is estimated that the total sample data will be around 100,000 samples (integers) for one year. The data is accessed on a unit basis. To save disk space, the data is stored in binary format. Each sample is treated as an 8 bit integer since the sample is always less than 255. The data is organized based on the field. There is a file for each field. The system maintains a mapper that maps the field name to its corresponding file since the field name may be longer than 8 characters and Windows3.1 does not support longer file names. In the file, there is a record for each unit. Each unit will contain data from different sampling dates. The file structure will allow the sampling and analysis processes to easily access the data, because the data is used on a unit basis. This also avoids making the disk too fragmented.
Implementation SampleTalk is implemented using Visual C++ under Windows3.1.The documentview architecture of MFC was adopted for the system. The view class takes the responsibility of the control class. The view class interacts with the user and dispatches messages to other classes. The view class handles the speech input and keyboard input. It provides the GUI for the system. The view class simplifies the message passing between the user and the system. The only operating system dependent part is the view class. Object persistence techniques are used to store the data in the file. The file contains the state of each object. The object can be dynamically created when it is loaded from the disk. The state of an object when it was last saved will be restored when the
42
object is loaded. Object persistence will make the object and its data file easy to access by other applications.
CHAPTER IV TESTING
The goal of this project was to design, implement, and test a speech-enabled application to facilitate the plant stand sampling process. The evaluation criteria are the time for sampling and the error rate, both compared with the paper/keyboard method. There has been a debate about the relative speeds of speech input and keyboard input. Some experiments show that the speech input is slower (although the difference is not statistically significant) and more error-prone than keyboard (Damper and Wood, 1995). Others show that speech is superior to keyboard (Damper and Wood, 1995). The results are highly dependent on the task to be performed. For SampleTalk, the experimental environment is difficult to control for testing input speeds in the field and there were no crops available for actual sampling at the completion of the project. A test was conducted in the office environment instead. Seven subjects participated in the test. All subjects were native English speakers. A prepared data set was printed on a paper sheet. The subjects were asked to do two tests. In one test, the subject was asked to use SampleTalk to input the data. In another test, the subject was asked first to write down the data on a sample data sheet currently used in stand sampling, and then to use the keyboard to input the data into a spreadsheet. In both tests, the subject was asked to use his/her normal typing and speaking speed. The 43
44
subject was asked to correct all the input errors and make sure the final result was correct. The time required and errors (both human and machine) were recorded for both tests (Table 4.1). The time includes the time for error correction. The subject’s actions were observed during the test. An error was counted when the subject made a modification to any existing input data.
Table 4.1 Recognition Rate and Input Speed for SampleTalk and Keyboard Method.
Subject 1 2 3 4 5 6 7 Average t
Recognition rate (%) SampleTalk Keyboard 93.75 100.00 96.88 100.00 90.63 90.63 100.00 96.88 90.63 96.88 93.75 96.88 93.75 100.00 94.20 97.32 -2.29
Speed (words/minute) SampleTalk Keyboard 10.67 13.91 10.67 10.67 10.67 12.8 10.67 10.67 7.11 10.67 8.00 10.67 10.67 10.67 9.78 11.43 2.72
The keyboard method, which consists of both writing and typing, is less error prone than SampleTalk. However, for this group of subjects the overall difference was not very significant (| t | < t 0.025 (6) = 0.2447). The recognition errors for the speech interface might be reduced by adjusting the parameters of the speech engine. Initial experiments had shown that parameter settings affect the performance of the speech engine. Keyboard input was significantly faster than SampleTalk inp ut ( t > t 0.025 (6) = 0.2447). There are several possible reasons for that. All subjects are computer science majors. They have good skills in keyboard input. The auditory feedback causes
45
SampleTalk to use more time in the test. However, under field conditions, the user will interrupt plant inspection to write down the data. Including the time required for inspecting the field, recording the data, and then typing in the data will substantially increase the total time for the keyboard method. The time used by SampleTalk should not change much under field conditions because plant inspection and data entry are concurrent. Also, the test data set was small. People are likely to get tired and make more mistakes when typing larger data sets. The stress on their hands and eyes for typing and error checking will slow down their input speed. It is expected that SampleTalk will have advantages in the plant sampling process. Extensive in-field testing is needed for a thorough evaluation of SampleTalk.
CHAPTER V CONCLUSIONS
SampleTalk, a speech-enabled application for plant stand sampling, has been developed in this project. The main focus of this project is to investigate the application of a speech-enabled application to a hand/eye busy task with a small size vocabulary and a well-structured grammar. For the plant stand sampling process, a speech-enabled application can collect the sampling data on site into the computer. It is convenient for the user to input the data by voice during the sampling process. The vocabulary used in the sampling is relatively small. A well-structured grammar is defined to constrain the speech syntax. SampleTalk provides sufficient feedback to inform the user of the system state and guide the user input. SampleTalk provides a simple error recovery (undo) method to handle recognition errors. Dual interfaces, speech and keyboard, are provided in SampleTalk to make the system more reliable. Since the sampling process deals with a large amount of numeric data input, SampleTalk provides the digit-by-digit method as a compliment to the cardinal method to reduce the recognition error rate. To make the system practical for field operation, SampleTalk will go into a dormant state when the user does not have data to input. SampleTalk was developed using the Fusion method and Visual C++. The objectoriented design allows the system to have a well-defined structure. SampleTalk should be 46
47
easy to upgrade to support more sampling attributes, such as plant insect population estimates. SampleTalk provides a small file management capability to manage sample data files. Although not a major focus of this project, SampleTalk also provides basic statistical functions to analyze sample data and provides useful crop management information to the user.
Future Work More sampling attributes will be added to SampleTalk. The speech interface, vocabulary and grammar need to be modified to accommodate the upgrade. Because the current system has a small vocabulary, when the vocabulary size gets bigger, more experiments will need to be conducted to test the system performance. The biggest challenge is to define the vocabulary and grammar. Other parts of the system require relatively small changes due to the current object-oriented structure of the system. Some improvements will be needed to make the GUI more user-friendly. For example, the listing of samples and their corresponding graphical display could be integrated better. Inter-unit analysis (display of the data from different units on the same screen) will be helpful for data analysis by the user. Genetic algorithms or other statistical methods could be used to optimize the parameter settings of the speech engine. Extensive in-field usability testing is needed to make the system more user-friendly and stable.
REFERENCES
Ainsworth, W. A. and S. R. Pratt. 1992. Feedback strategies for error correction in speech recognition systems. International Journal of Man-Machine Studies 36 (6): 833-42. Baber, C., D. M. Usher, R. B. Stammers, and R. G. Taylor. 1992. Feedback requirements for automatic speech recognition in the process control room. International Journal of Man-Machine Studies 37(12): 703-719. Cole, R., L. Hirschman, L. Atlas, M. Beckman, A. Biermann, M. Bush, M. Clements, J. Cohen. O. Garcia, B. Hanson, H. Hermansky, S. Levinson, K. McKeown, N. Morgan, D.G. Novick, M. Ostendorf, S. Oviatt, P. Price, H. Silverman, J.Spitz, A. Waibel, C. Weinstein, S. Zahorian, and V. Zue. 1995. The challenge of spoken language systems: Research directions for the nineties. IEEE Transactions on Speech and Audio Processing 3(1): 1-21. Coleman, D., P. Arnold, S. Bodoff, C. Dollin, H. Gilchrist, F. Hayes, and P. Jeremaes. 1994. Object-oriented development: The fusion method. Englewood Cliffs, New Jersey: Prentice Hall. Damper, R. I. and S. D. Wood. 1995. Speech versus keying in command and control applications. International Journal of Human-Computer Studies 42 (3): 289305. Fischer, G. and A. Girgensohn. 1990. End-user modifiability in design environments. In Proceedings of ACM Computer-Human Interaction 1990. 183-91. New York: ACM Press Howell, D. C. 1992. Statistical methods for psychology. Belmont, California: Duxbury Press. Jones, D. M. and K. Hapeshi. 1989. Monitoring speech recognizer feedback during data entry from short term memory: A working memory analysis. International Journal of Human-Computer Interaction 2 (4): 187-209.
48
49
Liang, C., J. L. Willers, S. Bridges, and J. M. Mckinion. 1996. Cotton Talk: A speech interface for cotton plant mapping. In Proceeding of Beltwide Cotton Conference. National Cotton Council. Memphis,Tennessee, January 8-12, 1996. 522-28. McDonald, L. 1991. Line-intercept sampling for two-dimensional particles. In Sampling of Biological Populations and Resource Selection Studies, Workshop Notes. University of Wyoming. Laramie. Philip, G., B. F. Peters, F. J. Smith, D. Crookers, and T. Rafferty. 1991. Design and evaluation of a speech interface for remote database searching. Journal of Information Science 17 (1): 21-36. Rosson, M. B., S. Maass, and W. A. Kellogg. 1987. Designing for designers: An analysis of design pratice in the real world. In Proceedings of ACM Computer-Human Interaction 1987. 50-3. New York: ACM Press. Schmandt, C. 1994. Voice communication with computers. New York: Van Nostrand Reinhold. Snedecor, G. W and W. G. Cochran. 1956. Statistical methods. Ames, Iowa: The Iowa State College Press. Sommerville, I. 1992. Software Engineering. New York: Addison-Wesley Publishers.
APPENDIX A PROJECT CONTRACT