PHYSICAL REVIEW E 69, 051908 共2004兲
Sampling tissue volumes using frequency-domain photon migration Fre´de´ric Bevilacqua,1,* Joon S. You,1,2 Carole K. Hayakawa,1,2 and Vasan Venugopalan1,2,3,† 1
Laser Microbeam and Medical Program, Beckman Laser Institute, 1002 Health Sciences Road East, Irvine, California 92612, USA 2 Department of Biomedical Engineering, Univeristy of California–Irvine, Irvine, Calfornia 92697, USA 3 Department of Chemical Engineering and Materials Science, University of California–Irvine, Irvine, California 92697, USA 共Received 12 April 2003; revised manuscript received 4 December 2003; published 24 May 2004兲 We demonstrate the use of Monte Carlo simulations to generate photon scattering density functions 共PSDFs兲 that represent the tissue volume sampled by steady-state and frequency-domain photon migration. We use these results to illustrate how scaling laws can be developed to determine the mean sampling depth of the multiply scattered photons detected by photon migration methods that remain valid outside the bounds of the standard diffusion approximation, i.e., at small source-detector separations and in media where the optical absorption is significant relative to scattering. Using both the PSDF computation and the newly formulated scaling laws, we focus on a comprehensive description of the effects of source modulation frequency, optical absorption, and source-detector separation on the depth of the sampled tissue volume as well as the sensitivity of frequencydomain photon migration measurements to the presence of a localized absorption heterogeneity. DOI: 10.1103/PhysRevE.69.051908
PACS number共s兲: 87.63.Lk, 87.80.⫺y, 42.62.Be, 05.60.⫺k
I. BACKGROUND AND MOTIVATION
In recent years, photon migration methods have been shown to be capable of noninvasively quantifying the physiological properties of biological systems 关1–3兴. These methods have been used with much success to study many biological systems including breast and muscle physiology and the functional activity of the brain 关4 –9兴. Photon migration measurements often employ a single source-detector pair to determine the optical properties of tissue systems that are treated as spatially homogeneous. These optical properties are then used to determine the morphology and biochemical composition 共e.g. 关red-Hb兴, 关 HbO2 兴 , 关 H2 O兴 ) of the tissue under consideration 关10,11兴. In such cases, the detected photons have interacted with the tissue at multiple locations. To optimize the sensitivity of such measurements to a structure of interest, or to simply define the tissue volume ‘sampled’ by a given measurement, it is essential to have the capability to not only determine the tissue volume probed by a given source-detector configuration, modulation frequency, and set of tissue optical properties, but also to quantify the effect of a localized absorbing heterogeneity on the measured signal. This is not a new problem. The identification of the volume sampled by photon migration methods when probing highly-scattering homogeneous tissues was first addressed by the seminal work of Weiss et al. 关12兴. This first investigation employed a random-walk model for radiative transport to establish basic scaling laws governing the distribution of depths visited by the photons collected in a steady-state pho-
*Present address: Institute de Recherche et Coordination Acoustique/Musique 共IRCAM兲, 1 place Igor Stravinsky, 75004 Paris, France. Email address:
[email protected] † Address correspondence to Vasan Venugopalan, Department of Chemical Engineering and Materials Science, 916 Engineering Tower, University of California–Irvine, Irvine, CA 92697-2575, USA. FAX: 共949兲 824-2541; email address:
[email protected] 1539-3755/2004/69共5兲/051908共10兲/$22.50
ton migration measurement. These scaling laws provided functional relationships for how the visitation depth distribution varies as a function of the tissue absorption a and reduced scattering s⬘ coefficients and the source-detector 共s-d兲 separation . These analytic expressions were confirmed by Monte Carlo simulations and consistent with later experimental and theoretical considerations developed by Patterson et al. 关13兴. Over the past fifteen years, many groups have expanded and generalized this early work using analytic, computational and/or experimental approaches to characterize the photon sampling volume when using steady state, time-resolved or frequency-domain photon migration techniques 关14 –22兴. Moreover, experimental, analytical, and computational studies have examined the impact of small localized heterogeneities 关16,21,23–26兴 and layered tissue structures 关23,24,27兴 on the tissue volume sampled by the detected photons. These early studies provided several important results. Patterson et al. demonstrated that different tissue depths can be probed using time-gating methods 关13兴. Using frequencydomain methods, Sevick et al. demonstrated that for a given s-d separation an increase in source modulation frequency provides greater sensitivity to superficial tissue volumes 关21兴. This study also examined the change in the modulation and phase of the detected photon density wave produced by the introduction of an absorbing heterogeneity into an otherwise homogeneous medium. In all cases, the investigators found the existence of a ‘‘blind’’ location within the volume sampled by the detected photons at which the placement of an optical heterogeneity would result in no change in the measured signal. Along these same lines, Gratton et al. showed experimentally that the position of this blind location differs slightly depending on whether one examines the amplitude or phase of the detected photon density wave 关18兴. However, while the main features regarding photon sampling density are understood, a comprehensive quantitative analysis that accommodates a full range of s-d separations, optical properties, and source modulation frequencies is still missing. In particular, the distinction between the characteristics
69 051908-1
©2004 The American Physical Society
PHYSICAL REVIEW E 69, 051908 共2004兲
BEVILACQUA et al.
of the tissue volume sampled using frequency-domain, as opposed to steady-state, photon migration methods and their relative sensitivities in detecting small optical heterogeneities has not been clearly addressed. Our interest here is the comprehensive examination of the volume probed within a homogeneous turbid medium using steady-state and frequency-domain photon migration methods. We employ the Monte Carlo method to simulate the radiative transport involved because we do not wish to restrict this investigation to conditions under which the diffusion approximation is valid, namely when s⬘ Ⰷ a and Ⰷl * , where l * ⫽( a ⫹ s⬘ ) ⫺1 . Our objectives are twofold. First, we intend to characterize the variation in the sampling volume with absorption and reduced scattering coefficients a and s⬘ , source modulation frequency f, and sourcedetector separation . This is done through the generation of a photon scattering density function 共PSDF兲 that utilizes photon trajectories provided by a Monte Carlo simulation to define the tissue volume sampled for a given measurement. Using the PSDF we examine the mean depth sampled by the detected photons and its variation with the optical properties and measurement parameters of interest. These results are compared to predictions provided by the standard diffusion approximation to the Boltzmann transport equation as well as to scaling laws that we have developed to predict the mean photon visitation depth 具z典 and its variation with s-d separation , absorption coefficient a and source modulation frequency f. This is done in a generalized fashion so that accurate results can be obtained both inside and outside the purview of the standard diffusion approximation. Second, we demonstrate how the PSDF can be used to determine easily the sensitivity of frequency-domain photon migration measurements to the introduction of a small absorbing heterogeneity. This is done to examine the perturbation offered by such a heterogeneity as a function of its location, s-d separation, and source modulation frequency. This analysis reveals that the ‘‘blind’’ locations in which tissue heterogeneities can reside but not be detected using frequency domain methods arise through the interference of the source photon density wave with the photon density wave scattered by the heterogeneity. II. METHODOLOGY A. Computation of the photon scattering density function „PSDF…
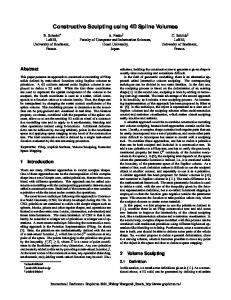
We consider the situation depicted in Fig. 1共a兲 with a source and detector with identical numerical aperture 共NA兲 of 0.37 separated by a distance . In all cases, the sample is assumed to have refractive index n rel ⫽1.4 relative to the surroundings with optical absorption and scattering coefficients a and s , and single-scattering asymmetry coefficient g. A reduced scattering coefficient s⬘ can then be defined as s⬘ ⬅ s (1⫺g). We implement Monte Carlo simulations wherein each photon is ‘‘injected’’ into the medium with a ‘‘weight’’ of 1. The path length l between successive scattering events is sampled from the density function s exp(⫺sl). The azimuthal scattering angle is sampled
uniformly while the longitudinal scattering angle is sampled from the Henyey-Greenstein phase function with g⫽0.8. We consider a slab geometry with a thickness of 100 mm. The boundary condition at the top surface was specified by the Fresnel relations for unpolarized light. The bottom surface was treated as index-matched. The photon weight within the medium is adjusted using continuous absorption weighting and photons are terminated only by their escape from the medium. For each photon that arrives at the detector, we record and save the locations at which it scattered within the medium in a computer file for later analysis. Using the file containing the detected photon trajectories, we define a three-dimensional matrix s,i (x,y,z) representing the volumetric density of scattering events resulting from the migration of the ith detected photon in the medium. Using this definition, the total number of scattering events N s,i the ith detected photon undergoes within the tissue volume is given by X
N s,i 共 x,y,z 兲 ⫽
Y
Z
兺兺 兺
k⫽0 l⫽0 m⫽0
s,i 共 x k ,y l ,z m 兲 ⌬x⌬y⌬z, 共1兲
where X, Y , and Z represent the maximum spatial dimensions of the computational domain and ⌬x, ⌬y, and ⌬z are the dimensions of the three-dimensional ‘‘voxels’’ that lie within. Using this definition for the volumetric scattering density s we define the photon sampling density function (x,y,z,t) corresponding to all photons detected over the time interval 0→t as
共 x,y,z,t 兲 ⫽
W
i s,i 共 x,y,z 兲 兺 ᭙i where t ⬍t N s,i 共 x,y,z 兲 i
⫽
兺 ᭙i where t ⬍t i
exp共 ⫺ a ct i 兲 共 x,y,z 兲 , 共2兲 N s,i 共 x,y,z 兲 s,i
where t i is the arrival time of the ith photon at the detector. (x,y,z,t) represents a spatial distribution of the number of scattering events per unit volume produced by the detected photons up to time t. W i is the weight of the ith detected photon and is computed using W i ⫽exp(⫺acti); a being the absorption coefficient of the medium and ct i being the total path length traversed by the ith detected photon which travels at speed c in the turbid medium and arrives at the detector at time t i . The restriction on the sum over index i is present to exclude those photons that arrive at the detector after time t. However, the focus of this study is to examine the PSDF in the frequency domain. We thus consider the frequencyresolved diffuse reflectance ¯ d ( ) measured at the detector: ¯ d 共 兲 ⫽
冕
⬁
⫺⬁
d 共 t 兲 exp共 ⫺ j t 兲 dt,
共3兲
where d (t) is the time-resolved diffuse reflectance, the angular modulation frequency, and j⫽ 冑⫺1. Using the method proposed by Testorf et al. 关28兴 the PSDF for the
051908-2
PHYSICAL REVIEW E 69, 051908 共2004兲
SAMPLING TISSUE VOLUMES USING FREQUENCY- . . .
FIG. 1. 共Color兲 共a兲 Schematic of Monte Carlo simulations used to generate the PSDF. 共b兲 Sample of the PSDF given for frequencydomain photon migration with a source modulation frequency f ⫽400 MHz within a medium possessing a ⫽0.005/mm and s⬘ ⫽0.8/mm. The source and detector possessed numerical apertures of NA⫽0.37 and were separated by ⫽22 mm.
angular modulation frequency 0 , ¯ (x,y,z, 0 ), can be computed using the expression ¯ 共 x,y,z, 0 兲 ⫽
兺 ᭙i
exp共 ⫺ a ct i ⫺ j 0 t i 兲 s,i 共 x,y,z 兲 . N s,i 共 x,y,z 兲
W⫽
Y
Z
W i ⫽ 兺 兺 兺 共 x k ,y l ,z m 兲 ⌬x k ⌬y l ⌬z m . 兺 ᭙i k⫽0 l⫽0 m⫽0
B. Diffusion-based approaches for determining visitation density functions
共4兲
Note that in such a case, ¯ (x,y,z, 0 ) is a complex threedimensional matrix, i.e., a matrix possessing real and imaginary parts. The magnitude of ¯ (x,y,z, 0 ) scales directly with the probability that the detected photons have scattered within an infinitesimal volume located at (x,y,z). Figure 1共b兲 provides a sample of the PSDF amplitude within a semiinfinite medium probed by frequency domain photon migration at f ⫽400 MHz with ⫽22 mm, a ⫽0.005/mm, and s⬘ ⫽0.8/mm. These values are typical for female breast tissue in the far visible and near infrared 关5兴. As depicted in Fig. 1共a兲 this approach to deriving the PSDF partitions the detected weight of the photon equally among the locations at which it scatters within the sample. This ensures that photons that contribute most to the measured signal also contribute most to the PSDF. Defining the PSDF in this way ensures that the sum of the weights of all the detected photons can be recovered using volumetric integration. Thus X
duced by introducing a small absorbing heterogeneity located at (x ⬘,y ⬘,z ⬘ ) can be determined by excluding the voxel corresponding to the location of the heterogeneity from the volumetric integration shown in Eq. 共5兲.
共5兲
Note that the removal of a given volume element 共voxel兲 located at (x,y,z) has the same effect on the detected weight as the addition of a small absorbing heterogeneity. This is essentially equivalent to a Born approximation where the effect of the absorption heterogeneity perturbs the measured signal but not the spatial distribution of the radiative transport in the medium. Thus changes in the detected signal pro-
For comparison, it is important to bear in mind how visitation density functions for the detected photons can be derived within the context of the standard diffusion approximation 关13,16,19,21兴. Following the approach outlined by Feng et al. 关16兴, the probability P(r⬘ ) for a photon originating at a location (r⫽r0 ) to arrive at a detector location (r⫽rd ) having visited an arbitrary infinitesimal volume dx dy dz located at r⫽r⬘ is given by the product of two probabilities: P 共 r⬘ 兲 ⫽ P 1 共 r0 ,r⬘ 兲 P 2 共 r⬘ ,rd 兲 .
共6兲
In Eq. 共6兲, P 1 represents the probability that a photon entering the medium at location r⫽r0 will arrive at a infinitesimal volume dx dy dz located at r⫽r⬘ and P 2 is the probability that a photon starting from the infinitesimal volume dx dy dz located at r⫽r⬘ will escape the medium at the detector location r⫽rd . P 1 is directly proportional to the fluence rate (r⫽r⬘ ) within the medium produced by a source of unit strength. On the other hand, P 2 is proportional to the fluence rate at the detector location (r⫽rd ) if an infinitely small isotropic photon source of unit strength were located at r ⫽r⬘ . Thus the probability under consideration is proportional to the product of the two corresponding Green’s functions: P 共 r⬘ 兲 ⬀
exp共 ⫺ 兩 r0 ⫺r⬘ 兩 兲 exp共 ⫺ 兩 rd ⫺r⬘ 兩 兲 , 兩 r0 ⫺r⬘ 兩 兩 rd ⫺r⬘ 兩
共7兲
where is the effective attenuation coefficient⬅ 关 3 a ( a ⫹ s⬘ ) 兴 1/2.
051908-3
PHYSICAL REVIEW E 69, 051908 共2004兲
BEVILACQUA et al.
For a semi-infinite medium, Eq. 共7兲 must be modified to accommodate the boundary conditions at the surface of the medium. This is most often accomplished using extrapolated boundary conditions and the method of images to solve the equations involved in the standard diffusion approximation. For a semi-infinite geometry where photons are injected at r0 ⫽(0,0,0) and detected at rd ⫽(d,0,0), the photon scattering density at r⬘ ⫽(x,y,z) within a standard diffusion approximation framework is given by P 共 r⬘ 兲 ⬀
冋
exp„⫺ 兵 关 x 2 ⫹y 2 ⫹ 共 z⫺z 0 兲 2 兴 1/2其 … 关 x 2 ⫹y 2 ⫹ 共 z⫺z 0 兲 2 兴 1/2
⫺
exp„⫺ 兵 关 x 2 ⫹y 2 ⫹ 共 z⫺z 0 ⫺z e 兲 2 兴 1/2其 … 关 x 2 ⫹y 2 ⫹ 共 z⫺z 0 ⫺z e 兲 2 兴 1/2
册
⫻
冋
⫺
exp„⫺ 兵 关共 x⫺d 兲 2 ⫹y 2 ⫹ 共 z⫹z e 兲 2 兴 1/2其 … , 共8兲 关共 x⫺d 兲 2 ⫹y 2 ⫹ 共 z⫹z e 兲 2 兴 1/2
exp„⫺ 兵 关共 x⫺d 兲 2 ⫹y 2 ⫹z 2 兴 1/2其 … 关共 x⫺d 兲 2 ⫹y 2 ⫹z 2 兴 1/2
册
where z 0 ⫽1/ s⬘ and z e is the extrapolation length which is a function of both the optical diffusion coefficient D⬅ 关 3( a ⫹ s⬘ ) 兴 ⫺1 and the relative refractive index n rel of the medium 关29,30兴. However, because this formulation is based on the standard diffusion approximation, Eqs. 共7兲 and 共8兲 provide accurate predictions only for large s-d separations and within media possessing high albedo. C. Perturbation of the visitation density due to an optical heterogeneity
As noted by Feng et al., in the steady-state case, the photon visitation density P, as derived using the standard diffusion approximation, is proportional to the change of the fluence rate produced at the detector by a infinitely small absorption element located at r⬘ ⫽(x,y,z) 关16兴. This can be seen by considering the work of Boas et al., who derived an expression for the diffusive wave scattered by an absorbing heterogeneity when probed using frequency-domain photon migration. This expression is derived by writing the scattered wave in terms of a series of multipole moments for which the amplitude of each partial wave is given by a scattering amplitude. If we consider only the monopole term in the expansion, the following expression provides, to first order, the perturbation ⑀ in the detected fluence rate produced by the presence of a spherical heterogeneity of radius a possessing an absorption that is different than the background medium by ⌬ a 关31兴:
⑀ ⫽S
冉 冊冉 4a3 3
冊
⫺⌬ a exp共 ⫺ jkr 0 兲 exp共 ⫺ jkr d 兲 D 4 cDr 0 4rd
共9兲
where S is the strength of the photon source and k⬅ 兵 关 a ⫺( j /c) 兴 /D 其 1/2 is the wave vector of the diffusive photon density wave in the background medium. r 0 and r d are the distances from the heterogeneity to the photon source and detector, respectively. Careful comparison reveals that in the limit as the angular source modulation frequency →0, the
expression for the perturbation of the frequency-domain fluence rate produced by an absorbing heterogeneity reduces to the form of Eq. 共7兲 which, by contrast, expresses the probability density for photon visitation. This suggests that the PSDF, in addition to providing the distribution of locations visited by the detected photons, also contains information relevant to modification in the detected signal produced by the introduction of a localized absorbing heterogeneity. It is important to note that ⑀ is a quantity that can be measured directly only in the steady-state case ( ⫽0). However, in the frequency-dependent case ( ⬎0), ⑀ modifies the frequency-domain fluence rate ⌽ 0 that would be detected in the absence of the heterogeneity. Thus the measurable quantity in the presence of an absorbing heterogeneity is (⌽ 0 ⫹ ⑀ ), and results from the interference 共i.e., the complex sum兲 of 共a兲 the photon density wave that travels through the homogeneous medium and reaches the detector with 共b兲 the photon density wave that is scattered by the heterogeneity 关31兴. Because of the equivalence of the perturbation in the frequency-domain fluence rate with the photon visitation probability density shown above, the relative change in the measured signal produced by a small absorption perturbation located at r⬘ ⫽(x,y,z) when probed by a photon density wave of modulation frequency 0 is easily derived from the PSDF as ⌽ 0 共 0,0,d, 0 兲 ⫹ ⑀ 共 x,y,z, 0 兲 共 兺 ᭙i W i 兲 0 ⫺ ¯ 共 x,y,z, 0 兲 ⬀ . ⌽ 0 共 0,0,d, 0 兲 共 兺 ᭙i W i 兲 0 共10兲 Note that the perturbation in the detected signal produced by the presence of an absorbing heterogeneity can be determined from a single Monte Carlo simulation by simple removal of the voxel occupied by the heterogeneity from the volumetric integration of the PSDF as described in the development of Eq. 共5兲. Thus the entire spatial map of the perturbation sensitivity can be derived from a single Monte Carlo simulation as opposed to performing separate simulations for each heterogeneity location of interest. Moreover, the Monte Carlo approach provides accurate results for cases where standard diffusion approximation based expressions shown in Secs. II B and II C will not be accurate; specifically for media of low to moderate albedo as well as small s-d separations. III. RESULTS AND DISCUSSION
To provide our results in a fashion that can be easily generalized, we employ dimensionless measures of the tissue absorption ¯␣ ⫽( a / s⬘ ), s-d separation ¯ ⫽ s⬘ , and modulation frequency ¯f ⫽( f /c s⬘ ) where f is the linear modulation frequency and c is the speed of light in the medium. The dimensionless source modulation frequency represents the source modulation frequency normalized to the frequency of isotropic scattering occurring within the medium. Note that for a tissue with s⬘ ⫽1/mm, the range of modulation frequencies between 200 MHz and 2 GHz corresponds roughly to a range in ¯f between 0.001 and 0.01.
051908-4
PHYSICAL REVIEW E 69, 051908 共2004兲
SAMPLING TISSUE VOLUMES USING FREQUENCY- . . . A. Photon scattering density functions in homogeneous media
In Figs. 2 and 3 we consider the midplane between source and detector and display normalized versions of the PSDF so that they possess the properties of a probability density function. The symbols represent the probability density of the ¯⬅ s⬘ z) of photon scattering as prenormalized depths (z dicted by Monte Carlo simulations for a s-d separation ¯ ⫽20. In Fig. 2 the variation of the PSDF with source modulation frequency ¯f is shown for a fixed absorption of ¯␣ ⫽0.01. In Fig. 3 the variation of the PSDF with ¯␣ is shown for ¯f ⫽0.002. For comparison, the visitation probability density predicted by the standard diffusion approximation and provided by Eq. 共8兲 is shown by the curves in each figure. Acceptable agreement is found between the diffusion approximation and the Monte Carlo simulations and similar trends in the change of these distributions are seen with changes in optical absorption and modulation frequency. This is expected given the large value of ¯ and the small values of both ¯f and ¯␣ that we have considered. However, there are some quantitative differences between the diffusion approximation and the Monte Carlo results. In this regard, it is important to remember that the Monte Carlo results are derived from the spatial variation in the number of scattering events, weighted by absorption and scattering, that take place within an infinitesimal volume as this volume is placed at an increasing depth. By contrast, within the context of the standard diffusion approximation, the photon visitation density function is determined by taking the product of the local photon density within the medium and the probability that a photon ‘‘emitted’’ from the location in question will be detected. Despite the different methodologies involved in the derivation of these probability density functions, the results shown in Figs. 2 and 3 demonstrate that these two approaches exhibit similar features. This arises because the photon scattering density is proportional to the local fluence rate. However, the Monte Carlo approach has the important advantage over diffusion approximation-based approaches of not being limited to any particular range of source-detector separations or optical properties. Figures 2 and 3 show that increasing values of either/both ¯f and ¯␣ results in a more rapid decay of the PSDF with depth. This behavior is expected because photons that penetrate deeply into the sample typically possess trajectories with longer path lengths and are less likely to reach the detector as the optical absorption is increased. Moreover, high modulation frequencies result in an increased contribution of shorter path length photons to the overall signal. The range of modulation frequencies shown in Fig. 2, corresponds to a variation between dc irradiation and a source modulation frequency of 1 GHz for a tissue with s⬘ ⫽1 mm⫺1 . Comparing these results with those of Fig. 3, it becomes clear that for biomedical applications, where the modulation frequencies employed are typically less than 600 MHz (¯f ⫽0.0028 for s⬘ ⫽1 mm⫺1 ) variations in optical absorption play a much more important role in altering photon visitation depths than will variations in the source modulation frequency.
FIG. 2. Probability density function of the depth visited by the detected photon density wave amplitude at the midplane between source and detector for normalized source modulation frequencies ¯f ⫽0, 0.002, and 0.005. Symbols represent results from Monte Carlo simulations while the curves represent the photon visitation density given by the standard diffusion approximation, i.e., Eq. 共8兲. Results are shown for source-detector separation ¯ ⫽20 with normalized optical absorption ¯␣ ⫽0.01. B. Mean photon visitation depth in homogeneous media
For a more detailed examination of the dependence of the PSDF with s-d separation, optical absorption, and source modulation frequency, we computed the mean normalized depth 共first moment兲 of the PSDF 具¯z 典 . Figures 4 and 5 show the dependence of the mean photon sampling depth 具¯z 典 for normalized s-d separations ¯ in the range 0.5– 40. The symbols represent the results of the Monte Carlo simulations while the curves represent predictions of novel scaling laws that are developed later in this section. Figure 4 provides the
FIG. 3. Probability density function of the depth visited by the detected photon density wave amplitude at the midplane between source and detector for normalized optical absorption of ¯␣ ⫽0, 0.005, 0.02, and 0.1. Results are shown for a fixed sourcedetector separation ¯ ⫽20 and normalized source modulation frequency ¯f ⫽0.001. Symbols represent results from Monte Carlo simulations while the curves represent the photon visitation density given by the standard diffusion approximation 关Eq. 共8兲兴.
051908-5
PHYSICAL REVIEW E 69, 051908 共2004兲
BEVILACQUA et al.
variation of the mean photon visitation depth 具¯z 典 with normalized modulation frequency ¯f for ¯␣ ⫽0.005 while Fig. 5 provides the variation with ¯␣ for ¯f ⫽0.001. As expected, 具¯z 典 increases with ¯ . For low ¯␣ , 具¯z 典 varies almost linearly with ¯ and is in apparent contradiction with the following result that Weiss et al. derived from random walk theory 关12兴:
具¯z 典 ⫽A 共 ¯ / ¯ 兲 1/2,
共11兲
where A is a constant and ¯ ⬅ 关 3 ¯␣ ( ¯␣ ⫹1) 兴 1/2 is the dimensionless effective attenuation coefficient. Closer examination of Eq. 共11兲 reveals that 具¯z 典 →⬁ as ¯␣ →0. Thus it is unlikely that Eq. 共11兲 is valid for small ¯␣ . In this regard, it is instructive to examine the results of Feng et al., who derived the following relationships for the depth at which the PSDF reaches its maximum value ¯z max 关16兴: ¯z max⫽ 共 ¯ /2¯ 兲 1/2 for ␣ Ⰷ1, ¯z max⫽
& ¯ 4
for ␣ Ⰶ1.
共12兲 共13兲
In the case of high absorption and/or large s-d separations, Eq. 共12兲 provides the same scaling law as Eq. 共11兲, namely, that 具¯z 典 ⬀¯ 1/2. However, Eq. 共13兲 predicts that in the case of low absorption and/or small s-d separations, 具¯z 典 ⬀¯ . This is precisely the behavior seen in Fig. 5. An expression that displays the proper limiting behavior for low and high absorption can be obtained through modification of Eq. 共11兲 as follows:
具¯z 典 ⫽
冋
G 共 ¯ 兲 ¯ ⫹H 共 ¯ 兲
册
1/2
,
共14兲
FIG. 4. Dimensionless mean visitation depth of the detected photons 具¯z 典 at the median plane between source and detector as a function of source-detector separation ¯ . Results are shown for a fixed normalized optical absorption ¯␣ ⫽0.005 with normalized source modulation frequencies ¯f ⫽0, 0.001, and 0.002. Symbols represent results from Monte Carlo simulations while the curves represent predictions given by the newly formulated scaling laws 关Eqs. 共15兲–共17兲兴.
G 共 ¯ 兲 ⬇1⫹0.45¯ ,
共16兲
H 共 ¯ 兲 ⬇2.86/¯ .
共17兲
The curves shown in Figs. 4 and 5 represent the predictions of Eq. 共15兲 with expressions for G(¯ ) and H(¯ ) given above. Equation 共15兲 provides excellent predictions for 具¯z 典 that typically deviate from the Monte Carlo results by less than 10% and are accurate even at small s-d separations.
where G(¯ )⫽G 1 ⫹G 2¯ and H(¯ )⫽H 1 /¯ with G 1 , G 2 , and H 1 being constants. While the form of Eq. 共14兲 can accommodate variations in both ¯ and ¯␣ it does not accommodate the variation in modulation frequency. As noted previously, increases in either ¯␣ or ¯f produce a decrease in 具¯z 典 . The similar effects of ¯␣ and ¯f on 具¯z 典 can be understood from the perspective that for small values of 关 f /( a c) 兴 the amplitude in the frequency domain can be approximated from the steady-state result by substituting replacing ¯ with its frequency-domain analog ¯k 关16兴. Thus in the frequency domain case, Eq. 共14兲 can be rewritten as
具¯z 典 ⫽
冋
G 共 ¯ 兲 ¯k ⫹H 共 ¯ 兲
册
1/2
,
共15兲
where ¯k 2 ⫽3( ¯␣ ⫹1) ( ¯␣ ⫺2 ¯f j). Performing a least squares fit of Eq. 共15兲 to the results of the Monte Carlo simulations, we find the specific forms of G(¯ ) and H(¯ ) to be
FIG. 5. Dimensionless mean visitation depth of the detected photons 具¯z 典 at the median plane between source and detector as a function of source-detector separation ¯ . Results are shown for a fixed normalized source modulation frequency is ¯f ⫽0.001 with normalized optical absorption ¯␣ ⫽0, 0.005, 0.01, 0.02, and 0.1. Symbols represent results from Monte Carlo simulations while the curves represent predictions given by the newly formulated scaling laws 关Eqs. 共15兲–共17兲兴.
051908-6
PHYSICAL REVIEW E 69, 051908 共2004兲
SAMPLING TISSUE VOLUMES USING FREQUENCY- . . .
From this analysis it is clear that increases in absorption ¯␣ and modulation frequency ¯f have similar effects on 具¯z 典 . For cases in which ( ¯␣ ⬍2 ¯f ), 具¯z 典 is more sensitive to changes in ¯f while for the opposite case in which (2 ¯f ⬍ ¯␣ ), 具¯z 典 is more sensitive to changes in ¯␣ . Equation 共15兲 also predicts that the degree of variation in 具¯z 典 produced by changes ¯f and ¯␣ is affected significantly by the s-d separation ¯ . This is illustrated in Figs. 6共a兲 and 6共b兲 where the variation of 具¯z 典 with ¯f is shown for media of different ¯␣ for s-d separations of ¯ ⫽20 and 1, respectively. At small ¯ , changes in ¯f and ¯␣ have only a minimal effect on 具¯z 典 , while at larger ¯ , their effect on 具¯z 典 is more substantial. Specifically, for a medium with absorption ¯␣ ⫽0.01, an increase in modulation frequency from dc illumination to ¯f ⫽0.005 results in a decrease in 具¯z 典 of 16% for ¯ ⫽20 while for ¯ ⫽1 the same increase in modulation frequency results in a decrease in 具¯z 典 of only ⬃1%. Similarly for a modulation frequency ¯f ⫽0.002, an increase in absorption from ¯␣ ⫽0 to 0.05 results in a 64% decrease in 具¯z 典 for ¯ ⫽20 but only a 10% decrease in 具¯z 典 for ¯ ⫽1. Again, we see that the scaling law for the mean visitation depth as expressed by Eq. 共15兲 predicts the Monte Carlo results with an accuracy of approximately 10% over this very broad range of modulation frequency, s-d separation, and optical absorption.
C. Effects of an optical heterogeneity on the PSDF
Thus far we have only presented results pertaining to homogeneous media. As discussed in Sec. II C, the PSDF not only enables the prediction of the variation of the photon scattering depth with s-d separation, optical absorption and modulation frequency, but can also be used to determine the effect of an absorbing heterogeneity on a measured signal. This latter issue is pertinent to a broad class of problems in biomedical diagnostics where detection of the presence of a localized change in absorption or scattering is desired. Relevant physiological examples include the detection of transient localized changes in optical absorption due to blood flow and oxygenation dynamics connected with neural activation in response to an external stimulus 关4,6兴. While the PSDF is formulated as a scattering density under steady-state conditions, as discussed in Secs. II B and II C, it is equivalent to the perturbation produced by a small localized heterogeneity on the measured signal. Thus the perturbation provided by a localized heterogeneity can be quickly and easily formed by subtracting the contribution of the corresponding ‘‘voxel’’ element from the overall PSDF. This relative change in the detected signal due to the presence of a optical heterogeneity in any given voxel is thus determined by computing Eq. 共10兲. The results of such a computation is depicted in Fig. 7, where the relative change in the PSDF corresponding to the detected frequency-domain 共a兲 amplitude and 共b兲 phase is shown for the same set of conditions as those used in Fig. 1; namely, for a source modulation frequency of f ⫽400 MHz detected at a s-d separation of ⫽22 mm with optical properties a ⫽0.005 mm⫺1 and s⬘ ⫽0.8 mm⫺1 .
FIG. 6. Expected value of the depth visited by the detected photons 具¯z 典 at the median plane between source and detector as a function of normalized source modulation frequency ¯f . Results are shown for various values of optical absorption in media probed at a source-detector separation of 共a兲 ¯ ⫽20 and 共b兲 ¯ ⫽1, respectively. Symbols represent results from Monte Carlo simulations while the curves represent predictions given by the newly formulated scaling laws 关Eqs. 共15兲–共17兲兴.
A comparison of Figs. 7共a兲 and 7共b兲 reveals that measurements of frequency-domain amplitude and phase are sensitive to slightly different spatial regions within a turbid medium; a fact reported in experimental studies from the groups of Sevick as well as Gratton 关18,21兴. Interestingly, the perturbation in phase produced by an optical heterogeneity located close to the tissue surface results in an increase in the detected phase while its placement at deeper regions produces a phase reduction. This occurs because the presence of an optical heterogeneity close to the surface reduces the prevalence of detected photons that possess short trajectories. Thus the detected photons possess, on average, longer trajectories and thus a larger phase accumulation. By contrast, an optical heterogeneity present at larger depths reduces the number of detected photons with very long trajectories and results in a reduction in the phase of the detected photon density wave. Figures 8共a兲 and 8共b兲 show the effect of source modulation frequency on the variation of the detected amplitude and
051908-7
PHYSICAL REVIEW E 69, 051908 共2004兲
BEVILACQUA et al.
FIG. 7. 共Color兲 Spatial maps of the relative change in the measured photon density 共a兲 amplitude and 共b兲 phase produced by a small absorption perturbation located at r ⬘ ⫽(x,y,z). Results were computed using Eq. 共10兲. This case corresponds to the PSDF shown in Fig. 1共b兲 where a medium with a ⫽0.005/mm and s⬘ ⫽0.8/mm is probed with source modulation frequency of 400 MHz using a source-detector separation ⫽22 mm with numerical aperture NA⫽0.37.
FIG. 8. Relative perturbation in measured photon density 共a兲 amplitude and 共b兲 phase produced by a small absorption perturbation placed in the midplane between source and detector at various normalized depths ¯. z Symbols represent results from Monte Carlo simulations and are connected by line segments for ease of visualization. Results are shown for a source-detector separation ¯ ⫽20 with fixed normalized optical absorption ¯␣ ⫽0.01 and normalized source modulation frequencies ¯f ⫽0, 0.002, and 0.005.
FIG. 9. Relative perturbation in measured photon density 共a兲 amplitude and 共b兲 phase produced by a small absorption perturbation placed in the midplane between source and detector at various normalized depths ¯. z Symbols represent results from Monte Carlo simulations and are connected by line segments for ease of visualization. Results are shown for a source-dector separation ¯ ⫽20 with fixed normalized source modulation frequency ¯f ⫽0.001 and normalized optical absorption ¯␣ ⫽0, 0.005, 0.02, and 0.1.
051908-8
PHYSICAL REVIEW E 69, 051908 共2004兲
SAMPLING TISSUE VOLUMES USING FREQUENCY- . . .
phase perturbation with depth in the midplane between the source and detector. As observed in the spatial distribution of the PSDF profiles, the overall sensitivity to depth decreases with an increase in modulation frequency. This is clearly seen as the perturbations in both amplitude and phase approach unity at more superficial depths as ¯f is increased. For very large modulation frequencies the amplitude perturbation can actually be positive, as shown in Fig. 8共a兲 at normalized 16 for ¯f ⫽0.005. This occurs when the condepths of ¯⬇12– z tribution of a given pixel to the detected phase is more than radians which produces an increase, as opposed to a decrease in the detected amplitude. While this may be surprising at first glance, we must recall 共Sec. II C兲 that the measured intensity is the complex sum of two photon density waves; one corresponding to the propagation of the photon density wave in homogeneous media and the other corresponding to the photon density wave scattered by the heterogeneity. Thus while the amplitude of the perturbation specified by Eq. 共9兲 is negative, at sufficiently high modulation frequencies and/or large depths, the perturbation produces destructive interference which, when combined with the negative amplitude of the scattered wave, leads to an increase in the measured intensity at the detector. A similar behavior was also measured experimentally by Svaasand et al. in their study of the dependence of planar photon density waves with source modulation frequency in layered media 关32兴. Figure 9 shows the effect of optical absorption on the variation of the 共a兲 amplitude and 共b兲 phase perturbations with depth in the midplane between the source and detector. As seen in the plots of the PSDF shown in Figs. 2 and 3, an increase in optical absorption produces an effect similar to an increase in modulation frequency. This result is in good agreement with results provided by both Sevick et al. 关21兴 and Paithankar et al. 关25兴. The observation of a crossing from positive to negative perturbations in both the amplitude and phase, represent ‘‘blind’’ locations in the sampled tissue volume, i.e., locations at which an absorbing heterogeneity can be placed without resulting in a change in the detected signal. This is an interesting feature that could be exploited to determine the depth of an absorbing heterogeneity if its lateral location is known. This can be implemented by per-
关1兴 F. F. Jo¨bsis-van der Vliet, J. Biomed. Opt. 4, 392 共1999兲. 关2兴 F. F. Jo¨bsis-van der Vliet and P. D. Jo¨bsis, J. Biomed. Opt. 4, 397 共1999兲. 关3兴 R. Richards-Kortum and E. M. Sevick-Muraca, Annu. Rev. Phys. Chem. 47, 555 共1996兲. 关4兴 D. A. Benaron, S. R. Hintz, A. Villringer, D. Boas, A. Kleinschmidt, J. Frahm, C. Hirth, H. Obrig, J. C. van Houten, E. L. Kermit, W. F. Cheong, and D. K. Stevenson, J. Cereb. Blood Flow Metab. 20, 469 共2000兲. 关5兴 A. E. Cerussi, A. J. Berger, F. Bevilacqua, N. Shah, D. Jakubowski, J. Butler, R. F. Holcombe, and B. J. Tromberg, Acad. Radiol. 8, 211 共2001兲. 关6兴 M. A. Franceschini, V. Toronov, M. E. Filiaci, E. Gratton, and
forming a photon migration measurement at multiple source modulation frequencies. IV. SUMMARY
We have developed a general Monte-Carlo-based method for assessing the tissue volume sampled in a steady-state, time-resolved, or frequency-domain photon migration measurement. The use of Monte Carlo simulations allows for accurate predictions regardless of the source-detector separation and optical properties of the medium. The method we describe allows for the determination of not only the shape and location of the photon sampling volume in a homogeneous medium, but also the perturbations in the detected photon density amplitude and phase produced by the introduction of a small absorption heterogeneity. Our results suggest that for typical tissue optical properties, the difference in tissue sampling offered by steady-state and frequency domain methods is small for modulation frequencies smaller than 600 MHz. Such a consideration is important because it provides a basis to validate combined steady-state and frequency domain measurements that have been proposed recently 关33兴. We have provided analytical scaling laws that accurately predict the mean depth sampled by the photons collected in a photon migration measurement as a function of both tissue optical properties and source modulation frequency. These scaling laws generalize previous findings and are valid over a broad range of s-d separation, optical absorption, and source modulation frequency. Finally, the proposed methodology to determine the impact of localized absorption heterogeneities on the detected signal clearly matches experimental observations that indicate that the phase and amplitude of detected photon density waves exhibit different spatial sensitivity characteristics relative to the tissue volume probed. ACKNOWLEDGMENTS
We thank Jerry Spanier and Bruce Tromberg for stimulating discussions. We are grateful to the National Institutes of Health for support under Grant Nos. P41-RR-01192 共Laser Microbeam and Medical Program兲 and R01-EB-00345.
S. Fantini, Opt. Express 6, 49 共2000兲. 关7兴 N. Shah, A. Cerussi, C. Eker, J. Espinoza, J. Butler, J. Fishkin, R. Hornung, and B. Tromberg, Proc. Natl. Acad. Sci. U.S.A. 98, 4420 共2001兲. 关8兴 M. Wolf, U. Wolf, J. H. Choi, V. Toronov, L. A. Paunescu, A. Michalos, and E. Gratton, Psychophysiology 40, 521 共2003兲. 关9兴 U. Wolf, M. Wolf, J. H. Choi, L. A. Paunescu, L. P. Safonova, A. Michalos, and E. Gratton, Adv. Exp. Med. Biol. 510, 225 共2003兲. 关10兴 B. J. Tromberg, N. Shah, R. Lanning, A. Cerussi, J. Espinoza, T. Pham, L. Svaasand, and J. Butler, Neoplasia 2, 26 共2000兲. 关11兴 T. O. McBride, B. W. Pogue, S. Poplack, S. Soho, W. A. Wells, ¨ sterberg, and K. D. Paulsen, J. Biomed. Opt. S. Jiang, U. L. O 7, 72 共2002兲.
051908-9
PHYSICAL REVIEW E 69, 051908 共2004兲
BEVILACQUA et al. 关12兴 G. H. Weiss, R. Nossal, and R. F. Bonner, J. Mod. Opt. 36, 1 共1989兲. 关13兴 M. S. Patterson, S. Andersson-Engels, B. C. Wilson, and E. K. Osei, Appl. Opt. 34, 22 共1995兲. 关14兴 S. R. Arridge, Appl. Opt. 34, 7395 共1995兲. 关15兴 S. R. Arridge and M. Schweiger, Appl. Opt. 34, 8026 共1995兲. 关16兴 S. Feng, F.-A. Zeng, and B. Chance, Appl. Opt. 34, 3826 共1995兲. 关17兴 A. H. Gandjbakhche and G. H. Weiss, Phys. Rev. E 61, 6958 共2000兲. 关18兴 G. Gratton, J. S. Maier, M. Fabiani, W. W. Mantulin, and E. Gratton, Psychophysiology 31, 211 共1994兲. 关19兴 J. C. Schotland, J. C. Haselgrove, and J. S. Leigh, Appl. Opt. 32, 448 共1993兲. 关20兴 E. M. Sevick, J. R. Lakowicz, H. Szmacinski, K. Nowaczyk, and M. L. Johnson, J. Photochem. Photobiol., B 16, 169 共1992兲. 关21兴 E. M. Sevick, J. K. Frisoli, C. L. Burch, and J. R. Lakowicz, Appl. Opt. 33, 3562 共1994兲. 关22兴 G. H. Weiss, J. Porra`, and J. Masoliver, Phys. Rev. E 58, 6431 共1998兲. 关23兴 E. Okada, M. Firbank, and D. T. Delpy, Phys. Med. Biol. 40,
2093 共1995兲. 关24兴 E. Okada, M. Firbank, M. Schweiger, S. R. Arridge, M. Cope, and D. T. Delpy, Appl. Opt. 36, 21 共1997兲. 关25兴 D. Y. Paithankar, K. T. Schomacker, and N. S. Nishioka, IEEE J. Sel. Top. Quantum Electron. 5, 1032 共1999兲. 关26兴 X. D. Zhu, S. Wei, S. C. Feng, and B. Chance, J. Opt. Soc. Am. A 13, 494 共1996兲. 关27兴 D. A. Boas, J. P. Culver, J. J. Stott, and A. K. Dunn, Opt. Express 10, 159 共2002兲. 关28兴 M. Testorf, U. Osterberg, B. Pogue, and K. Paulsen, Appl. Opt. 38, 236 共1999兲. 关29兴 R. C. Haskell, L. O. Svaasand, T-T. Tsay, T-C. Feng, M. S. McAdams, and B. J. Tromberg, J. Opt. Soc. Am. A 11, 2727 共1994兲. 关30兴 A. H. Hielscher, S. L. Jacques, L. Wang, and F. K. Tittel, Phys. Med. Biol. 40, 1957 共1995兲. 关31兴 D. A. Boas, M. A. O’Leary, B. Chance, and A. G. Yodh, Appl. Opt. 36, 75 共1997兲. 关32兴 L. O. Svaasand, T. Spott, J. B. Fishkin, T. Pham, B. J. Tromberg, and M. W. Berns, Phys. Med. Biol. 44, 801 共1999兲. 关33兴 F. Bevilacqua, A. J. Berger, A. E. Cerussi, D. Jakubowski, and B. J. Tromberg, Appl. Opt. 39, 6498 共2000兲.
051908-10