Surrey, British Columbia, Canada V3T 2W1. Email: {hhtsang, wiese}@cs.sfu.ca. AbstractâThis paper presents an algorithm for RNA sec- ondary structure ...
Proceedings of the 2007 IEEE Symposium on Computational Intelligence in Bioinformatics and Computational Biology (CIBCB 2007)
SARNA-Predict: A Study of RNA Secondary Structure Prediction Using Different Annealing Schedules Herbert H. Tsang and Kay C. Wiese School of Computing Science Simon Fraser University Surrey, British Columbia, Canada V3T 2W1 Email: {hhtsang, wiese}@cs.sfu.ca
Abstract— This paper presents an algorithm for RNA secondary structure prediction based on Simulated Annealing (SA) and also studies the effect of using different types of annealing schedules. SA is known to be effective in solving many different types of minimization problems and for being able to approximate global minima in the solution space. Based on free energy minimization techniques, this permutation-based SA algorithm heuristically searches for the structure with a free energy value close to the minimum free energy ∆G for that strand, within given constraints. Other contributions of this paper include the use of permutation-based encoding for RNA secondary structure and the swap mutation operator. Also, a detailed study of the convergence behavior of the algorithm is conducted and various annealing schedules are investigated. An evaluation of the performance of the new algorithm in terms of prediction accuracy is made via comparison with the dynamic programming algorithm mfold for thirteen individual known structures from four RNA classes (5S rRNA, Group I intron 23 rRNA, Group I intron 16S rRNA and 16S rRNA). Although dynamic programming algorithms for RNA folding are guaranteed to give the mathematically optimal (minimum energy) structure, the fundamental problem of this approach seems to be that the thermodynamic model is only accurate within 5 − 10%. Therefore, it is difficult for a single sequence folding algorithm to resolve which of the plausible lowest-energy structure is correct. The new algorithm showed comparable results with mfold and demonstrated a slightly higher specificity.
I. I NTRODUCTION ”Just when scientists thought they had deciphered the roles played by the cell’s leading actors, a familiar performer has turned up in a stunning variety of guises. RNA, long upstaged by its more glamorous sibling, DNA, is turning out to have star qualities of its own.” [1] Over the past decade, it has become evident that Ribonucleic Acid (RNA) not only plays a central role within living cells but also performs a variety of tasks in many different biological contexts. While Deoxyribonucleic Acid (DNA) consists of a sequence of molecules made from the 4 nucleotides Adenine (A), Cytosine(C), Guanine (G), and Thymine (T), RNA consists of A, C, G, and Uracil (U), which replaces Thymine. In the translation process, a ribosome uses the additional tRNA available in the cell to produce a protein where 3
1-4244-0710-9/07/$20.00 ©2007 IEEE
RNA nucleotides form a codon which encodes for one of the 20+ amino acids. Our knowledge of RNA’s importance is still expanding rapidly [2]. RNA is no longer just a passive messenger of information and scaffold for proteins, it has a central and active role in the functioning of the cell [3]. There is a resurgence of interest in the RNA secondary structure prediction problem due to the discovery of many new families of non-coding RNAs with a variety of functions [2] [3]. The functions of RNA molecules are determined largely by their three-dimensional structure. X-ray diffraction and Nuclear Magnetic Resonance (NMR) data are often too costly to be used to deduce the 3D form of a long RNA where, as in many cases, only the single RNA sequence (the primary structure), without further information regarding its functional form, is available. Computational methods for prediction of RNA secondary structure from the base sequence can help shed light on the three-dimensional structure and functions of these molecules. More fundamentally, experience with such computer algorithms can also help us understand the physical principles that determine how RNA molecules fold [4]. A. RNA Secondary Structure Prediction Algorithms Determining the secondary structure of an RNA molecule is widely seen as a first step towards understanding its biological function [4]. Comparative folding algorithms yield good results but require multiple sequences and large sample size (typical 1,000 structures), which are both time-consuming and requires significant insight [5][6]. When the number of available sequences with high similarity is small or when there is only a single RNA molecule, prediction of RNA structure based on free energy minimization is the most widely used approach. Free energy minimization of a single RNA sequence has been studied since the early 1970s [7] and a number of Dynamic Programming (DP) algorithms have been developed. Matthews [8] has provided a review to the development of these algorithms. Among these algorithms, a very popular algorithm for finding the minimum free energy (MFE) pseudoknot-free secondary structure of an RNA molecule was used by Zuker and Stiegler [9] [10]. This algorithm uses the
239
Proceedings of the 2007 IEEE Symposium on Computational Intelligence in Bioinformatics and Computational Biology (CIBCB 2007)
primary RNA sequence as input and a DP algorithm to search for a pseudoknot-free secondary structure with the MFE. Although DP algorithms for RNA folding are guaranteed to give the mathematically optimal (minimum energy) structure, the fundamental problem of this approach seems to be that the thermodynamic model is only accurate within 5 − 10%, and a surprising number of alternative RNA structures lie within 5 − 10% of the predicted global energy minimum [11]. In other words, the MFE structure is not guaranteed to be the native structure. Therefore, it is difficult for a single sequence folding algorithm to resolve which of the plausible lowestenergy structures is correct [12]. Furthermore, for reasons of computational complexity, pseudoknots are ignored in this folding program. As a result, different researchers had tried different heuristic approaches: Van Batenburg [13] has shown that it is possible to approximate the folding pathway of an RNA molecule via a genetic algorithm by adding and deleting stems. Furthermore, it is reasonable to expect that most RNA molecules exist naturally in their most thermodynamically stable configurations [4]. This is generally believed to be a state close to minimum ∆G. Based on the hypothesis that the natural folding process of RNA into a minimum energy state is very similar to the annealing process, a stochastic optimization algorithm such as SA should be a good candidate for solving this problem. Schmitz and Steger’s [14] research used Simulated Annealing (SA) for RNA secondary structure prediction. However, their research was only able to provide very limited results from a single RNA sequence (PSTVd) and they could only claim that “the examples shown for PSTVd RNA agree with experimental data”, without any quantitative results reported. As a result, their results were very narrow and the significance of the approach was not well established. In contrast, the proposed algorithm SARNA-Predict not only uses a more efficient permutation-based encoding for the RNA secondary structure, but also uses a novel mutation operator for structural mutation. Today, most algorithms that predict RNA secondary structures cannot easily predict non-nested structures, such as pseudoknots. Pseudoknots are tertiary RNA structure that are formed by Watson-Crick pairing between a secondary loop structure and compliment bases outside the loop. The general problem of predicting RNA secondary structures including pseudoknots has been proven to be NP-complete for an idealized thermodynamic model [15]. Because of the limitation of our current thermodynamic model, the current reported results of SARNA-Predict are only those that are pseudoknot free structures. However, SARNA-Predict is capable in principle of predicting structures with pseudoknots. This paper presents results based on previous work [16] in an algorithm for RNA secondary structure prediction based on Simulated Annealing (SA) and also includes studies in the effect of using different types of annealing schedules. The permutation-based encoding for RNA secondary structures of the proposed algorithm is based on a permutation-based Evolutionary Algorithm (EA) [17]. In this encoding, different helices
were encoded as a permutation, where the final candidate RNA secondary structure can be obtained by a decoder. In addition, the current algorithm employs a modified SA as its search engine. This is facilitated by combining a novel mutation operator and different annealing schedules. Overall, the algorithm has shown excellent results. The objectives of this paper are as follows: • To present a permutation-based simulated annealing algorithm for RNA secondary structure prediction based on free energy minimization techniques (SARNA-Predict). • To study the effect of an adaptive annealing schedule for RNA secondary structure prediction. • To improve the prediction accuracy of longer structures (> 100 nt) by measuring the results of SARNA-Predict against the results of a DP algorithm (mfold). The predicted structures will be compared to thirteen individual known native structures from four RNA classes (5S rRNA, Group I intron 16S rRNA, Group I intron 23S and 16S rRNA). II. M ETHOD : SARNA-P REDICT 1) Permutation-based coding for RNA secondary structure: The primary structure of RNA is an oriented linear sequence of four nucleotides, denoted G, C, A and U (guanine, cytosine, adenine, and uracil). RNA is a single stranded sequence and this strand can fold back onto itself. Intra-molecular base pairs can form between different nucleotides, folding the sequence onto itself. The most stable and common of these base pairs are GC, AU, and GU, and their mirrors, CG, UA, and UG. These pairs are called canonical base pairs. A base pair does not form in isolation in this model. It considers stacked pairs, or helices, to form only when three or more adjacent pairs form. Also, the loop connecting the stacked pair must be at least three nucleotides in length. By using these rules, it is possible to enumerate all the possible helices under our model that can form in a structure. The challenge is in predicting which ones will actually form in the native structure. The collective listing of the paired bases of an RNA strand defines the secondary structure. The RNA secondary structure of the proposed algorithm is encoded as a permutation which allows SARNA-Predict to solve the RNA folding problem. Using SARNA-Predict, we can view the problem of predicting the secondary structure of RNA as one of picking the subset S of helices from the set of all possible helices H, such that the free energy E(S) is minimized and that no helices in S share one or more bases. If the set of all helices, H, contains n helices, then a permutation of length n may be used to represent a candidate solution. The order in which a helix appears in the permutation is the order in which it is picked by the decoder to be inserted into the final structure. Helices that are incompatible with any previously selected helices are rejected. For example, for a given permutation, Pi = hh1 , ...hi ...hj ...hn i, where n is the total number of possible helices, if the helix h2 is in conflict with h3 (they share one or more bases), then during the decoding, h3 will not be included into the final structure.
240
Proceedings of the 2007 IEEE Symposium on Computational Intelligence in Bioinformatics and Computational Biology (CIBCB 2007)
The main advantage of this approach is that this algorithm will ensure that only valid secondary structures are produced by the SARNA-Predict. 2) Algorithm: Simulated annealing (SA) was originally motivated by the physical annealing process [18], it mimics this process of material being heated and then slowly cooled into a uniform structure. Thirty years later, Kirkpatrick et al. [19] were the first to apply SA to optimization problems. SARNA-Predict, a SA based algorithm for RNA secondary structure prediction is shown in Figure 1. 1 2 3
Structure = Initial_Structure; FreeEnergy = Evaluate(Structure); Temperature = Initial_Temperature;
4 5 6 7 8 9
While (Temperature > Final_Temperature) for (i=1 to Number_of_iterations) New_Structure = Mutate(Structure); New_FreeEnergy = Evaluate(New_Structure); Delta_Energy = New_FreeEnergy - FreeEnergy; if (Delta_Energy 0, the new structure will also be accepted with some probability. The Boltzmann distribution is used to determine this probability. The probability of accepting the new structure when ∆Energy > 0 is given by Equation 1, where temperature T is the current temperature (a control parameter in the annealing process) and E is the energy state. This distribution expresses the idea that a system in thermal equilibrium at temperature T has its energy probabilistically distributed among all different energy states (or values of ∆Energy). Even at low temperature, there is a chance of the system being accepted. P robability[Accept] = e
−(Enew −Eold ) T
=e
−∆Cost T
(1)
Notice that when Enew < Eold , this probability is greater than unity; in such cases the change is arbitrarily assigned a probability P = 1 (i.e. the system always takes such an option). As a result, this general scheme will most often accept a new structure with lower free energy ∆G than the previous one, but sometime will accept a structure with a higher ∆G. Also, if T is decreased slowly enough, SARNA-Predict is guaranteed to reach the best solution. However, it will take
an infinite number of moves. Furthermore, if T is high, the algorithm is in an exploratory phase (all moves have about the same probability), and if T is low, the algorithm is in an exploitation phase (the greedy moves are most likely). 3) Cost Function: The main purpose of a cost function is to evaluate the appropriateness of the current structure. The method used here to evaluate the appropriateness of the current structure with the previous best known structure. ∆Cost = ∆G(Snew ) − ∆G(Sold )
(2)
where Snew is the current configuration and Sold is the old configuration. For the minimization problem, if the new cost is less than the current cost, then the new structure should be kept since the new structure is closer to the goal than the current structure. In this study, we used the Individual Nearest Neighbor with Hydrogen Bonds (INN-HB) Model [20], where we calculate Gibbs free energy ∆G for an RNA secondary structure in terms of the thermodynamic free energies of the individual helices. The cost function will be the evaluation of the current free energy of the current structure. INN-HB [21] was used as it has been demonstrated to yield good results [20]. 4) Mutation Operator: The main goal of the mutation operator is to alter the structure in a controlled and intuitive fashion. It randomly chooses control points and moves them by a random amount to alter the structure. In this research, we have implemented a novel combination of permutation-based encoding and swap mutation as our mutation function [22]. In swap mutation, two random points are selected and the two digits at these positions are interchanged. For a permutation vector, p = hH1 , ...Hi ...Hj ...Hn i a swap mutation is defined as pold = hH1 , ...Hi ...Hj ...Hn i → pnew = hH1 , ...Hj ...Hi ...Hn i (3) where i and j ∈ [1, n] are randomly chosen positions. There are different flavors of this swap mutation; in the classical SA sense, each perturbation step will only swap by one swap mutation step. The difference between the new conformation and the old conformation is one step. A second original mutation operator used was the percentage swap mutation operator, where the number of swap mutations is the product of the percentage of the total number of available helices and the current annealing temperature. As a result, it is possible to have multiple swap mutations occurring per single perturbation step, with the number of swap mutations related to the annealing schedule via the annealing temperature parameter. NSwap = TCurrent × P
(4)
where NSwap is the number of swap mutations performed, TCurrent is the current temperature of the annealing schedule and P is the percentage of the total number of available helices.
241
Proceedings of the 2007 IEEE Symposium on Computational Intelligence in Bioinformatics and Computational Biology (CIBCB 2007)
5) Convergence of Simulated Annealing for the RNA domain: One of the most important advantages of Simulated Annealing is that it can be shown that, for any given finite problem, the probability of the simulated annealing algorithm terminating with the global optimal solution asymptotically approaches 1 as the annealing schedule is extended [23]. As Azencott [24] outlined, consider an arbitrary finite set S, which is the configuration space. In our case S is the set of all possible RNA secondary structures for a particular sequence. Let ∆G : S → IR be the function that calculates the score in free energy ∆G. By definition, this is a generic sequential annealing algorithm on S generating a random sequence Xn ∈ S of configurations that will tend to concentrate, as n → ∞, on the set of absolute minima of ∆G. Configuration i ∈ S is said to be a local minimum of the energy ∆G if ∆Gi ≤ ∆Gj f or j ∈ Si ,
(5)
and a global minimum of ∆G if ∆Gi = inf ∆Gj , j∈S
(6)
calling Smin the set of configurations that are the global minima of ∆G. Also, the cooling schedule (Tn ) is asymptotically good if it satisfies lim P (Xn ∈ Smin ) = 1 (7) n→∞
Geman et al. [23] first proved a necessary and sufficient condition for the convergence of the algorithm to the global minimum. They showed that if lim Tn log(n) ≥ R ≥ 0
n→∞
(8)
with R large enough, then Equation 7 holds. The best value of the constant has been computed by Hajek [25], who linked it precisely to the energy landscape. 6) Annealing Schedule: A finite time implementation of the SA algorithm can be realized by generating Markov chains of finite length for a finite sequence of descending values of temperature. To achieve this, one must specify a set of parameters that governs the convergence of the algorithm. These parameters are combined in a so-called annealing schedule [26]. Starting from a configuration S, the Metropolis procedure simulates an equilibration process for a fixed temperature T , usually over a large number of time steps. To simulate the cooling in the physical paradigm, we need only to repeat the Metropolis procedure for decreasing temperatures, i.e. To > T1 > ... > Tf inal
(9)
which produces gradually decreasing free energies ∆G(S) of the configurations
Often, the most difficult step in the annealing process is the development of an appropriate annealing schedule. To ensure the success of the optimization, the temperature (control parameter) must be manipulated so that it is high enough to move off a local minimum, but low enough not to move off a global minimum. Due to the wide variety and complicated nature of most combinatorial optimization problems, the most suitable annealing schedule will be unique for each problem. Ideally, the temperature should be lowered slow enough to ensure that a good minimum is achieved, but also quick enough so that computational time is minimized. In practice, the classes of annealing schedules that are most widely used have the following features [26] [27]: • A high starting acceptance probability • A very low terminating acceptance probability • A slow cooling rate, α ∈ [0, 1[ i.e. where α between 0.8 and 0.99 is a recommended value, Tnew = αTold . • The number of iterations is equal to the number of neighboring solutions. Neighboring solutions are defined as two adjacent states that can be reached by a single move (i.e. (s, s0 ) ∈ M ) Specifically, an annealing schedule specifies a finite sequence of temperature values, which include the following: a) an initial temperature (starting acceptance probability), b) a decrement function for decreasing temperature (cooling rates), c) a final temperature (stop criterion) and d) a finite number of iterations at each temperature There are several theoretical and empirical cooling schedules suggested in the literature that can be categorized into classes such as monotonic schedules, adaptive schedules, geometric schedules and quadratic cooling schedules [28]. For further information, readers can refer to Hajek [25], Huang et al. [29], and Thompson and Dowsland [30]. In the current incarnation of SARNA-Predict, three different types of annealing schedules were evaluated and they are shown in Table I. Geometric schedule is defined as Tnew = αTold , where α is the cooling ratio (set to 0.95); Tnew and Told are the new and old temperature values respectively. We are using the adaptive schedule as described in [31]. In the adaptive schedule, the length of a subchain with constant temperature is set to the number of the local neighborhood. The number of iterations per temperature is reduced according to equation 11. Tn = Tn−1 (1 +
ln(1 + δ)Tn−1 −1 ) 3σ(Tn−1 )
(11)
where σ(Tn−1 ) is the standard deviation of the values of the cost function at the current temperature and δ is the distance parameter. The size of δ determines the speed of the reduction of the temperature and Aarts et al. [31] suggests the value δ = 0.1. III. R ESULTS
∆G(S0 ) ≥ ∆G(S1 ) ≥ ... ≥ ∆G(Sf inal )
(10)
with S0 denoted as the structure from temperature step zero and S1 as structure from temperature step one.
A. Different Annealing Schedules Thirteen RNA sequences were taken as test data from the Comparative RNA Web Site [32]; they were chosen to provide
242
Proceedings of the 2007 IEEE Symposium on Computational Intelligence in Bioinformatics and Computational Biology (CIBCB 2007)
(a)
(b)
(c)
(d)
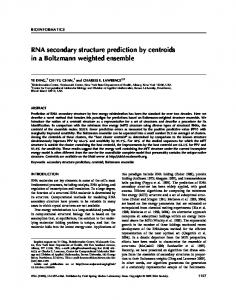
Fig. 2. Plots of a typical run of the Hildenbrandia rubra Group I intron, 16S rRNA (L19345) sequence. (a) showing the energy landscape using classical SA with a geometric schedule and (b) showing the comparison of energy landscape of the classical SA and percentage swap mutation using geometric schedule. (c) showing the energy landscape of using percentage swap mutation and using adaptive schedule. (d) showing a comparison of all three combinations on the same scale. TABLE I T HREE DIFFERENT TYPES OF SA Perturbation Modified SA (multiple swap mutations move per perturbation step) Classical SA (one mutation move per perturbation step) Modified SA (multiple swap mutation move per perturbation step)
This figure presents the graph which indicates the maximum and minimum free energies that were being accepted during a single run. Notice that during the initial stage where the temperature values were high, the probability to accept a structure with a higher energy was higher. As the temperature decreased, fewer structures with higher energy were accepted. Hence, we can observe the convergence behavior of the algorithm. After about 601,000 moves, the lowest free energy value reached was -219.28 kcal/mol.
BEING INVESTIGATED
Coding Permutation
Schedule Geometric
Permutation
Geometric
Permutation
Adaptive
a good variety of sequence lengths, organisms and RNA types. Each sequence chosen had a known structure available for comparison, determined by comparative methods. Fig. 2 shows the results from a variety of different SARNA-Predict runs for the Hildenbrandia rubra Group I intron, 16S rRNA (L19345) sequence using different schedules. In particular, Fig. 2a shows the results of using the geometric schedule.
Also, when the classical SA was compared to the modified SA (Fig. 2b), modified SA found the conformation with a lower energy structure sooner than classical SA. This is probably due to the multiple swap mutations occurring in a single perturbation step, which gives the algorithm an opportunity to explore more conformations in a shorter period of time when compared to the classical SA method which only has a single swap mutation per perturbation step.
243
Proceedings of the 2007 IEEE Symposium on Computational Intelligence in Bioinformatics and Computational Biology (CIBCB 2007)
Fig. 2c shows a typical single run with percentage swap mutation combined with permutation-based coding and adaptive schedule, where the adaptive schedule was implemented according to Aarts et al. [31]. As Equation 11 indicates, to calculate the temperature parameters it is necessary to calculate the standard deviation of the value of the cost function of the Markov chain, as a result the time to convergence is much longer than for other schedulers, such as the geometric scheduler. Fig. 2d shows three different runs with three different annealing schedules and perturbation methods as described in Table I. One clearly sees that the adaptive schedule took the longest time to run (about three times as long as classical SA and nine times as long compared to modified SA). The adaptive schedule has to compute the factor that decreases the temperature as the algorithm proceeds, therefore requiring the consumption of a large amount of CPU time during the SA run. Comparing the quality of the structures quantitatively, Table II and Table III show the results of Drosophila virilis 16S rRNA (X05914) by using the adaptive schedule and the geometric schedule respectively. Table II show the best overall structure that gives the maximum correct base pair matches of 34.3% at ∆G = −178.83 kcal/mol was found with the 0.2% swap mutation and 1,800 temperature subchain length. Also note that the structure with the lowest energy value of ∆G = −184.42 kcal/mol had only 23.6% corresponding base pair matches. In Table II, the first column shows the cooling ratio governing the lowering of the temperature. The second column shows the percentage of the total number of permutations possible. The third column shows the size of the temperature subchain, which is the number of moves per temperature step. The fourth column records the average correct base pairs in 100 runs. The fifth column records the maximum number of correct base pairs when comparing the predicted structure with the native structure. Column six shows the corresponding free energy according to the INN-HB thermodynamic model. In comparison, Table III shows the results of the modified SA with adaptive schedule. The best overall structure that gives the maximum correct base pair matches of 24.8% at ∆G = −200.61 and −199.89 kcal/mol. Table IV and Table V show the results of Hildenbrandia rubra Group I intron, 16S rRNA (L19345) by using the adaptive schedule and the geometric schedule respectively. Table IV show the best overall structure that gives the maximum correct base pair matches of 57.2% at ∆G = −220.00 kcal/mol was found with the 0.3% swap mutation and 1,600 temperature subchain length. Also note that the structure with the lowest energy value of ∆G = −225.89 kcal/mol had only 51.4% corresponding base pair matches. In comparison, Table V show the best overall structure that gives the maximum correct base pair matches of 59.4% at ∆G = −222.77 kcal/mol. As the above results indicated, the modified SA with adaptive schedule does not show significant improvement in terms of the final results in terms of maximum correct base pair matches when compared to modified SA with geometric
TABLE II R ESULTS OF COMPARISON WITH NATIVE Drosophila virilis 16S rRNA (X05914) STRUCTURE USING GEOMETRIC
SCHEDULE GROUPED BY
NUMBER OF RANDOM SWAP MUTATIONS AND THE SIZE OF THE TEMPERATURE SUBCHAIN .
Cooling Ratio
0.95 0.95 0.95 0.95 0.95 0.95 0.95 0.95 0.95 0.95 0.95 0.95
% of swap mutations 0.1 0.1 0.1 0.1 0.1 0.1 0.2 0.2 0.2 0.2 0.2 0.2
Temp. subchain 2000 1800 1600 1400 1200 1000 2000 1800 1600 1400 1200 1000
B EST RESULTS ARE IN BOLD . Average Correct BP’s (%) 12.05 12.83 12.19 12.48 12.29 12.85 11.93 12.64 12.39 12.19 11.76 12.77
Max. Correct BP’s (%) 23.6 24.8 24.8 27.0 23.6 23.6 27.0 34.3 29.6 25.3 23.6 21.8
∆G (kcal/mol)
-184.42 -172.10 -176.10 -171.27 -161.89 -176.63 -174.08 -178.83 -179.56 -180.85 -179.90 -170.28
TABLE III R ESULTS OF COMPARISON WITH NATIVE Drosophila virilis 16S rRNA (X05914) STRUCTURE GROUPED BY NUMBER OF RANDOM SWAP MUTATIONS ( PERCENTAGE MUTATION ) USING ADAPTIVE SCHEDULE AND INN-HB number of swap mutations 0.2 0.2 0.2 0.2
THERMODYNAMIC MODEL .
Temp. subchain 1600 1800 2000 2200
Average Correct BP’s (%) 12.41 12.54 11.90 11.39
B EST RESULTS ARE IN BOLD . Max. Correct BP’s (%) 24.8 24.8 23.6 21.0
∆G (kcal/mol) -200.61 -199.89 -198.48 -201.74
schedule. (For Drosophila virilis 16S rRNA (X05914), 24.8% compared to 34.3% and for Hildenbrandia rubra Group I intron, 16S rRNA (L19345) 59.4% compared to 57.2%.) Also, the amount of time necessary to run the algorithm for modified SA with adaptive schedule is prohibitively long (see Fig. 2). Therefore, we continue our study with modified SA with geometric schedule. B. Comparison to mfold Here, we compare the prediction performance of SARNAPredict with the popular dynamic programming algorithm mfold which uses a complex thermodynamic free energy model [10]. Table VI used the metrics derived from Baldi et al. [33] for comparison. In Table VI, “Known bps” is the total number of base pairs present in the known structure. “Predicted bps” is the total number of base pairs present in the predicted structure. “TP” is the true positive base pair count where the predicted base pairs are present in the known structure. “FP” is the false positive base pair count where the predicted base pairs are not present in the known structure. “FN” is the false negative base pair count where the base pairs are present in the known structure and not in the predicted structure. Using these numbers, sensitivity, specificity, and F-measure were computed according to these formulas: “Sensitivity (%)” = T P/(T P +
244
Proceedings of the 2007 IEEE Symposium on Computational Intelligence in Bioinformatics and Computational Biology (CIBCB 2007) TABLE IV
IV. C ONCLUSION
R ESULTS OF COMPARISON WITH NATIVE Hildenbrandia rubra Group I intron, 16S rRNA (L19345) STRUCTURE USING
GEOMETRIC SCHEDULE
GROUPED BY NUMBER OF RANDOM SWAP MUTATIONS .
B EST RESULTS
ARE IN BOLD .
Cooling Ratio
0.95 0.95 0.95 0.95 0.95 0.95 0.95 0.95 0.95 0.95 0.95 0.95
% of swap mutations 0.2 0.2 0.2 0.2 0.2 0.2 0.3 0.3 0.3 0.3 0.3 0.3
Temp. subchain 2000 1800 1600 1400 1200 1000 2000 1800 1600 1400 1200 1000
Average Correct BP’s (%) 33.61 31.97 30.33 30.11 27.16 28.23 31.39 33.76 31.98 31.36 32.05 30.88
Max. Correct BP’s (%) 51.4 50.0 53.6 48.5 51.4 54.3 53.6 56.4 57.2 50.0 53.6 54.3
∆G (kcal/mol)
-225.89 -215.64 -222.03 -209.35 -217.13 -216.88 -223.91 -218.43 -220.00 -215.86 -214.21 -213.09
TABLE V R ESULTS OF COMPARISON WITH NATIVE Hildenbrandia rubra Group I intron, 16S rRNA (L19345) STRUCTURE GROUPED BY NUMBER OF RANDOM SWAP MUTATIONS ( PERCENTAGE MUTATION ) USING ADAPTIVE SCHEDULE AND
INN-HB
number of swap mutations 0.2 0.2 0.2 0.2
THERMODYNAMIC MODEL .
Temp. subchain 1800 2000 2200 2400
Average Correct BP’s (%) 31.97 33.44 33.38 33.64
B EST RESULTS ARE IN BOLD . Max. Correct BP’s (%) 51.4 59.4 58.6 54.3
∆G (kcal/mol) -224.85 -220.77 -224.45 -219.76
F N ) × 100. “Specificity (%)” = T P/(T P + F P ) × 100. “Fmeasure (%)” = 2× specificity × sensitivity / (specificity + sensitivity) ×100. F-measure is a single performance measure for a predictor which combines both specificity and sensitivity into a single measure. Table VI summarizes the comparison of the best structure from SARNA-Predict and mfold. mfold not only attempts to find the structure with the minimum energy, it also searches for sub-optimal structures, which may be closer to the native structure. To make the following comparison, the mfold results were generated from the web server version 3.1 with default settings chosen. The structures with energy values ranked in the lowest 5% were chosen. These sub-optimal structures were then compared against the prospective native structures. Table VI shows the comparison of various mfold results for the different sequences with SARNA-Predict results. We found that SARNA-Predict showed comparable average results when compared to mfold, even though mfold employs a much more sophisticated thermodynamic model than SARNAPredict’s INN-HB. SARNA-Predict was within 1.4% in terms of Sensitivity, outperforming by 0.5% in terms of Specificity and within 0.4% of average F-measure when compared to mfold.
We have presented a permutation-based simulated annealing algorithm for RNA secondary structure prediction (SARNAPredict). This paper comprises four significant contributions to the general problem of RNA secondary structure prediction: a) the use of permutation based encoding for RNA secondary structure in an SA algorithm, b) the swap mutation operator, c) a successful proof of concept in employing SA in RNA secondary structure prediction with comparable results to mfold and d) the studies of the impact in using different annealing schedules were examined. The results of thirteen RNA sequences from a variety of sequence lengths and organisms were tested in respect to a leading RNA secondary structure prediction algorithm, mfold. Overall, the prediction accuracy of SARNA-Predict was found to be very good for structures with shorter sequences such as 5S rRNA. Comparing the three types of annealing schedules investigated, the modified SA with geometric scheduler provided a faster convergence behavior. Even though the adaptive scheduler in a long run can find a structure with a lower minimum free energy, the amount of running time may prohibit its use in a practical sense for longer sequences. In comparing with mfold, the SA algorithm shows comparable results (in terms of F-measure) even with a less sophisticated thermodynamic model. In terms of average Specificity, the SA algorithm has provided surpassing results. In future work, it will be important to consider incorporating different thermodynamic models into the SA algorithm since it is a main factor in controlling the annealing process. mfold showed a slight advantage over SARNA-Predict in terms of Sensitivity which may be due to its more sophisticated thermodynamic model. Also in the current model, non-canonical base pairs such as CU and GA were not considered either by SARNA-Predict or mfold; however, such non-canonical base pairs are found in these native RNA structures. Future work includes modeling of non-canonical base pairs to further increase the prediction performance of SARNA-Predict. While rRNA structure is relevant to its function [34], in future studies we plan to include other types of RNA as well. Another topic for further investigation is finding an optimized adaptive schedule and a possible hybridization of the SA approach with an EA.
245
R EFERENCES [1] J. Couzin, “Breakthrough Of The Year: Small RNA Make Big Splash,” Science, vol. 298, no. 5602, pp. 2296–2297, 2002. [2] R. W. Simons and M. Grunberg-Manago, Eds., RNA Structure and Function. Planview, NY: Cold Spring Harbor Lab. Press, 1997. [3] P. Nissen, J. Hansen, N. Ban, P. B. Moore, and T. A. Steitz, “The Structural Basis of Ribosome Activity in Peptide Bond Synthesis,” Science, vol. 289, no. 5481, pp. 920–930, 2000. [4] I. T. Jr and C. Bustamante, “How RNA folds,” Journal of Molecular Biology, vol. 293, no. 2, pp. 271–281, 1999. [5] C. Y. Chan, Y. Ding, and C. E. Lawrence, “Structure clustering features on the Sfold web server,” Bioinformatics, vol. 21, no. 20, pp. 3926–3928, 2005. [6] S. Washietl, I. L. Hofacker, and P. F. Stadler, “From The Cover: Fast and reliable prediction of noncoding RNAs,” PNAS, vol. 102, no. 7, pp. 2454–2459, 2005.
Proceedings of the 2007 IEEE Symposium on Computational Intelligence in Bioinformatics and Computational Biology (CIBCB 2007) TABLE VI C OMPARISON OF THE HIGHEST MATCHING BASE PAIR
STRUCTURES RESULTS FROM
SARNA-Predict AND mfold
PREDICTION ALGORITHM IN TERMS OF
S ENSITIVITY, S PECIFICITY AND F- MEASURE . B EST RESULTS ARE IN BOLD . Sequence (accession number)
Length (nt)
S. cerevisiae (X67579) H. marismortui (AF034620) M. anisopliae (3) (AF197120) M. anisopliae (2) (AF197122) A. lagunensis (U40258) H. rubra (L19354) A. griffini (U02540) C. elegans (X54252) D. virilis (X05914) X. laevis (M27605) H. sapiens (J01415) A. fulgens (Y08511) S. acidocaldarius (D14876) Average
118 122 394 456 468 543 556 697 784 945 954 964 1494
RNA Class
5S rRNA 5S rRNA Group I intron, Group I intron, Group I intron, Group I intron, Group I intron, 16S rRNA 16S rRNA 16S rRNA 16S rRNA 16S rRNA 16S rRNA
23S 23S 16S 16S 16S
[7] I. Tinoco, O. C. Uhlenbeck, and M. D. Levine, “Estimation of secondary structure in ribonucleic acids,” Nature, vol. 230, pp. 362–267, 1971. [8] D. H. Mathews, “Revolutions in RNA secondary structure prediction,” Journal of Molecular Biology, vol. 359, pp. 526–532, 2006. [9] M. Zuker and P. Stiegler, “Optimal computer folding of large RNA sequences using thermodynamics and auxiliary information,” Nucl. Acids. Res., vol. 9, no. 1, pp. 133–148, 1981. [10] M. Zuker, “Mfold web server for nucleic acid folding and hybridization prediction,” Nucleic Acids Research, vol. 31, no. 13, pp. 3406–3415, 2003. [11] S. R. Eddy, “How do RNA folding algorithms works?” Nature Biotechnology, vol. 22, no. 11, pp. 1457–1458, 2004. [12] J. Reeder, M. H¨oschsmann, M. Rehmsmeier, B. Voß, and R. Giegerich, “Beyond Mfold: recent advances in RNA bioinformatics,” Journal of Biotechnology, vol. 124, no. 1, pp. 41–55, 2006. [13] F. H. D. V. Batenburg, A. P. Gultyaev, and C. W. A. Pleij, “An APLprogrammed genetic algorithm for the prediction of RNA secondary structure,” Journal of Theoretical Biology, vol. 174, no. 3, pp. 269–280, 1995. [14] M. Schmitz and G. Steger, “Description of RNA folding by simulated annealing,” Journal of Molecular Biology, vol. 255, no. 1, pp. 254–266, 1996. [15] R. B. Lyngso; and C. N. S. Pedersen, “Pseudoknots in RNA secondary structures,” in Proceedings of the fourth annual international conference on Computational molecular biology. ACM Press, 2000, pp. 201–209. [16] H. H. Tsang and K. C. Wiese, “SARNA-Predict: A simulated annealing algorithm for RNA secondary structure prediction,” in Proceedings of the 2006 IEEE Symposium on Computational Intelligence in Bioinformatics and Computational Biology. CIBCB’06, 2006, pp. 466–475. [17] K. C. Wiese and A. Hendriks, “Comparison of P-RnaPredict and mfold - algorithms for RNA secondary structure prediction,” Bioinformatics, vol. 22, no. 8, pp. 934–942, 2006. [18] N. Metropolis, A. Rosenbluth, M. Rosenbluth, A. Teller, and E. Teller, “Equation of state calculations by fast computing machines,” Journal of Chem. Phys., vol. 21, no. 6, pp. 1087–1092, 1953. [19] S. Kirkpatrick, C. D. Gelatt, and M. P. Vecchi, “Optimization by simulated annealing,” Science, Number 4598, 13 May 1983, vol. 220, 4598, pp. 671–680, 1983. [20] A. Deschˆenes and K. C. Wiese, “Using stacking-energies (INN and INNHB) for improving the accuracy of RNA secondary structure prediction with an evolutionary algorithm - a comparison to known structures,” in Proceedings of the 2004 IEEE Congress on Evolutionary Computation. Portland, Oregon: IEEE Press, 20-23 June 2004, pp. 598–606. [21] T. Xia, J. S. Jr., M. E. Burkard, R. Kierzek, S. J. Schroeder, X. Jiao, C. Cox, and D. H. Turner, “Thermodynamic parameters for an expanded nearest-neighbor model for formation of RNA duplexes with WatsonCrick base pairs,” Biochemistry, vol. 37, pp. 14 719–14 735, 1998.
Known bps
rRNA rRNA rRNA rRNA rRNA
37 38 120 115 113 138 131 189 233 251 266 265 468 181.8
Sensitivity (%) SA mfold 89.2 89.2 71.1 76.3 62.5 76.7 47.0 45.2 64.6 65.5 57.3 60.1 66.4 72.5 29.6 21.2 34.3 35.2 44.6 45.0 43.6 35.7 35.1 27.9 48.3 57.9 53.1 54.5
Specificity (%) SA mfold 84.6 80.5 90.0 85.3 62.0 79.3 41.2 39.1 55.3 55.6 48.8 49.7 51.8 54.6 27.7 18.4 33.5 32.5 44.3 46.1 47.5 36.8 37.0 30.7 50.0 54.6 51.5 51.0
F-measure (%) SA mfold 86.8 84.6 79.4 80.6 62.2 78.0 43.9 41.9 59.6 60.2 47.8 54.4 58.2 62.3 28.6 19.7 33.9 33.8 44.4 45.6 45.5 36.3 36.0 29.3 49.1 56.2 52.1 52.5
[22] A. E. Eiben and J. E. Smith, Introduction to Evolutionary Computing. SpringerVerlag, 2003. [23] S. Geman and D. Geman, “Stochastic Relaxation, Gibbs Distributions, and the Bayesian Restoration of Images,” IEEE Transactions on Pattern Analysis and Machine Intelligence, vol. 6, pp. 721–741, 1984. [24] R. Azencott, Simulated annealing: parallelization techniques. New York: John Wiley & Sons, 1992. [25] B. Hajek, “Cooling schedules for optimal annealing,” Mathematics of Operation Research, vol. 13, pp. 311–329, 1988. [26] Y. Li, “Directed annealing search in constraint satisfaction and optimisation,” Ph.D. dissertation, University of London, Imperial College of Science, Technology and Medicine, London, 1997. [27] E. Aarts and J. Korst, Simulated Annealing and Boltzmann Machines: a stochastic approach to combinatorial optimization and neural computing. Chicester: John Wiley & Sons Ltd., 1989. [28] N. Azizi and S. Zolfaghari, “Adaptive temperature control for simulated annealing: a comparative study,” Computers & Operations Research, vol. 31, no. 1, pp. 2439–2451, 2004. [29] M. D. Huang, F. Romeo, and A. Sangiovanni-Vincentelli, “An efficient general cooling schedule for simulated annealing,” in IEEE international conference on computer aided design,Santa Clara, USA, 1986, pp. 381– 284. [30] D. K. Thompson J, “General cooling schedules for a simulated annealing based timetabling system,” in Proceedings of the first international conference on the practice and theory of automated timetabling, Napier University, Edinburgh, September 1995, pp. 144–166. [31] E. H. L. Aarts, F. M. J. de Bont, E. H. A. Habers, and P. J. M. van Laarhoven, “Parallel implementations of the statistical cooling algorithm,” Integration, the VLSI Journal, vol. 4, no. 3, pp. 209–238, 1986. [32] J. Cannone, S. Subramanian, M. Schnare, J. Collett, L. D’Souza, Y. Du, B. Feng, N. Lin, L. Madabusi, K. Muller, N. Pande, Z. Shang, N. Yu, and R. Gutell, “The comparative RNA web (CRW) site: an online database of comparative sequence and structure information for ribosomal, intron, and other RNAs: Correction,” BMC Bioinformatics, vol. 3, no. 1, p. 15, 2002. [33] P. Baldi, S. Brunak, Y. Chauvin, C. A. F. Andersen, and H. Nielsen, “Assessing the accuracy of prediction algorithms for classification: an overview,” Bioinformatics, vol. 16, no. 5, pp. 412–424, 2000. [34] M. A. Xaplanteri, A. D. Petropoulos, G. P. Dinos, and D. L. Kalpaxis, “Localization of spermine binding sites in 23s rRNA by photoaffinity labeling: parsing the spermine contribution to ribosomal 50s subunit functions,” Nucleic Acids Research, vol. 33, no. 9, pp. 2792–2805, 2005.
246