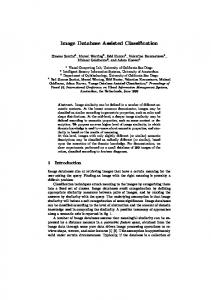
Satellite Image Classification using the Back Propagation Algorithm of Artificial Neural Network. Mrs. Ashwini T. Sapkal V. I.T. Pune
[email protected] Mob. no. 9372172260
Mr. Chandraprakash Bokhare Reliance communication Mumbai
Abstract: The resolution of remote sensing images increases every day, raising the level of detail and the heterogeneity of the scenes. Most of the existing geographical information systems classification tools have used the same methods for years. With these new high-resolution images, basic classification methods do not provide satisfactory results. In this paper, we have implemented two different algorithms namely K-means Algorithm and Back Propagation Algorithm of ANN for Segmentation and Classification of Satellite images. Wide database of images has been used to test both the algorithms. The paper also shows the comparison of the results obtained by implementing both algorithms. The comparison of results shows good accuracy in both the methods. Keywords: ANN: Artificial Neural Network, Segmentation: The Segmentation is a process, which extracts the outline of the ground objects by defining homogeneous regions. Image Classification: It is a process of sorting all the pixels in an image into a finite number of individual classes. 1.0 Introduction The objective of this paper is to provide an effective segmentation and classification tool. In order to better explain the structure of this work, the preliminary information about the Satellite Image and Remote Sensing is discussed [1,2]. Satellite image is defined as a picture of the earth taken from an earth orbital satellite. This image is a remotely sensed image. Remote sensing is a science of obtaining information about an object, area or phenomenon through the analysis of data acquired by a device that is not in contact with the object [1, 2]. Commonly remote sensing is referred to the collection and analysis of data regarding the earth using electromagnetic sensors, which are operated from the space borne platform. Satellite image classification includes two steps: a) Segmentation step b) Classification step
Mr. N. Z. Tarapore Asst. Prof. (Comp Dept. ) V.I.T. Pune
In this paper, the satellite image segmentation and classification is done using K-Means and Back Propagation Algorithms. 2.0 K – Means Algorithm This algorithm starts with some clusters of pixels in the feature space, each of them defined by its center. The first step consists in allocating each pixel to the nearest cluster. In the second step the new centers are computed with the new clusters. These two steps are repeated until convergence [9, 10]. The basic step of k-means clustering is simple. In the beginning determine number of clusters K and assume the centroid or center of these clusters. Take any random objects as the initial centroids or the first K objects in sequence can also serve as the initial centroids. The K means algorithm will do the three steps below until convergence. Iterate until stable (= no object move group) a) Determine the centroid coordinate. b) Determine the distance of each Object to the centroids. c) Group the object based on minimum distance. The experimentation was done on the images downloaded from ‘image processing.com’[14]. After implementation of K –means algorithm, the results of ‘segmentation and classification’ are stored [10] and then same images are given to the neural network classifier for further study. 2.1 Back propagation algorithm of ANN The back propagation algorithm is a generalization of the least mean square algorithm that modifies network weights to minimize the mean squared error between the desired and actual outputs of the network. Back propagation uses supervised learning in which the network is trained using data for which inputs as well as desired outputs are known. Once trained, the network weights are frozen and can be used to compute output values for new input samples. Back propagation Algorithm: Start with randomly chosen weights. While MSE is unsatisfactory and computational
bounds are not exceeded, do for each input pattern.
(net (p1,)j )
a) Compute hidden node inputs
b) Compute hidden node outputs
( x (p1,)j )
c) Compute inputs to the outputs nodes
( net (p2,k) ) d) Compute the network outputs e) Compute the error between output
(o p ,k )
o p , k and desired
d p,k
f) Modify the weights between hidden and output nodes:
wk( 2, ,j1) (d p,k op,k ) | (net(p2,k) ) x(p1,)j g) Modify the weights between input and hidden nodes:
w(j1,i,0) ((dp,k op,k)|(net(p2,k) )wk(2,,j1))|(net(p1,)j)xp,i k
End-for End-while The experimentation was done on the images downloaded from ‘image processing.com’[14]. One of the downloaded images is shown in Fig 1.
Fig. 2 RGB2YCBCR Conversion 3) Step 3: Above image is given as an input for both the classifiers i.e. K-Means classifiers and Neural Network Classifiers. Hereafter we have compared the results obtained from both the classifiers. 4) Step 4: Label every pixel in the image using the results from K-Means. For every object in our input, K-means returns an index corresponding to a cluster. Label every pixel in the image with its cluster-index. Output obtained under K-Means Classifier is shown in Fig.3
2.2 Color based segmentation and classification using above-mentioned algorithms. 1) Step 1: Read the original image and display it.
Fig.3 (a) Output from K-Means Classifier Fig. 1 Original image 2) Step 2: Convert image from RGB color space to YCBCR color space.
Fig. 6(a) Objects in cluster 3 by K-Means and ANN classifier 8) Step 8:Graphical user interface So as to make this project user friendly, graphical user interfaces are given.
Fig.3 (b) Output from ANN classifier. 5) Step 5:. Use above images to separate out three different color objects. [4, 5, 15]. Objects in cluster 1 .
Fig. 4(a) Objects in cluster 1 by K-Means and ANN classifier. 6) Step 6: Objects in Cluster 2
Fig. 5(a) objects in cluster 2 by K-Means and ANN classifier. 7) Step 7: Objects in Cluster 3
3.0 Conclusions and Future Scope K- Means algorithm and back propagation are studied in detail and implemented on various database for the segmentation and classification purpose. It is found that K- means algorithm gives very high accuracy, but it is useful for single database at a time. Whereas neural network is useful for multiple databases, once it is trained for it. Neural network also provides good accuracy. In future different neural network algorithms can be used to classify the satellite images and the classification results of those images will be compared with results of existing classification methods. REFERENCES [1] Flayed Sabine and W.H.Freeman, “Remote sensing, Principles and Interpretation”. [2] S.N. Sivanandam & Sumathi & S. N. Deepa, “Introduction to Neural Networks using Matlab 6.0”. [3] Milan Sonka, Vaclav Lavaca &Roger Bole, “Image Processing, analysis and Machine Vision”. [4]William Pratt, “Digital Image Processing”. [5] Rafael C. Gonzalez & Richard E.Woods, “Digital Image Processing”. [6] Rui Xu and Donald Wunsch, “Survey of Clustering Algorithms”, IEEE, Vol. 16, No.3, pp.645-678, May 2005.
[7]Y. Zhang, J. Weng & W.S. Hwang, “Biological Aspects of Neurocomputing. Auditory Learning: A Development method”, IEEE, Vol. 16, No.3 pp.601-616, May 2005. [8] G. Dong & M. Xie, “Color Clustering & Learning for Image Segmentation Based on Neural Networks”, IEEE, Vol. 16, No. 4, Pp.925- 936. [9] Xiao yang Tan, Song can Chen & Zhizhou,”Recognizing partially. Occluded Expression Variant Faces from Single Training Image per Person with SOM & soft K-NN Ensemble,” IEEE Trans. Pattern Anal. Vol.16, No. k4, pp.875-855, July 2005.
[10] P.D.Deshpande, “Survey of Satellite Image Segmentation and Classification”, NCETE2006, MAE, Alandi(D), Pune. [11] www.rst.gsfc.nasa.gov [12] www.remotesensing.org [13] www.rst.gfsc.nasa.gov/front [14] www.mathtools.com [15] www.imageprocessingplace .com [16] www.ccrs.nrcan.gc.ca/ccrs/learn/ tutorials/fundam/fundam-e.html [16] www.nrsa.gov.in [17] www.gisdevelopment.net