Scalable System-level Active Low-Power Mode with Bounded Latency Daniel Wong
Murali Annavaram
University of Southern California
University of Southern California
[email protected]
[email protected]
ABSTRACT
60% % Time at Utilization
Many system-level inactive low power modes exploit idle periods to obtain energy savings. With the emergence of multicore servers, idle periods are becoming increasingly rare. In order to save energy in multicore servers, low-utilization periods, which remains with increasing core count, must be exploited. Server-level heterogenous servers, such as KnightShift, have been shown to significantly improve the energy proportionality of datacenter servers through exploiting lowutilization periods. However, previous switching policies, which decides when to switch between a high-power highperformance node and a low-power lower-performance node, are simplistic and easily fooled by server utilization patterns, leading to false switches and thrashing causing unbounded latency impact.
10% 30%
40% 30% 20% 10% 0% 1
2
4 8 16 Number of Cores
32
64
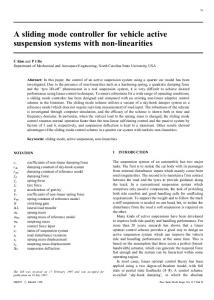
Figure 1: Percentage of time a web server operating at an average of 30% utilization spends at various utilization levels. While idle periods disappear with increasing core counts, low-utilization levels remain, offering opportunities for active low-power modes.
In this paper, we propose Hueristic-based Switching Policies (HSP), which uses utilization history to predict when future high utilization periods will occur. We show that HSP can significantly reduce thrashing and false switches, bounding latency while still maintaining significant energy savings. Furthermore, we show that active low-power modes that exploit low utilization periods are able to sustain energylatency tradeoffs as core count increases and offer superior energy savings compared to idleness scheduling algorithms.
the server is proportional to that of the utilization. It is not uncommon to see data center servers consume over 50% of the peak power at idle [21]. To fully exploit idle periods, prior work focused on fast transitions to exploit sub-second idleness [20], and extending time spent in idle states by offloading simple I/O requests to coprocessors [2, 12].
Categories and Subject Descriptors C.5.5 [Computer System Implementation]: Servers
The emergence of multicore servers present a new obstacle for system-level low-power modes due to scalability and latency constraints. As core count increases, naturally occurring idle periods become non-existent [22, 21]. This requires the need to artificially create idle periods by scheduling requests to coalesce idle and busy periods through idleness scheduling algorithms [22, 9]. Artificially creating idle periods by queueing requests naturally leads to an increase in latency.
General Terms Design, Measurement, Performance
Keywords power management, servers
1.
Idle 20%
50%
INTRODUCTION
Many modern data centers suffer from a lack of energy proportionality [4], that is, where the power consumption of
Figure 1 shows the percentage of time a web server, with an average utilization of 30%, spends at various utilizations levels for different core counts. Data from this figure was collected from the BigHouse datacenter simulator [23]. More details on the simulator will be discussed in section 5. The x-axis shows the number of cores while the y-axis shows the percentage of time the server spends at utilization levels up to the indicated utilization. For example, the 20% utilization curve shows the percentage of time a server spends at utilization less than 20%. Although idle periods disappear, low utilization periods remains. Thus, active low-power modes 1
100% Peak power
that exploit low-utilization periods could potentially provide energy savings that scale with core count. Prior work, such as KnightShift [27], a server-level heterogeneous active low-power mode that exploits low utilization periods, has been shown to save significant amounts of power. KnightShift saves power by offloading requests during low-utilization periods to a low-power low-performance compute node, called the Knight. KnightShift employs a simplistic switching policy to determine when to switch operating modes between the primary server and the Knight. Utilization patterns can easily trick the switching policy causing unbounded latency increase. Additionally, KnightShift was evaluated against an 8 core machine and scalability to increasing core counts was never explored. We believe that active low-power modes that exploit low-utilization periods, like KnightShift, offers the solution to scalable systemlevel low-power mode.
60% 40%
Actual
20%
Ideal KnightShift
0% 0%
20% 40% 60% 80% 100% Utilization
Figure 2: KnightShift enhanced energy proportionality curve. KnightShift enables server to run at greater efficiency at low utilization regions [27].
Our contributions in this paper are:
Techniques such as consolidation and dynamic cluster resizing [6, 7] increases average server utilization by concentrating workload to a group of servers and powering off the idle servers. This effectively improves the efficiency and lowers the total power usage of the cluster. Furthermore, power capping techniques [25, 19, 11] caps cluster power by throttling or disabling servers to prevent power usage over a set power provision limit. These techniques are not suitable for many of today’s emerging workloads [18], such as search, which cannot tolerate server shutoff. Furthermore, due to the temporal granularity of these techniques, they cannot respond rapidly to unanticipated load as it could take minutes to migrate tasks with very large working sets.
• Heuristic-based Switching Policies for KnightShift to bound latency impact. By exploiting day to day server utilization patterns, we are able to bound the tail latency of KnightShift to the tail latency of the Knight through reductions in thrashing and false switches. • Demonstrate scalability of system-level active low-power modes, such as KnightShift. We believe this is the first work to identify that system-level active low-power modes that exploits low utilization periods can provide sustained energy-latency tradeoffs independent of core count.
Many component-level energy saving techniques exists for CPU [14, 17], Memory [8], and Disks [5, 13]. Active lowpower modes improves the energy efficiency of components, such as DVFS and MemScale [8], which scales the frequency and power of CPUs and Memory, respectively. Heterogeneous cores, such as Tegra 3 and ARM big.LITTLE, can switch to low-power efficient cores during low-utilization periods. Inactive low-power techniques, such as DRAM selfrefresh, core parking and disk spin down, can improve the idle power consumption of these components. Going forward, no one component dominates overall power usage [26], limiting the potential of component-level low-power modes.
• Sensitivity analysis of KnightShift parameters and its effect on energy-latency tradeoffs. We show that even if the speed of the Knight is decreased in half, equivalent to reducing the capability of the Knight in half, KnightShift still provides energy-latency tradeoffs competitive with today’s state-of-the-art idleness scheduling algorithms. Also, we present sensitivity to workload utilization and Knight capacity. The paper is organized as follows: Section 2 provides a background of energy saving techniques in data centers and summarizes the KnightShift architecture. Section 3 analyzes real-world data center utilization traces and introduces Heuristic-based Switching Policies. Section 4 evaluates the performance and effect of HSPs on KnightShift. Section 5 demonstrates the scalability of KnightShift. We finally conclude in section 6.
2.
80%
System-level low-power modes places the entire system in a low power state. These techniques commonly reduce the idle power usage and extends the time a system stays in the low power state. PowerNap [20] exploits millisecond idle periods by rapidly transitioning to an inactive low-power state. Barely-alive servers [2] extends idle periods by keeping memory active to process remote I/O requests. Similarly, Somniloquy [1] extends idle periods by enabling support for certain application protocols, such as email and instant messaging.
BACKGROUND
In the last few years, power and energy related issues in large scale datacenters have become a growing concern for both government and commercial industries [16]. Barroso [4] showed that energy-proportionality is a major concern since most enterprise servers operate at low average utilizations. These concerns have become the source of much active research in the energy proportional computing space resulting in numerous studies that have examined energy efficiency approaches to servers in datacenter settings.
As the number of processors in servers increase, idle periods are becoming increasingly rare [22, 21]. Several work proposes idleness scheduling algorithms through batching. Elnozahy et al [9] propose batching requests with timeouts. DreamWeaver [22] extends PowerNap to queue requests, and preempt active tasks to artificially create and extend idle periods. 2
Server 0.30
Motherboard Primary Server
Memory
Memory
CPU
CPU
Chipset
Requests
0.25
0.20 Frequency
Knight
Chipset LAN
LAN
SATA
SATA
0.10
Sideband Ethernet
Disks
0.05
Fans
0.00
Power Supply
0
2
4
6 Response Time
8
10
12
Figure 4: This representative figure depicts a typical latency distribution of KnightShift. The bimodal distribution is due to the differing performance of the primary server and Knight.
Figure 3: The KnightShift server architecture.
Currently, system-level low-power techniques only exploit idle periods. In order to scale in the mutlicore era, systemlevel low-power techniques must target low-utilization periods. KnightShift [27] proposes to front a high-power server with a low-power server to dynamically switch between two efficiency modes of operations. Unfortunately, there are some shortcomings with the KnightShift architecture as we will further explore in the next section.
2.1
0.15
Request routing and coordination. KnightShift requires a mechanism to route requests to the primary server during high-utilization, and to the Knight during low-utilization. Routing is through a software proxy running on the Knight. Communication between primary server and Knight. To direct requests, the primary server and Knight communicates through LAN on Motherboard. Through sideband ethernet, no additional ethernet ports are exposed externally. Each node gets its own IP address over the same physical port, with only the Knight’s IP address publicly visible to external servers. From the outside world, the KnightShift system appears as a single server with a single IP address.
KnightShift Overview
Figure 3 shows the architecture of a tightly integrated KnightShift system that integrates the primary server and Knight onto the same motherboard. KnightShift [27] fronts a highpower primary server with a low-power compute node, called the Knight. During low utilization periods, KnightShift will direct all requests to the Knight, allowing the primary server to enter an idle power state, such as shutdown, sleep, or hibernate.
Coordination and Utilization Monitor: In KnightShift the sleep/wakeup process is determined by system utilization. Coordination between Knight and primary server is carried out by a daemon, KnightShiftd. KnightShiftd monitors the utilization of the node it’s running on and makes mode switching decisions on whether to switch to the complementary node.
A KnightShift system has the following requirements: Independent power states. The primary server should be able to completely shut down independently of the Knight. Here, the motherboard is separated into two power domains designated by the dotted box. The Knight and disks are always on.
2.1.1
Effect on Energy Proportionality and Latency
We define Knight capability as the fraction of throughput that the Knight can provide compared to the primary server. The primary server is shut down at low utilizations, allowing the Knight to handle all low utilization requests, significantly decreasing power consumption. Figure 2 shows the effect of KnightShift on the utilization-power curve with a 50% capable Knight. The x-axis shows the utilization of the server while the y-axis shows the percentage of peak power usage. The dotted line shows the utilization-power curve of an ideal energy proportional server. By allowing servers to operate at lower power during low utilization, KnightShift is able to greatly improve the energy proportionality of servers. For certain utilization regions, a KnightShift system can operate at efficiency even greater than that of an ideal energy proportional system.
Independent memory and processor. The Knight replicates almost every single component of the primary server using low-power and typically low performance parts. The Knight can be based on desktop, mobile or embedded components, such as ARM, Intel Atom, or Core i3 platforms. Disk Data sharing. Disk data sharing enables fast switching between the Knight and primary server without the overheads experienced in server consolidation. Each compute node has its own OS disk so that they can run applications independently. Sharing primarily refers to the data partition where data is shared. Data sharing is enabled through a SATA switch. Before switching, KnightShift flush memory to disk and unmount the disk. 3
Server aludra email girtab msg-mmp msg-mx msg-store nunki scf
1.0
Percentage
0.8
0.6
Type stu. timeshare email store stu. timeshare email services email services email store stu. timeshare file server
Utilization x ¯ σ 3.87 3.12 3.26 1.74 0.83 2.42 32.62 13.60 19.23 7.41 11.05 5.88 4.86 10.85 5.47 4.19
∆ Utililization x ¯ σ 0.59 0.84 0.78 1.20 0.73 1.94 2.64 2.76 1.69 2.30 2.39 2.72 1.98 4.50 1.15 1.65
0.4
0.0
Table 1: Datacenter trace workload types
100 80 60 40 20
0.2
0
20
40
60
80
60
CPU DISK
50
100
Figure 5: CDF of length of high utilization periods for nunki. Bursts are short lived and often spikes to very high utilization.
Disk Utilization (blks/s)
%CPU Utilization
Seconds
40 30 20 10
The tail latency of a KnightShift system is determined by the tail latency of the Knight. Intuitively, the Knight has a lower single-thread performance compared to the primary server, thus the tail latency (ex. 95th percentile latency), is solely determined by that of the Knight. Thus, a trade-off between latency and power can be made by the choice of the Knight. Latency follows a bimodal distribution rather than a normal distribution as shown in Figure 4. Thus, any latency results greater than the latency of the Knight is considered a penalty caused by KnightShift, with the rest attributed to the Knight.
2.1.2
0 0
2000
4000
6000 8000 Time (in Minutes)
10000
12000
Figure 6: Msg-mx server utilization over 9 day period. Utilization is very noisy and jumps between low and high utilization periods quickly, causing thrashing. Also, day to day utilization patterns are similar.
3.
HEURISTICS-BASED SWITCHING POLICIES
Although many false switches occur, it is possible to eliminate a majority of false switches through predicating when high utilization periods occur. Day to day server utilization patterns matches closely, thus it is possible to use simple heuristics to predict high utilization periods. High utilization is defined as a utilization greater than the Knight’s capacity. Low utilization is defined as a utilization less than the Knight’s capacity. Unless otherwise noted, we use a 15% capable Knight. In this section, we will analyze real world data center traces and introduce a simple heuristicbased switching policy to reduce false switches and achieve a KnightShift latency bounded by the Knight’s latency. The performance of the switching policy will be explored in section 4. We will show that we can bound the latency by the Knight and still experience significant power savings.
Mode Switching Policy.
The baseline mode switching policy used in [27] uses a simple aggressive policy. The aggressive policy switches at the first opportunity. For example, a switch to the Knight occurs the instant whenever the primary server’s utilization falls below a certain threshold. Due to its aggressive switching behavior, this can lead to thrashing when utilization is jumping around the Knight’s capability level. This trashing leads to energy penalties due to power spikes during transition periods when the primary server is waking up. Furthermore, the aggressive policy can lead to high latency impact due to false switches, that is, when a server is operating in a high utilization period, but a few dips into the low utilization period tricks the switching policy into believing a low utilization period started. In this case, the Knight will receive requests that it is not capable of handling, while the primary server is transitioning to a low power mode. During this period, the latency of each request increases due to the Knight not being able to keep up with the requests, resulting in high queueing time. The aggressive switching policy is easily tricked by utilization pattern and remains one of the main barriers to a practical KnightShift system. In the next section, we will propose Heuristic-based Switching Policies for KnightShift to reduce the occurrence of thrashing and false switches, effectively bounding the tail latency of KnightShift to the tail latency of the Knight.
3.1
Server Workload Analysis
Minute-granularity utilization traces were collected from institutionwide production datacenter over 9 days. The datacenter serves multiple tasks, such as e-mail, learning management system (e.g. Blackboard), distance education facilities (video and live streaming support of course lectures), compute intensive application hosting such as CAD tools, and student timeshare servers. Each task is assigned to a dedicated cluster, with the data spread across multiple servers. Selected servers within a cluster exhibit a behavior representative of each of the server within that cluster. Table 1 shows the details of each server workload along 4
with its corresponding utilization and burstiness characteristics. The datacenter serves multiple tasks, such as e-mail store(email, msg-store1), e-mail services (msg-mmp, msgmx), file server (scf), and student timeshare servers (aludra, nunki, girtab). Some of the servers (aludra, nunki, scf, girtab, email) run at less than 20% CPU utilization for nearly 90% of their total operational time. In general, these traces confirm that CPU utilization reaches neither 100% nor 0% for extended periods of time, reaffirming prior studies [4, 10, 24]. The burstiness of the workload is characterized by σutilization , the standard deviation of the workload’s utilization, and ∆utilization, the change in utilization from sample to sample. σutilization tells us how varied the utilization of the server is, while the ∆utilization tells us how drastic the utilization changes from sample to sample. For example, nunki has a wide operating utilization range with large variation in utilization from sample to sample. Figure 5 shows the CDF of the length of high utilization periods and the utilization levels of the burst. We see that most high utilization bursts last less than a minute and spikes over 80%. Bursty workloads, like nunki, are a significant challenge to KnightShift as the Knight does not have sufficient capacity to handle bursts, especially very high utilization bursts.
100
CPU Utilization
80
40
20
0 0
200
400
600
800 Time
1000
1200
1400
(a) Utilization history is recorded and bursts (the grey regions) are identified.
100
Figure 6 shows the utilization trace of msg-mx over a 9 day period. The x-axis represents the time in minute and the y-axis represents the CPU and Disk utilization. Msg-mx jumps between high and low utilization periods quickly causing thrashing. The switching policy gets easily tricked and switches to the Knight when it encounters a low utilization. But the low utilization period is short lived and instantly switches back to the primary server. In the face of these bursts, KnightShift will incur latency penalties while waiting for the transition to the primary server.
CPU Utilization
80
60
40
20
In order to tolerate these bursts, rather than aggressively and reactively transitioning to the primary server, KnightShift should proactively transition to anticipate these bursts. In order to anticipate bursts, we must be able to predict future server utilization. Specifically, we only need to know whether the server’s utilization with be high or low.
0 0
200
400
600
800 Time
1000
1200
1400
(b) Bursts are expanded. Close bursts are merged in single larger burst.
Note that the day to day utilization pattern of the server in figure 6 are similar, as characterized by high utilization spikes near the beginning of each day. This shows us that the previous day’s utilization pattern could provide a good heuristics for the present day’s utilization pattern.
100
80
CPU Utilization
3.2
60
Day to Day HSP
In this section we introduce the Day to Day (D2D) Heuristicbased Switching Policy for KnightShift. This switching policy is based on the strong correlation of server utilization from day to day as shown in Figure 6. We will show that by simply using the previous day’s utilization history to predict current day’s low/high utilization periods, we can effectively reduce the occurrence of thrashing and false switches with very low overhead.
60
40
20
0 0
To help facilitate the description of the Day to Day switching policy, figure 7 illustrates the Day to Day HSP applied at a second granularity over a 30-minute section of time. We provide a ”zoomed in” view to clearly show the details of the algorithm and variations in CPU utilization. The CPU
200
400
600
800 Time
1000
1200
1400
(c) Burst predictions are applied to current utilization. Here, a majority of current days bursts are anticipated. Figure 7: Day to Day HSP
5
utilization over time is plotted, with the horizontal dashed line indicating the Knight’s capability at 15% utilization.
value requirement that allows us to use simple utilization history as a heuristic. In the next section, we will evaluate and present the accuracy and performance of the Day to Day HSP.
The steps required for the Day to Day HSP are as follows:
4. SWITCHING POLICY EVALUATION 4.1 Methodology
1. Record utilization pattern: In order to use utilization as a heuristic, we require a 1 day history of the utilization pattern. Utilization can be trivially logged through software. Depending on the need, utilization can be recorded at second, or minute granularity. Even with second granularity, this history log only takes up ˜ 85kB. The previous day’s utilization is shown in figure 7(a) and (b).
To simulate KnightShift and evaluate our Heuristic-based Switching Policies, we use KnightSim [27], a trace-driven simulator modeled and validated against a KnightShift prototype. The prototype consists of a primary server and Knight loosely-coupled as a private cluster. The primary server is a Supermicro server with dual 4-core Intel Xeon L5630 processor, 36GB of ram, and 500GB hard drive. At idle, the server uses 156W and 205W at full load. The Knight is a Shuttle XS35 nettop, with an Intel Atom D525, 1GB of ram, and 500GB hard drive. The Knight uses 15W at idle and 16.7W at full load. Through empirical measurements, it was determined that the Knight is 15% capable. Transition time between the Knight and Primary server is 20 seconds.
2. Identify Bursts: A burst is defined as a high utilization period. Identifying bursts simply requires iterating through the utilization history and flagging each interval that is a burst. Each flag requires only 1 bit, and a total of 11kB are used to hold the burst flags. In figure 7(a) the identified bursts are designated by the gray regions and only occurs when the overlaid utilization has a high utilization. 3. Expand Bursts: In order for KnightShift to be in the primary server mode when the burst is predicted to occur, we expand the boundaries of the predicted bursts by the transition time. The level of expansion, called the expansion factor, is configurable. Larger expansions are more conservative, forcing KnightShift to spend less time in the Knight and more time in the primary server. This improves latency, but lowers energy savings as it misses opportunities for energy savings. Figure 7(b) shows the expanded bursts. Note that bursts that occur close to one another are merged, effectively filters thrashing.
During simulation runs, KnightSim replays utilization traces on a modeled KnightShift system. KnightShift is modeled as a G/G/k queue, where the arrival rate is time-varying based on the utilization trace, the service rate is exponential with a mean of 1 second, and varying k servers modeling the capacity of the Knight and primary server.
Identifying and expanding bursts can be executed online on the server and simply involves reading the logs and determining the high utilization periods. In our experiments, it takes less than a second to identify burst regions for the entire day.
Modeling Power: The power model is based on the prototype system validated in [27]. When the primary server is active, both the primary server and Knight is on, as the Knight is always kept on. Hence, when the primary server is active, the power used by KnightShift is equal to the power of the primary server and the Knight. When the Knight is active, the only power consumed is from the Knight. Since the data partition is shared in KnightShift, the primary server can be shutdown without causing data to become unavailable. To capture transition penalties in the model, a constant power was conservatively added to the system power during the entire transition period.
Modeling Knight capability: Knight capability is modeled by varying the system capacity, k. For example, a 15% Knight would have k = 15 in the G/G/k queueing model when operating in Knight mode. When the primary server becomes active then k = 100.
4. Apply predicted bursts: During the current day’s utilization, if the server encounters a predicted burst, KnightShift will force a transition to the primary server. As long as KnightShift is operating in a predicted burst region, the primary server will be active. Figure 7(c) shows the utilization of the current day overlaid on the predicted bursts represented as the gray region. In this scenario, the Day to Day HSP was able to anticipate a majority of the bursts.
To faithfully scale the power of the Knight as its capability changes, the model assume that the power consumption of the CPU scales quadratically with performance. The quadratic assumption is based on historical data [3] which showed that power consumption increased in proportions to perf ormance1.7 .
While this switching policy can be applied at the minute granularity, in this paper we conservatively assume second granularity is used. Minute granularity predictions would have a greater probability of observing a predicted high utilization bursts compared to second granularity predictions due to a wider prediction window (the grey regions in figure 7). Thus, we evaluate using worst-case assumptions to present conservative evaluations by using second-granularity predictions. While it is highly unlikely that server utilization match exactly from the day before, we require only ballpark values to estimate whether a high or low utilization period exists at a certain time. It is because of this loose prediction
Arrival Rate and Latency Estimation: Utilization traces only contain CPU and I/O utilization per second without individual request information. By assuming a mean service time of 1 second for each request, a time-varying arrival rate can be estimated through the utilization trace. For example, 50% utilization would correspond to an arrival rate of 50 request per second. KnightSim is able to generate relative average latency and 95th percentile latency 6
Response Time Average 95th Prototype Baseline KnightShift Impact KnightSim Baseline KnightShift Impact Error
Energy Consumption(KWH)
144ms 150ms -4%
249ms 296ms -19%
23.27 15.35 34%
1.00 1.12 -12% 8%
1.66 2.00 -21% 2%
23.27 15.11 35% 1%
For the majority of the workloads, the number of switches decreased dramatically, with an average of at least a ˜ 10x reduction. The workloads that experience the most improvements are workloads that have moderate utilization which jumps between low and high utilization periods quickly. In some cases, such as msg-mmp, the number of switches decreased to 0 for D2D-2 and D2D-3 due to the close proximity of bursts being merging together during the burst expansion phase. In this case, msg-mmp never switches to the Knight, as the switching policy recognized that this workload does not benefit from a KnightShift system.
Table 2: Energy consumption and response time of a Wikipedia-based web server benchmark comparing results between the KnightShift prototype and KnightSim. [27]
As the expansion factor increases, the occurrence of predicted bursts merging increases, resulting in a smaller number of predicted bursts with larger prediction windows. This is evident in the decreasing occurrence of switches as the expansion factor increases.
of a KnightShift system compared to the baseline primary server.
Effect on false switches: Figure 9 shows the effect of D2D on the number of false switches. Day to Day switching policy was successful in decreasing the number of false switches significantly compared to the baseline aggressive switching policy. False switches normally occur during regions of operation where the utilization hovers around the Knight’s capability level. By predicting high utilization periods and preventing KnightShift from switching to the Knight during these periods, Day to Day switching policy reduces the number of false switches by an average of over 5x reduction. In certain workloads, such as email and girtab, the occurrence of false switches disappeared completely. For most workloads, the number of false switches were confined to less than one per day.
Modeling Single-threaded Performance: Single-threaded performance cannot be inferred directly from processor frequency because single-threaded performance is based on frequency and the underlying architecture. Instead, the service time is scaled by the ratio of the 95th percentile latency of the Knight and primary server. For example, the primary server has tail latency of 249ms while the Atom-based server has tail latency of 323ms while running a wikipedia clone [27]. In the model, the service time while in Knight mode is increased by a factor of 1.30 compared to baseline. Simulator Validation: Power and latency results for KnightSim were validated against the KnightShift prototype. Table 2 shows the results of the validation run between KnightSim and the KnightShift prototype while running a wikipediabased web server benchmark. The 95th percentile latency and energy consumption improvement results from KnightSim are all within 2% of the prototype system.
4.2
Prediction Accuracy: Figure 10 shows the accuracy of predicted bursts for various workloads. Because Day to Day policy uses utilization history from the past day, the policy is most effective at handling periodic bursts. This is clearly evident in workloads, such as aludra and girtab, where a majority of bursts are random and not periodic. This is due to the purpose of these servers. Both aludra and girtab are student timeshare servers, running heterogeneous tasks for a large population of students. For the rest of the workloads, many achieve accuracy above 80%. As the expansion factor increases, we increase the chance that a predicted burst may ”catch” a bursts, thus increasing accuracy.
Heuristic Results
In this section we evaluate our Day to Day HSP’s effectiveness in reducing false switches and thrashing, as wells as the accuracy of the heuristic-based predictions. In addition, we explore the impact to latency and energy savings. We explored three Day to Day (D2D) switching policies, each with different expansion factors (1,2,3). Recall that an expansion factor is the extent to which the boundaries of the predicted bursts were expanded. Here, the expansion factor is a multiple of the transition time. For example, D2D-2 represents a Day to Day HSP where the boundaries of the predicted bursts are expanded by 2x the transition time.
Effect on Latency: Figure 11 shows the 95th percentile latency of D2D switching policies normalized to the 95th percentile latency of the primary server. The 95th percentile latency of the Knight is also provided for reference. Any latency greater than that of the Knight is considered to be attributed to KnightShift. For all workloads, D2D provided better latency than the baseline aggressive policy. In addition, D2D provided latency less than that of the Knight, with the exception of nunki. Nunki still suffers a latency impact due to the presence of switches and false switches. Although the number of switches and false switches are significantly lower, bursts in nunki can spike as high as over 80%, thus every false switch can incur major latency penalty. Nevertheless, in the general case, Day to Day HSP can effectively bound the 95th percentile latency to that of the Knight.
Effect on thrashing: Figure 8 shows the effect of the Day to Day switching policy on the number of switches for various server workloads. The left-most bars (Aggressive) represents the original switching policy in [27]. Low utilization workloads tend to experience fewer benefits from D2D, but still experience improvements to latency as we will see later in this section. Only email experienced increased switches, because bursts in email tend to not be periodic, thus D2D would cause unnecessary switches. 7
Number of Switches
150 125 100 75
826
Aggressive
1012
1282
200
370
479.5
D2D-1 D2D-2 D2D-3
50 25 0 aludra
email
girtab
msg-mmp msg-mx msg-store
nunki
scf
avg
Figure 8: D2D policies effectively reduce the number of switches by at least 10x on average, decreasing the occurrence of thrashing between the Knight and primary server.
Number of False Switches
25
54
Aggressive 20
86
89
32.625
D2D-1 D2D-2
15
D2D-3
10 5 0 aludra
email
girtab
msg-mmp
msg-mx
msg-store
nunki
scf
avg
Figure 9: D2D policies significantly decreased the occurrence of false switches by at least 5x on average. In many cases, less than 1 false switch occurs per day.
100% Accuracy of Predicted Bursts
D2D-1 80%
D2D-2 D2D-3
60% 40% 20% 0% aludra
email
girtab
msg-mmp msg-mx msg-store
nunki
scf
avg
Figure 10: D2D can predict bursts with a relatively high rate of accuracy. Several workloads lack periodic spikes, therefore resulting in low accuracy.
8
Utilization Max Idle
CPU 40% 15%
Memory 35% 25%
Disk 10% 9%
Other 15% 10%
odic bursts does not exist, and Day to Day switching policies would not provide any benefits. In this section, we present results with the Aggressive switching policy. KnightShift was designed for time-varying arrival rates and would not fare well under synthetic arrival traces generated from empirical interarrival distributions as the low-utilization intervals are too small for KnightShift to be effective. To compensate for this, in this section, we assume that the primary server is PowerNap-enhanced, allowing for fast transition time between the Knight and primary server. Furthermore, a PowerNap-enhanced KnightShift would not incur false switches as transitions are sufficiently fast to exploit low/high utilization periods of ant lengths. Similarly, thrashing would not be an issue for a PowerNap-enhanced KnightShift server.
Table 3: BigHouse server power model assumptions based on data from HP [26] and Google [15]. Power is presented as percentage of peak power.
Effect on Energy: Figure 12 shows the energy consumption of D2D switching policies normalized to the energy consumption of the baseline primary server. While D2D decreases energy savings, the effect is relatively small, still allowing up to 49.9% energy savings on average compared to 55.1% for the baseline. As the expansion factor increases, KnightShift conservatively spend more time in the primary server, loosing energy savings opportunity, as reflected in the figure.
5.2
As shown, D2D HSP effectively decreases thrashing and false switches, while maintaining a high level of accuracy despite using a very simple heuristic. The latency of D2D essentially bounds the latency to that of the Knight, with minimal negative energy impact.
5.
SCALABILITY
To this extent, we extended KnightShift to adjust the powerlatency tradeoffs. In all previously mentioned switching policies, a switch occurs at the first instance of a triggering event (a low or high utilization). To tradeoff power and latency, we adjust the threshold on when to switch. For example, to allow increased latency for higher energy savings, we increase the threshold to switch out of the Knight by switching only after a period of n consecutive high utilization readings. This attempts to keep the Knight active as long as possible. Similarly, to decrease latency at the cost of energy savings, we increase the threshold to switch into the Knight. In section 4, we also evaluated the effect of these tradeoffs on bounding latency, but D2D offers superior energy-latency tradeoffs, and thus, we omit these results for brevity.
Having just shown that the latency impact of KnightShift can be bounded to the latency of the Knight, we now evaluate the effectiveness of KnightShift at scale. In Section 4, all results are for an 8-core system. In this section, we will explore the results for a 32-core system and compare it to stateof-the-art idleness scheduling algorithms (DreamWeaver [22] and Batch [9]). We will show that KnightShift can offer similar energy savings at high core count as other idleness scheduling algorithms but with significantly less latency slack required. Furthermore, we show that KnightShift offers superior energy savings at any given latency slack. The scalability of KnightShift lies in the fact that it exploits low utilization periods, instead of idle periods.
5.1
Energy-Latency Tradeoffs
All low-power modes will incur latency impact to some extent. For workloads with the tightest latency constraints, the best design may be to not use any power management. What we explore here are for workloads that allow some level of latency slack. In this section, rather than minimizing latency with maximum energy savings, we explore the best energy saving technique for any given latency slack.
Methodology
We evaluate four workload distributions, DNS, Mail, Apache, and Shell, collected from departmental servers provided with the BigHouse simulator. The workload’s load is scaled so that the server operates at 30% average utilization.
To evaluate the scalability of KnightShift, we use the BigHouse simulator [23], a simulation infrastructure for data center systems. BigHouse is based on stochastic queueing simulation [23], a validated methodology for simulating the power-performance behavior of data center workloads. Synthetic arrival/service traces are generated through empirical interarrival and service distributions collected from real systems. These synthetic arrival/service traces are fed into a discrete-event simulation of a G/G/k queueing system that models active and idle low-power modes through state-dependent service rates. Output measurements (99th percentile latency, and energy savings) are obtained by sampling the output of the simulation until each reaches a normalized half-width 95% confidence interval of 5%. The server power model, shown in table 3, is based on component power breakdowns from HP [26] and Google [15]
5.3
32-core Server
We evaluate a 30% capable KnightShift against Batching [9] and DreamWeaver [22], as well as PowerNap [20]. Figure 13 shows the latency vs energy savings curve of the four workloads. For convenience, the energy-latency tradeoff point of KnightShift at the Knight’s tail latency (1.3x) is marked. Batching provides a nearly linear tradeoff between latency and energy, but is consistently outperformed by DreamWeaver, confirming previous results in [23]. At the Knight’s latency, KnightShift is able to achieve energy savings similar to DreamWeaver, but the significantly less latency slack required. For Mail workload, KnightShift provides similar energy savings with less than half the latency slack required. For DNS, KnightShift provides similar energy savings with 25% less slack required. For Apache and Shell, DreamWeaver could not match the energy savings of KnightShift at 1.3x latency, even with a latency slack of over
We implemented the KnightShift server, based on the KnightShift prototype and models presented in section 4, in BigHouse with an aggressive switching policy. Recall, that in BigHouse, arrival traces are synthetically generated from empirical interarrival distributions. Thus, in BigHouse, peri9
Normalized 95% Latency
2.5
Aggressive D2D-2 Knight
2
3.4
D2D-1 D2D-3
70.0
2.8
1.5 1 0.5 0 aludra
email
girtab
msg-mmp msg-mx msg-store
nunki
scf
Figure 11: By reducing thrashing and false switches, the latency of D2D for all workloads, except for nunki, are less than that of the latency of the Knight. Nunki still suffers from significant thrashing due to non-periodic spikes.
Normalized Energy Consumption
1.2 Aggressive
1
D2D-1
0.8
D2D-2 D2D-3
0.6 0.4 0.2 0
aludra
email
girtab
msg-mmp msg-mx msg-store
nunki
scf
Figure 12: Although energy consumption increases for D2D compared to Aggressive policy, a significant amount of energy (49.9%) can still be saved.
1
1 KnightShift Batch
KnightShift Batch
0.8 Energy Savings
Energy Savings
0.8
DreamWeaver PowerNap
0.6 0.4 0.2
DreamWeaver PowerNap
0.6 0.4 0.2
0
0 1
1.5
2 2.5 Normalize 99% Latency
3
1
1.5
2 2.5 Normalize 99% Latency
(a) Apache 1
KnightShift Batch
(b) DNS 1
DreamWeaver PowerNap
KnightShift Batch
0.8 Energy Savings
Energy Savings
0.8
3
0.6 0.4 0.2
DreamWeaver PowerNap
0.6 0.4 0.2
0
0 1
1.5
2 2.5 Normalize 99% Latency
3
1
(c) Mail
1.5
2 2.5 Normalize 99% Latency
3
(d) Shell
Figure 13: KnightShift provides similar energy savings to idleness scheduling algorithms but with less latency slack required.
10
100%
1
Apache DNS Shell 60%
Apache-32 DNS-32 Shell-32 Mail-32
0.8 Energy Savings
Energy Savings
80%
Mail
40% 20%
0.6
Apache-4 DNS-4 Shell-4 Mail-4
0.4 0.2
0%
0
4
32 64 Number of Cores
1
128
(a) Energy savings at various core counts
1.5
2 2.5 Normalize 99% Latency
3
(b) Latency-Energy tradeoff curve at 4 and 32 cores
Figure 14: KnightShift scales well with increasing core counts. The energy savings and latency-energy tradeoffs remain practically the same at increasing core counts.
100%
3x allowed. In all cases, KnightShift outperforms all other techniques at every latency slack.
Apache DNS
Energy Savings
80%
For workloads that can tolerate latency slack of 3x or more, it may be possible to also consider the use of wimpy cluster, which can allow power savings greater than that shown here. In regions of latency slack that is not tolerable of wimpy nodes, then KnightShift offers almost all of the power savings up front, with a tighter latency slack. The maximum savings of KnightShift saturates at ˜ 1.5x latency slack in most cases.This contrasts to idleness scheduling algorithms, which ramps up energy savings as latency slack increases. For workloads which requires latency slack even tighter than what KnightShift can provide, system-level low-power modes may not be the best solution and energy saving techniques may even be disregarded all together.
5.4
Mail
40% 20% 0% 10%
30% Server Utilization
50%
Figure 15: KnightShift sensitivity to server utilization for a 30% capable Knight.
Sensitivity to Core Count
dle any requests. In this case, KnightShift would not result in any savings and it is advisable to use a higher capacity Knight.
Figure 14(a) shows the effect of increasing core count on KnightShift. As core count increases, the energy savings of KnightShift is not affected. Figure 14(b) shows the powerlatency tradeoff curves of various workloads running on 4 and 32 core machines. Clearly, the power-latency tradeoff curves remains consistent even as core count increases.
These results can also be translated to Knight capability sensitivity. While holding workload utilization constant, as the Knight’s capability increases, so does energy savings as the system spends more time in the Knight. As Knight capability decreases, then energy savings will also decreases as the system spends less time in the Knight due to less opportunities for the Knight.
This is in contrast to idleness scheduling algorithms which becomes less effective as core count increases. The reason that idleness scheduling algorithms becomes decreasingly effective is that the algorithms are still dependent on the presence of idle periods. This shows that KnightShift is not dependent on core count, but rather on the presence of low utilization periods, which was previously shown to remain present at high core counts. Therefore, theoretically as long as a Knight exist with sufficient capability, KnightShift can scale to any number of cores.
5.5
Shell 60%
5.6
Sensitivity to Knight Speed
Figure 16 shows the effect of slowing down the Knight by 2x. The baseline Knight in this case is already 1.3x slower than the primary server. As the Knight’s speed slows down, the latency of requests in the Knight increases due to increase in processing time and queueing time. Note that this effectively also decreases the capability of the Knight in half. If the Knight is slowed down by 2x, the amount of requests it can handle is also decreased by 2x, effectively making this Knight 15% capable. Even with a 2x slower Knight, the powerlatency tradeoff is still competitive with DreamWeaver and Batching.
Sensitivity to Utilization and Knight Capacity
Figure 15 shows KnightShift’s sensitivity to workload utilization for a 30% capable Knight. Any utilization less than 30% would results in improved energy savings due to more time being spent in regions where the Knight is capable of handling requests. As utilization increases, the opportunity for the Knight decreases, until the Knight can no longer han-
6. 11
CONCLUSION
1
www shell www-slow shell-slow
Energy Savings
0.8 0.6
[1] Y. Agarwal, S. Hodges, R. Chandra, J. Scott, P. Bahl, and R. Gupta. Somniloquy: augmenting network interfaces to reduce pc energy usage. In NSDI’09, 2009. [2] V. Anagnostopoulou, S. Biswas, A. Savage, R. Bianchini, T. Yang, and F. Chong. Energy conservation in datacenters through cluster memory management and barely-alive memory servers. In WEED ’09, 2009. [3] M. Annavaram, E. Grochowski, and J. Shen. Mitigating amdahl’s law through epi throttling. SIGARCH Comput. Archit. News, 33(2), May 2005. [4] L. A. Barroso and U. Holzle. The case for energy-proportional computing. Computer, 40(12), dec 2007. [5] E. V. Carrera, E. Pinheiro, and R. Bianchini. Conserving disk energy in network servers. In Proceedings of the 17th annual international conference on Supercomputing, ICS ’03, pages 86–97, New York, NY, USA, 2003. ACM. [6] J. S. Chase, D. C. Anderson, P. N. Thakar, A. M. Vahdat, and R. P. Doyle. Managing energy and server resources in hosting centers. SIGOPS Oper. Syst. Rev., 35(5), Oct. 2001. [7] G. Chen, W. He, J. Liu, S. Nath, L. Rigas, L. Xiao, and F. Zhao. Energy-aware server provisioning and load dispatching for connection-intensive internet services. In NSDI’08, 2008. [8] Q. Deng, D. Meisner, L. Ramos, T. F. Wenisch, and R. Bianchini. Memscale: active low-power modes for main memory. In ASPLOS ’11, 2011. [9] M. Elnozahy, M. Kistler, and R. Rajamony. Energy conservation policies for web servers. In Proceedings of the 4th conference on USENIX Symposium on Internet Technologies and Systems - Volume 4, USITS’03, pages 8–8, Berkeley, CA, USA, 2003. USENIX Association. [10] X. Fan, W.-D. Weber, and L. A. Barroso. Power provisioning for a warehouse-sized computer. In ISCA ’07, 2007. [11] A. Gandhi, M. Harchol-Balter, R. Das, J. Kephart, and C. Lefurgy. Power capping via forced idleness. In WEED ’09, 2009. [12] S. Ghosh, M. Redekopp, and M. Annavaram. Knightshift: shifting the i/o burden in datacenters to management processor for energy efficiency. In WEED’10, 2010. [13] S. Gurumurthi, A. Sivasubramaniam, M. Kandemir, and H. Franke. Drpm: dynamic speed control for power management in server class disks. In Proceedings of the 30th annual international symposium on Computer architecture, ISCA ’03, pages 169–181, New York, NY, USA, 2003. ACM. [14] S. Herbert and D. Marculescu. Analysis of dynamic voltage/frequency scaling in chip-multiprocessors. In Proceedings of the 2007 international symposium on Low power electronics and design, ISLPED ’07, pages 38–43, New York, NY, USA, 2007. ACM. [15] U. Hoelzle and L. A. Barroso. The Datacenter as a Computer: An Introduction to the Design of Warehouse-Scale Machines. Morgan and Claypool Publishers, 1st edition, 2009.
csedns newman csedns-slow newman-slow
0.4 0.2 0 1
1.5
2 2.5 Normalize 99% Latency
3
Figure 16: Energy-latency tradeoff curve for a Knight with 2x slowdown on a 32-core system. Note that slowing down the Knight also effectively lowers the capability of the Knight. With the emergence of multicore servers, system-level lowpower mode techniques are facing two challenges: lack of natural idle periods, and latency constraints. Current state of the art idleness scheduling algorithms artificially create idle periods through queueing of incoming requests, which naturally increases latency. While idle periods disappear at high core counts, low utilization periods remain. Systemlevel active low-power modes that exploit low utilization periods, such as KnightShift, can offer a solution to these issues, but can potentially faces unbounded latency impacts due to thrashing and false switches. We first present a heuristic-based switching policy and showed that by simply using the previous day’s server utilization, we can accurately predict future high/low utilization periods. By proactively anticipating high utilization periods, we reduce the occurrence of thrashing and false switches, bounding the latency impact of KnightShift to the tail latency of the Knight. Furthermore, we showed that KnightShift scales well at high core counts and can offer similar energy savings to state of the art idleness scheduling algorithms with significantly less latency slack required. Since KnightShift depends on the presence of low utilization periods, KnightShift offers superior scalability compared to idleness scheduling algorithms, who’s performance is tied to the presence of idle periods. Theoretically, as long as a Knight exist with sufficient capability, KnightShift can scale to any number of cores. We believe this is the first work to identify that system-level active low-power modes that exploits low utilization periods can provide sustained energy-latency tradeoffs independent of core count. This paper demonstrates the potential of system-level active low-power modes in emerging multicore environments. Most system-level low-power modes are inactive power modes, which exploits idle periods. In order to continue experiencing energy savings in the multicore era, research efforts should switch to the development of system-level active lowpower modes. We hope this work can be used to motivate future work in system-level active low-power modes.
7.
REFERENCES 12
[16] http://www.energystar.gov/. Report to congress on server and data center energy efficiency. [17] C. Isci, A. Buyuktosunoglu, C.-Y. Cher, P. Bose, and M. Martonosi. An analysis of efficient multi-core global power management policies: Maximizing performance for a given power budget. In Proceedings of the 39th Annual IEEE/ACM International Symposium on Microarchitecture, MICRO 39, pages 347–358, Washington, DC, USA, 2006. IEEE Computer Society. [18] V. Janapa Reddi, B. C. Lee, T. Chilimbi, and K. Vaid. Web search using mobile cores: quantifying and mitigating the price of efficiency. SIGARCH Comput. Archit. News, 38(3), June 2010. [19] C. Lefurgy, X. Wang, and M. Ware. Power capping: a prelude to power shifting. Cluster Computing, 11(2):183–195, June 2008. [20] D. Meisner, B. T. Gold, and T. F. Wenisch. Powernap: eliminating server idle power. In ASPLOS ’09. ACM, 2009. [21] D. Meisner, C. M. Sadler, L. A. Barroso, W.-D. Weber, and T. F. Wenisch. Power management of online data-intensive services. In ISCA ’11. ACM, 2011. [22] D. Meisner and T. F. Wenisch. Dreamweaver: architectural support for deep sleep. In ASPLOS ’12. ACM, 2012. [23] D. Meisner, J. Wu, and T. F. Wenisch. Bighouse: A simulation infrastructure for data center systems. In Performance Analysis of Systems and Software (ISPASS), 2012 IEEE International Symposium on, 2012. [24] P. Ranganathan, P. Leech, D. Irwin, and J. Chase. Ensemble-level power management for dense blade servers. SIGARCH Comput. Archit. News, 34(2), May 2006. [25] N. Sharma, S. Barker, D. Irwin, and P. Shenoy. Blink: managing server clusters on intermittent power. In Proceedings of the sixteenth international conference on Architectural support for programming languages and operating systems, ASPLOS ’11, pages 185–198, New York, NY, USA, 2011. ACM. [26] D. Tsirogiannis, S. Harizopoulos, and M. A. Shah. Analyzing the energy efficiency of a database server. In SIGMOD ’10, 2010. [27] D. Wong and M. Annavaram. Evaluating a prototype knightshift-enabled server. In WEED ’12, 2012.
13