Turkish Journal of Electrical Engineering & Computer Sciences http://journals.tubitak.gov.tr/elektrik/
Turk J Elec Eng & Comp Sci (2016) 24: 1768 – 1781 ¨ ITAK ˙ c TUB ⃝ doi:10.3906/elk-1309-65
Research Article
Scale invariant and fixed-length feature extraction by integrating discrete cosine transform and autoregressive signal modeling for palmprint identification Burhan ERGEN∗ Department of Computer Engineering, Faculty of Engineering, Fırat University, Elazı˘ g, Turkey Received: 09.09.2013
•
Accepted/Published Online: 30.06.2014
•
Final Version: 23.03.2016
Abstract: Recently, the need for automatic identification has caused researchers to focus on biometric identification methods. Palmprint-based biometric identification has several advantages such as user friendliness, low-cost capturing devices, and robustness. In this paper, a method that integrates the discrete cosine transform (DCT) and an autoregressive (AR) signal modeling is proposed for biometric identification. The method provides scale invariance and produces a fixed-length feature vector. In particular, the Burg algorithm is used for the determination of the AR parameters used as a feature vector. Experimental results demonstrate that a small number of the AR parameters that are modeling the DCT coefficients of a palmprint are sufficient to constitute a practically applicable identification system achieving a correct recognition rate of 99.79%. The accuracy of the proposed approach is not overly dependent on the number of training samples, another advantage of the method. Key words: Palmprint, discrete cosine transform, autoregressive signals modeling
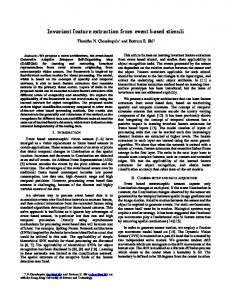
1. Introduction Information technology developments have appeared in many fields during the last few decades. This has increased the need of new verification methods that could replace traditional methods such as identification cards or personal identification numbers [1,2]. The use of palmprint identification systems as a hand-based biometric systems provides a reliable personal identifier, because the palmprint patterns are not duplicated, not even in monozygotic twins [2,3]. Figure 1 shows a typical palmprint and its region of interest (ROI). This is cropped from the acquired palmprint image as described in [4]. The ROI consists of discriminative information for the identification. Figure 1a shows a typical palmprint image, and Figure 1b represents its ROI, which is indicated with white lines in Figure 1a. Because palmprint identification systems have several advantages such as user friendliness, low cost, robustness, high accuracy, and high speed [5,6], palmprint-based security applications have a wide range of applications in various fields such as network security, social security, and access control. A regular palmprint recognition system would consist of 3 stages: preprocessing, feature extraction, and matching or classification. The feature extraction stage could be considered as the most important stage in palmprint recognition systems because this stage extracts reliable and distinctive feature vectors. Current popular approaches for feature extraction could be divided into two groups: structural and textural methods. Structural approaches make use of structural information such as delta points, principal lines, and creases [7,8]. ∗ Correspondence:
1768
[email protected]
ERGEN/Turk J Elec Eng & Comp Sci
Although the structural approaches have achieved some success, it is reported that extracting structural features is a very difficult task [9].
(a)
(b)
Figure 1. (a) A typical palmprint and (b) its region of interest (ROI).
Therefore, we will focus on texture-based approaches combining signal processing techniques and statistical methods to constitute feature vectors. Eigenpalm [10], Fisherpalms [11], Gabor filters [12], Fourier transform [13], cosine transform [14], and local texture features [15] are some of the methods that are used to find out textural properties. Indeed, textural analysis of a palmprint integrates the analysis of principle lines, creases, delta points, and minutiae while incorporating the smoothness or roughness of a palmprint. Methods relating to the spatial domain operate directly on the pixels of the input image. Alternatively, the pixels of the images are separated into frequency bands by filtering methods such as wavelet transform [6,16], Gabor filters [12], and contourlet transform [17]. With regard to frequency domain methods, the traditional Fourier transform (FT) and the discrete cosine transform (DCT) are used to discover the frequency coefficients of palmprint images. Some of the coefficients are considered as feature vectors and compared to measure similarity for identification. The DCT is the most popular approach when it comes to determining the frequency coefficients rather than the FT algorithms because of the complex arithmetic involved. The DCT works on real data and is widely used in practical situations. In the literature, PCA or LDA is also used with the DCT to achieve more accurate results, and to provide a way for dimension reduction and for shortening the length of feature vector [1,14,18]. Eigendecomposition steps in PCA and LDA decrease the practical implementation of the system because they require extra computation time and memory. Because the proposed method does not contain eigen-based reduction methods, it is applicable in practice. To obtain a feature vector for recognition purposes, the implementation forms of the DCT may be classified into three groups: block-based [19,20], frequency bands [14,21], and zigzag scanning [18]. In all of these studies, different kinds of methods are used to select coefficients for shortening the feature vector. Researchers generally prefer to crop or discard some of the coefficients according to their form of implementation [14,21]. In practice, choosing the DCT coefficients for a reliable recognition process is a very difficult and challenging task. In this study, we have proposed a method that uses all of the DCT coefficients. The proposed method, integrating the DCT and autoregressive (AR) modeling, provides scale invariance for the input images having different resolutions and fixed-length feature vectors. It can be briefly described as follows. After globally calculating 2D-DCT coefficients of the input image, all of the DCT coefficients are converted into a 1D signal using a scanning scheme for modeling them with a relatively small number of parameters. We have used two schemes for the conversion: zigzag scanning and band scanning. The AR method is chosen to model the 1D-DCT coefficients because the AR modeling methods are widely used in many applications [22–24]. 1769
ERGEN/Turk J Elec Eng & Comp Sci
Our previous experiments demonstrated that AR modeling provides a way for obtaining a fixed-length feature vector [25]. Although this study achieved CRR of about 93%, our experiments indicate that the results of the method are dependent on the number of training samples. It also revealed that the direct AR modeling of palmprint images has some inconsistencies in terms of the success rates. That the DCT determines the frequency coefficients regardless of data length provides scale invariance for the images having different sizes. The AR method can model data of different lengths with a fixed number of parameters. Hence, we have presented a novel method that integrates the DCT and AR modeling to provide a scale invariant palmprint recognition system with a fixed-length feature vector. The rest of this paper is organized as follows. We have provided a description of our approach in Section 2. Sections 3 and 4 present the experimental results and some conclusions, respectively.
2. Proposed method A palmprint recognition system mainly consists of three stages: preprocessing, feature extraction, and feature matching. The preprocessing stage consists of aligning the input image and extracting the ROI, which can be accepted as the central part of the palmprint. The feature extraction stage consists of three steps: obtaining the DCT coefficient matrix, converting it into a vector, and AR modeling. Initially, a 2D-DCT of the input image produces a 2D-DCT coefficient matrix. Afterwards, one of two different scanning schemes is used to convert the 2D-DCT coefficient matrix into a 1D coefficient vector. After applying the DCT with regard to the entire image, each of the scanning schemes is carried out. No other approach, such as block-based or band selection filtering, is used at this stage. For the conversion of the 2D-DCT coefficients into a vector, we have used the most well-known zigzag scanning scheme and a novel band scanning scheme. The third step involves the usage of an AR signal modeling method in order to construct a feature vector. Model parameters were accepted as they describe the image and are used as the feature vector of the given image. Figure 2 shows the proposed system for palmprint recognition.
Preprocessing
Feature Matching
Feature Extraction 2D DCT
Zigzag/Band Scanning
AR Modeling
Train Set
Classifier
Decision
Figure 2. Block diagram of the proposed palmprint-based recognition system.
3. DCT and dimension reduction The DCT has successful applications with regard to data compression, feature extraction, and recognition. The computational efficiency of the DCT is very high because it does not require complex arithmetic. It also has a relatively easy implementation in terms of practical applications thanks to the various kinds of fast algorithms 1770
ERGEN/Turk J Elec Eng & Comp Sci
developed [26]. The 2D-DCT of a f (x, y) signal can be described as follows: M −1 N −1 ∑ ∑ 1 F (u, v) = √ α(u)α(v) f (x, y)C(x, y, u, v),u = 0, 1, . . . , M andv = 0, 1, . . . , N, MN x=0 y=0
(1a)
where C(•) and α(•) are defined as follows: ( C(x, y, u, v) = cos
(2x + 1)uπ 2M {
α(w) =
)
( cos
(2y + 1)vπ 2N
) ,
(1b)
√1 2
w=0 1 otherwise
,
(1c)
where f (x, y) is assumed as an intensity image and F (u, v) denotes the 2D matrix of the DCT coefficients. Although block-based approaches are the most common implementations of the DCT, we have chosen to apply the DCT on the entire palmprint in this study. The result of the DCT is a 2D coefficient matrix, and it needs to be converted into a 1D vector for modeling purposes. Traditional zigzag scanning and band scanning schemes are used for the conversion. These schemes provide a simple way for dimension reduction from 2D to 1D. Figure 3 shows the DCT and the scanning schemes that are used in this study. Figure 3a shows the DCT coefficients of Figure 1b as an image, and Figures 3b and 3c show the zigzag scanning scheme and the band scanning scheme, respectively.
(a)
(b)
(c)
Figure 3. (a) A DCT transformed palmprint, (b) zigzag scanning scheme, and (c) band scanning scheme.
Figure 4 shows the normalized signals after the zigzag scanning scheme and the band scanning schemes for the first 500 pixels. Indeed, the resultant vector has a length of 16,384 for the palmprint image that consists of 128 × 128 pixels. Each of the scanning schemes represents a different signal to be modeled. The two 1D signals after the zigzag scanning scheme and the band scanning scheme are shown in Figures 4a and 4b, respectively. 4. AR signal modeling The AR signal modeling method is the most popular modern parametric method used with regard to spectral estimation problems. It is generally used to detect the frequencies of a particular signal in a noise-like signal. 1771
ERGEN/Turk J Elec Eng & Comp Sci
A discrete signal can be considered as a combination of current output values and the past output values of a system. In parametric AR modeling, the input signal of the system should be assumed as a Gaussian white noise signal having zero mean. Weights on previous outputs minimize the average square errors of the estimated AR parameters. If u(n) and x(n)indicate the zero mean white noise input and output of a system, then the AR model of the system can be given as follows [27]: p ∑
a(k)x(n − k) = u(n),
(2)
k=0
where a(k) indicates the AR parameters modeling the signal, or the system producing the signal. 1
Normalized Amplitude
Normalized Amplitude
1
0.5
–0.5
–0.5
–1
0.5
100
200
Pixels
300
400
500
–1
100
200
300
400
500
Pixels
(a)
(b)
Figure 4. The signals after scanning schemes: (a) the zigzag scanning scheme and (b) the band scanning scheme.
For estimating the AR parameters, the method minimizes the forward prediction error in the least square sense in order to fit the AR model to the given input data [28]. Parameters can be calculated by solving the autocorrelation function obtained from the following equation [29]: 2 p ∞ ∑ 1 ∑ σ = a(k)x(n − k) , x(n) − N n=−∞ 2
(3)
k=1
where σ 2 is the variance of the white noise input signal, which is assumed as 1; x (n) is the signal to be modeled; and p is the model order. The parameters obtained are the poles of the system modeled and can also be used to estimate the spectrum of the system. This can be found by using the following equation [30]: σ ˆ2 Pˆ (f ) = 2 , p ∑ −j2πf k 1 + a(k)e
(4)
k=1
where Pˆ (f ) is the spectrum of the model signal, a(k) are the AR parameters of the model signal, and p is the model order. 1772
ERGEN/Turk J Elec Eng & Comp Sci
The Burg algorithm [31,32] is one of the best known algorithms for estimating model parameters. The basic idea of the Burg algorithm is to estimate the AR parameters using an order recursive least square lattice method instead of solving an autocorrelation function. In this process, forward and backward errors are minimized so that the AR parameters can satisfy the Levinson–Durbin recursion [33]. Forward and backward prediction errors for a p-order model are defined as follows: fˆp (n) = x(n) +
p ∑
a ˆp (i)x(n − i), n = p + 1, · · · , N ,
(5a)
i=1
gˆp (n) = x(n − p) +
p ∑
a ˆ∗p (i)x(n − p + i), n = p + 1, · · · ,N.
(5b)
i=1
The output of the filter can be obtained by substituting the Levinson recurrence formula. The relation between AR parameters and the reflection coefficient kˆp can be given as follows: { a ˆp (i) =
ap−1,i + kp a∗p−1,p−i , i = 1, · · · , p − 1 . kp, i = p
(6)
Reflection coefficients are estimated as follows: N ∑
kˆp = −2
n=p+1 N ∑
[(
∗ (n) fˆp−1 (n)ˆ gp−1
fˆp−1 (n)
].
)2
(7)
2
+ (ˆ gp−1 (n))
n=p+1
The recursive expressions given in Eq. (8) should be satisfied by the prediction errors. fˆp (n) = fˆp−1 (n) + kˆp gˆp−1 (n − 1)
(8a)
gˆp (n) = gˆp−1 (n − 1) + kˆp∗ fˆp−1 (n)
(8b)
AR coefficients are estimated with a recursive algorithm by using these expressions [34,35]. The Burg algorithm for AR modeling is a stable and computationally efficient method. The estimated AR parameters of the palmprint in Figure 3 are shown in Table 1. The model order is chosen as 11. The AR parameters for zigzag scanning and band scanning are provided in the first and second rows, respectively. Because the AR parameters can be considered as the poles of a system, they can be given on a complex plane called Z-plane plots. The Z-plane plot presentations of the parameters in Table 1 are shown in Figures 5a and 5b for the zigzag and band scanning schemes, respectively. The symbols O and × represent a zero and a pole in a Z-plane plot, respectively. Any presentation consists of one zero and many poles referring to the AR parameters. As stated before, spectral estimations can be done using the AR parameters. The spectra using the estimated model parameters for the zigzag and band scanning are shown in Figures 5a and 5b. Table 1. The estimated AR parameters of the palmprint in Figure 3.
Zigzag Band
1.0000 - 0.0645 - 0.0033 - 0.0029 0.0011 0.0506 - 0.0151 - 0.0640 - 0.0184 - 0.0337 - 0.0305 1.0000 - 0.0104 0.0070 - 0.0694 0.0006 - 0.0312 0.0098 - 0.0675 0.0567 - 0.0425 - 0.0141 1773
ERGEN/Turk J Elec Eng & Comp Sci
0.5
0.5
Imaginary Part
1
Imaginary Part
1
10
10
–0.5
–0.5
–1
–1
–1
–0.5
0.5
–1
1
–0.5
0.5
1
Real Part
Real Part
Figure 5. Z-plane plots of the AR parameters for: (a) the zigzag scheme and (b) the band scheme.
5. Classification One of the most widely used classifiers is the k nearest neighbor classifier (kN N ) because of its simplicity and classification performance. kN N classifies an unlabeled input example among its k -nearest neighbors in the training set. Thus, the distance metric used to identify nearest neighbors needs to be picked carefully for its effectiveness in classifying performance. Here, kN N is chosen to classify the AR parameters, which are used as a feature vector to construct a practically applicable system. A classification problem can be summarized as assigning a given feature vector f to a class by measuring similarities between f and the feature vectors of known classes ti . It is assumed that the required information consists of a training set T = {(t1 , c1 ) , . . . , (tN , cN )} of N vector ti (i = 1, 2, . . . , P ) and the corresponding class labels ci (i = 1, 2, . . . , N ). Thus, an unclassified input vector f is assigned to the class presented by a majority of its k -nearest neighbors in T . The similarity that is inversely proportional to the distance between the training image and the test image can be measured by the Euclidean distance, the Manhattan distance (or city block), and the cosine distance. If the distance between all the classes in the database is minimal, the test image is identified as it is belonging to class c . The Euclidean distance (de ), the Manhattan distance (dm ), and the cosine distance (dc ) are defined as follows [36,37]: v u P u∑ de (f, t) = t (f (i) − t(i)),
(9a)
i=1
dm (f, t) =
P ∑ i=1
1774
|f (i) − t(i)|,
(9b)
ERGEN/Turk J Elec Eng & Comp Sci
N ∑
dc (f, t) = √
f (i)t(i)
i=1 N ∑
i=1
p(i)2
N ∑
,
(9c)
t(i)2
i=1
where f (i)is the feature of the image in the gallery, t(i) is the feature of the test image, and p is the length of the feature vector. The kN N method classifies the given input by finding out the minimum distance. This procedure of the classifier can be simply formulized as follows: argmin(d (f, ti )) → assignc,
(10)
where d is the distance vector between the input feature and the features in T . Indeed, this classification method could be summarized as follows. A distance vector d (f, ti ) is constituted between the feature vectors of the input to be classified and the known classes, which are labeled patterns. The unknown input is then assigned to a class by finding out the minimum distance in the distance vector. 6. Experiments and results Our proposed method based on the AR modeling of the DCT coefficients is tested on the public palmprint database (PolyU - II Palmprint Database, 2006) [38]. This palmprint database includes 7752 palm images from 386 volunteers that were collected in two sessions. Each volunteer provided approximately 10 images of each palm for each session. In our experiment, the central part (128 × 128) of the image is cropped from the original palmprint as described in [4]. Our proposed system is applied both with regard to same-sized and differently sized palmprints. The same-sized palmprints (128 × 128) are used to show the performance of the proposed system for palmprint recognition, while differently sized palmprints are used to prove that the proposed system is scale invariant. Both of the palmprints are tested using zigzag and band scanning schemes. Although the same-sized palmprints have a pixel resolution of 128 × 128, the resolutions of the differently sized palmprints vary between 30 × 30 and 110 × 110 pixels in groups of ten. In order to create a differently sized palmprint database, each of the 10 palmprints from a single volunteer is resized. That is, while the first palmprint image of a volunteer in a database shows his/her original palmprint, the second palmprint image shows a resized original image of 100 × 100, the third palmprint image shows a resized original image of 90 × 90, and so on. In this way, a database consisting of different sizes and textures is formed. Classifications of the AR modeling are experimented on with regard to both the same-sized palmprints and the differently sized palmprints for both the zigzag and band scanning schemes. In classification, the distance measurements are performed using Eqs. (7), (9b), and (9c). These experiments have been performed in terms of the five different ratios of training and testing images. In the experiments, some of the 10 images are used for training and the remaining images are used for testing. The training and test samples are chosen randomly. The experiments are conducted on a computer system (Intel Core i5 CPU 2.67 GHz and 4 GB RAM with MATLAB 7.9) with the whole database that contains roughly 7750 palmprint images. Table 2 summarizes the first experiment performed on the same-sized palmprints using the AR modeling of the zigzag scanned DCT coefficients. The results are presented for the different ratios and the feature vector length, which is the number of the AR parameter. CRRs are calculated for the different numbers of the AR 1775
ERGEN/Turk J Elec Eng & Comp Sci
parameters. The maximum CRR is obtained when the number of AR parameters is 300. Table 3 presents the results of the second experiment performed on the differently sized palmprints using the AR modeling of the zigzag scanned DCT coefficients. Table 2. The CRRs of the zigzag scanning scheme on the same-sized palmprints.
Ratio 1:9
2:8
3:7
4:6
5:5
Distance method Euclidean Manhattan Cosine Euclidean Manhattan Cosine Euclidean Manhattan Cosine Euclidean Manhattan Cosine Euclidean Manhattan Cosine
DCT + AR 25 50 87.55 93.03 90.55 94.94 87.72 93.26 95.03 97.34 95.81 98.02 95.09 97.47 96.23 97.80 97.04 98.15 96.34 97.83 97.09 98.77 97.88 99.11 97.17 98.83 97.90 98.91 98.47 99.22 97.90 98.91
100 94.58 95.94 94.77 98.46 98.98 98.56 98.65 99.11 98.78 99.20 99.31 99.24 99.40 99.53 99.40
200 95.12 96.05 95.19 98.07 98.47 98.14 99.04 99.24 99.07 99.07 99.20 99.09 99.53 99.53 99.51
300 95.91 95.91 95.97 98.35 98.44 98.44 98.78 98.83 98.83 99.07 99.20 99.09 99.53 99.53 99.58
Table 3. The CRRs of the zigzag scanning scheme on the differently sized palmprints.
Ratio 1:9
2:8
3:7
4:6
5:5
Distance method Euclidean Manhattan Cosine Euclidean Manhattan Cosine Euclidean Manhattan Cosine Euclidean Manhattan Cosine Euclidean Manhattan Cosine
DCT + AR 25 50 88.26 93.31 90.43 94.81 88.43 93.44 94.94 97.39 95.87 97.97 94.96 97.45 96.68 97.90 97.22 98.46 96.74 97.92 96.91 98.57 97.51 98.94 96.93 98.70 98.03 99.01 98.34 99.27 98.03 99.01
100 94.50 95.82 94.69 97.87 98.46 97.87 98.83 99.01 98.85 98.74 98.92 98.76 99.17 99.27 99.17
200 95.20 95.97 95.43 98.17 98.54 98.31 98.70 98.94 98.83 99.15 99.24 99.15 99.14 99.27 99.19
300 95.61 95.97 95.76 98.12 98.34 98.20 98.63 98.76 98.72 99.07 99.02 99.11 99.30 99.43 99.32
Values in the tables are the results of random observations. Therefore, CRRs according to the model order for the same ratio of training and testing samples may be changed very slightly. The training and testing images are randomly selected for each experiment. Comparing the results in Tables 2 and 3, the proposed system shows very similar performance for the same-sized palmprints and the differently sized palmprints. Thus, the result of the comparison proves that the 1776
ERGEN/Turk J Elec Eng & Comp Sci
proposed system is scale invariant. In other words, the AR modeling and the DCT methods in the proposed system provide the fixing of the feature vector length and scale (or size) invariance. Tables 4 and 5 present results of the experiments for the band scanning scheme on the same-sized palmprints and the differently sized palmprints, respectively. It can be seen that the band scanning scheme produces slightly more successful results. That the band scanning scheme can produce slower varying signals is the reason for this success. Table 4. The CRR of the band scanning scheme using the same-sized palmprints.
Ratio 1:9
2:8
3:7
4:6
5:5
Distance method Euclidean Manhattan Cosine Euclidean Manhattan Cosine Euclidean Manhattan Cosine Euclidean Manhattan Cosine Euclidean Manhattan Cosine
DCT + AR 25 50 88.64 93.50 91.35 95.71 88.70 93.50 95.36 97.36 96.27 98.10 95.36 97.40 96.46 98.61 97.37 99.09 96.48 98.61 97.32 98.81 98.01 99.28 97.32 98.81 98.21 99.17 98.57 99.40 98.21 99.19
100 94.32 95.30 94.58 97.61 98.04 97.70 98.29 98.57 98.33 98.92 99.13 98.96 98.86 98.88 98.86
200 94.95 95.39 95.06 97.74 97.89 97.78 98.59 98.64 98.63 98.87 98.94 98.89 99.17 99.11 99.19
300 96.59 97.31 96.60 98.96 99.14 98.96 99.24 99.38 99.24 99.33 99.48 99.33 99.53 99.64 99.53
Table 5. The CRR of the band scanning scheme on the differently sized palmprints.
Ratio 1:9
2:8
3:7
4:6
5:5
Distance method Euclidean Manhattan Cosine Euclidean Manhattan Cosine Euclidean Manhattan Cosine Euclidean Manhattan Cosine Euclidean Manhattan Cosine
DCT + AR 25 50 89.58 93.60 91.85 95.68 89.62 93.63 94.87 97.29 96.30 98.31 94.90 97.29 96.74 98.55 97.48 98.92 96.76 98.55 97.38 98.89 98.07 99.20 97.38 98.89 98.36 99.04 98.75 99.35 98.36 99.01
100 95.84 97.29 95.90 98.29 98.94 98.33 98.81 99.20 98.79 99.33 99.58 99.30 99.27 99.50 99.27
200 96.56 97.66 96.59 98.63 98.88 98.65 99.11 99.27 99.11 99.37 99.52 99.39 99.58 99.63 99.58
300 96.28 97.26 96.34 98.51 98.80 98.51 99.01 99.22 99.03 99.61 99.58 99.61 99.61 99.79 99.63
The experimental results also indicate that a longer feature length provides higher recognition rates. The CRRs of the proposed method are higher than 87% in any case. Even if a small feature vector size (such as 25) 1777
ERGEN/Turk J Elec Eng & Comp Sci
is chosen, the CRR remains higher than 87%. A greater number of AR parameters yields higher CRRs of more than 99%. It can be inferred that the AR modeling effectively reduces the number of features required for the correct recognition rate. The optimal order of the AR model is still a research topic in the literature. In a time series analysis, many techniques have been proposed to estimate a minimum order of the AR model, such as the Akaike information criterion, the final prediction error, and the Schwartz Bayesian criterion. We have tried these criteria to determine an optimal order. Each criterion exposes different order values, varying from 8 to 60 for different images. Therefore, the experimental results are presented with respect to different orders. In order to calculate the general CRR of the proposed system, 10-fold cross-validation tests are performed with respect to some AR orders. In a k -fold cross-validation test, a random subset of the available data is selected repeatedly as a training set, and the remaining part of the data is used as test set. Table 6 shows the results of the experiments performed on both the same-sized database and the differently sized database using the zigzag and band scanning schemes. Table 6. Ten-fold cross-validation experiments with respect to the AR order.
Order of AR model 25 50 100 200 300
Same-sized database Band Zigzag 99.04 98.94 99.53 99.39 99.61 99.61 99.65 99.64 99.73 99.64
Differently sized database Band Zigzag 99.37 98.98 99.53 99.44 99.70 99.62 99.75 99.64 99.75 99.64
The proposed method is more successful for the differently sized images. These differences probably arise from the estimated AR parameters. The differently sized images have smaller sizes and produce shorter signals than the same-sized images. This is because it is harder to model a long signal than a smaller signal with the same number of parameters. Consequently, the estimated AR parameters may not model long signals adequately. The differently sized images are the downsized images of the image in the same-sized database. For this reason, the length of a 1D-DCT coefficient of a downsized image is shorter than the original one. Table 7 shows a comparison of CRR between the proposed method and some of the transform-based methods used in the literature. The stability of the proposed method with respect to number of training samples indicates that the proposed method is better than the others. It is clearly seen that a low number of training samples significantly affects the performance of the other recognition systems. For instance, if the number of training samples is 2 at the fourth column in Table 7, the CRRs of the other methods may decrease to 80%. However, the performance of the proposed method never decreases to 90% if p is greater than 25. Table 7. A comparison of CRRs of different methods.
Method Traditional Gabor method [39] Gabor local invariant features [12] PCA [40] GB (2D) 2 PCA [40] W2D-DLPP [41] Proposed method 1778
Training samples per class (%) 5 4 3 2 92.88 91.23 86.99 80.96 98.36 97.12 94.52 88.22 95.00 94.00 89.50 70.25 99.00 98.50 96.00 94.50 94.91 89.8 81.80 99.75 99.48 99.38 99.14
ERGEN/Turk J Elec Eng & Comp Sci
7. Conclusion In this paper, a novel palmprint recognition system based on AR signal modeling and the DCT has been presented. After transforming 2D-DCT coefficients of a palmprint into a 1D signal, the Burg algorithm is used to estimate the AR model parameters of the signal. Although palmprint recognition systems in the literature mostly focus on the CRRs, complexity and applicability of recognition systems are also important and should be dealt with. Methods trying to obtain short and fixed-length feature vectors complicate the system and make it harder to be realized in practice. Our proposed system provides a short and fixed-length feature vector without any resizing processes or any eigenvalue decomposition procedures that complicate the recognition system. The integration of the DCT and the AR modeling is a novel method to constitute a fixed-length feature vector and to provide scale invariance. In the proposed method, although the DCT provides scale invariance by finding frequency components, the AR modeling produces a short and fixed-length feature vector by modeling different lengths of frequency coefficients. Nonetheless, the CRRs of the proposed system do not decrease significantly if the number of training sample is decreased. This system achieved very high CRRs, despite utilizing a very small number of training samples and feature lengths. References [1] Kong A, Zhang D, Kamel M. A survey of palmprint recognition. Pattern Recogn 2009; 42: 1408-1418. [2] Badrinath G, Gupta P. Stockwell transform based palmprint recognition. Appl Soft Comput 2011; 11: 4267-4281. [3] Connie T, Jin ATB, Ong MGK, Ling DNC. An automated palmprint recognition system. Image Vision Comput 2005; 23: 501-515. [4] Zhang D, Kong WK, You J, Wong M. Online palmprint identification. IEEE T Pattern Anal 2003; 25: 1041-1050. [5] Zhang D, Guo Z, Lu G, Zhang L, Zuo W. An online system of multispectral palmprint verification. IEEE T Instrum Meas 2010; 59: 480-490. [6] Ekinci M, Aykut M, Palmprint recognition by applying wavelet subband representation and kernel PCA. In: 5th International Conference on Machine Learning and Data Mining in Pattern Recognition; 18–20 July 2007; Leipzig, Germany. Berlin, Germany: Springer. pp. 628-642. [7] Jia W, Huang DS, Zhang D. Palmprint verification based on robust line orientation code. Pattern Recogn 2008; 41: 1504-1513. [8] Wu X, Zhang D, Wang K. Palm line extraction and matching for personal authentication. IEEE T Syst Man Cy A 2006; 36: 978-987. [9] Tao J, Jiang W, Gao Z, Chen S, Wang C. Palmprint recognition based on improved 2DPCA. Lect Notes Artif Int 2006; 4088: 455-462. [10] Lu G, Zhang D, Wang K. Palmprint recognition using eigenpalms features. Pattern Recogn Lett 2003; 24: 1463-1467. [11] Wu X, Zhang D, Wang K. Fisherpalms based palmprint recognition. Pattern Recogn Lett 2003; 24: 2829-2838. [12] Pan X, Ruan QQ. Palmprint recognition using Gabor based local invariant features. Neurocomputing 2009; 72: 2040-2045. [13] Li W, Zhang D, Xu Z. Palmprint identification by Fourier transform. Int J Pattern Recogn 2002; 16: 417-432. [14] Jing XY, Zhang D. A face and palmprint recognition approach based on discriminant DCT feature extraction. IEEE T Syst Man Cy B 2004; 34: 2405-2415. [15] Tiwari K, Arya DK, Badrinath G, Gupta P. Designing palmprint based recognition system using local structure tensor and force field transformation for human identification. Neurocomputing 2013; 116: 222-230.
1779
ERGEN/Turk J Elec Eng & Comp Sci
[16] Sumathi S, Rani Hemamalini R. Person identification using palm print features with an efficient method of DWT. In: International Conference on Global Trends in Information Systems and Software Applications; 2012. Berlin, Germany: Springer. pp. 337-346. [17] Mansoor AB, Masood H, Mumtaz M, Khan SA. A feature level multimodal approach for palmprint identification using directional subband energies. J Netw Comput Appl 2011; 34: 159-171. [18] Dabbaghchian S, Ghaemmaghami MP, Aghagolzadeh A. Feature extraction using discrete cosine transform and discrimination power analysis with a face recognition technology. Pattern Recogn 2010; 43: 1431-1440. [19] Kumar A, Zhang D. Personal recognition using hand shape and texture. IEEE T Image Process 2006; 15: 2454-2461. [20] Qing C, Jiang J. An EDBoost algorithm towards robust face recognition in JPEG compressed domain. Image Vision Comput 2010; 28: 1659-1670. [21] Kishore KM, Addanki PR. An evaluation of palm print recognition techniques using DCT, Haar transform and DCT wavelets and their performance with fractional coefficients. International Journal of Computer Applications 2011; 32: 31-38. [22] Lawhern V, Hairston WD, McDowell K, Westerfield M, Robbins K. Detection and classification of subject generated artifacts in EEG signals using autoregressive models. J Neurosci Meth 2012; 208: 181-189. [23] Weiss J, Bernardara P, Andreewsky M, Benoit M. Seasonal autoregressive modeling of a skew storm surge series. Ocean Model 2012; 47: 41-54. [24] Ergen B, Tatar Y, Gulcur HO. Time–frequency analysis of phonocardiogram signals using wavelet transform: a comparative study. Comput Method Biomec 2012; 15: 371-381. [25] Ergen B. Texture analysis and classification using autoregressive signal modeling method. In: In: 1st Taibah University International Conference on Computing and Information Technology; 2012. pp. 107-110. [26] Cho NI. Fast algorithm and implementation of 2D discrete cosine transform. IEEE T Circuits Syst 1991; 38: 297-305. [27] Acharya UR, Sankaranarayanan M, Nayak J, Xiang C, Tamura T. Automatic identification of cardiac health using modeling techniques: a comparative study. Inform Sciences 2008; 178: 4571-4582. [28] Mohamed SS, Salama MMA. Prostate cancer spectral multifeature analysis using TRUS images. IEEE T Med Imaging 2008; 27: 548-556. [29] Proakis JG. Digital Signal Processing: Principles, Algorithms, and Applications. 4th ed. New Delhi, India: Pearson Education India, 2007. [30] Subasi A, Er¸celebi E, Alkan A, Koklukaya E. Comparison of subspace based methods with AR parametric methods in epileptic seizure detection. Comput Biol Med 2006; 36: 195-208. [31] Childers DG. Modern Spectrum Analysis. New York, NY, USA: IEEE Computer Society Press, 1978. [32] Faust O, Acharya RU, Allen AR, Lin CM. Analysis of EEG signals during epileptic and alcoholic states using AR modeling techniques. IRBM 2008; 29: 44-52. ¨ ˙ Comparison of eigenvector methods with classical and model-based methods in analysis of [33] Ubeylı ED, G¨ uler I. internal carotid arterial Doppler signals. Comput Biol Med 2003; 33: 473-493. [34] Bos R, De Waele S, Broersen PMT. Autoregressive spectral estimation by application of the Burg algorithm to irregularly sampled data. IEEE T Instrum Meas 2002; 51: 1289-1294. [35] Marple L. A new autoregressive spectrum analysis algorithm. IEEE T Acoust Speech 1980; 28: 441-454. [36] Zhong L, Jinsha Y, Hong Y, Ke Z. Wireless communications, networking and mobile computing. In: WiCOM 2008 4th International Conference; 2008. pp. 1-4. [37] Vadivel A, Majumdar A, Sural S. Performance comparison of distance metrics in content-based image retrieval applications. In: Proceedings of the International Conference on Information Technology; 2003; Bhubaneswar, India. pp. 159-164.
1780
ERGEN/Turk J Elec Eng & Comp Sci
[38] Zhang D. PolyU Palmprint Database. Hong Kong: Biometric Research Centre, Hong Kong Polytechnic University, 2006. [39] Kong WK, Zhang D, Li W. Palmprint feature extraction using 2D Gabor filters. Pattern Recogn 2003; 36: 23392347. [40] Pan X, Ruan Q. Palmprint recognition using Gabor feature based (2D)2PCA. Neurocomputing 2008; 71: 3032-3036. [41] Lu J, Tan YP. Improved discriminant locality preserving projections for face and palmprint recognition. Neurocomputing 2011; 74: 3760-3767.
1781