contents of network traffic streams in order to perform network security ..... Reliable delivery and storage: In order to ensure reliable de- ..... [22] âCisco. 7200.
Scaling Data-Plane Logging in Large Scale Networks Ahsan Arefin, Ahmed Khurshid, Matthew Caesar, Klara Nahrstedt Department of Computer Science University of Illinois at Urbana-Champaign, IL, USA {marefin2, khurshi1, caesar, klara}@illinois.edu
Abstract—Understanding and troubleshooting wide area networks (such as military backbone networks and ISP networks) are challenging tasks due to their large, distributed, and highly dynamic nature. Building a system that can record and replay fine-grained behaviors of such networks would simplify this problem by allowing operators to recreate the sequence and precise ordering of events (e.g., packet-level forwarding decisions, route changes, failures) taking place in their networks. However, doing this at large scales seems intractable due to the vast amount of information that would need to be logged. In this paper, we propose a scalable and reliable framework to monitor fine-grained data-plane behavior within a large network. We give a feasible architecture for a distributed logging facility, a tree-based data structure for log compression and show how this logged information helps network operators to detect and debug anomalous behavior of the network. Experimental results obtained through trace-driven simulations and Click software router experiments show that our design is lightweight in terms of processing time, memory requirement and control overhead, yet still achieves over 99% precision in capturing network events.
I. I NTRODUCTION In order to keep their networks running efficiently and securely, network operators need to build a deep understanding of traffic characteristics and the kinds of events taking place in their networks [1]. An important step in modeling network behavior, analyzing its performance, and troubleshooting problems when things go wrong, involve monitoring its operations over time. However, monitoring is a highly challenging problem in large networks such as military backbone networks and Internet Service Provider (ISP) networks. They consist of hundreds of routers transiting tens of billions of data packets daily, with dynamics exacerbated by high rates of routing table churn and increasing amounts of load balancing. Yet building an understanding of network performance and troubleshooting in real-time are crucial, for example to assist network-centric warfare [2] and environment surveillance activities in military backbone networks connecting multiple tactical networks [3][4], and to assist real-time traffic (VOIP, multimedia streaming, online gaming etc.) in ISP and data center networks. To cope with such a massive flood of information, large networks often resort to heuristics, for example by monitoring subsets of their networks, only monitoring heavy-hitter flows, periodically sampling performance, or collecting loose-grained statistical information (such as average-case performance). Protocols such as NetFlow [5] and its variant [6] allow network operators to collect flow records of traffic information.
Protocols such as SNMP allow more customizable monitoring by querying a device-specific MIB (Management Information Base). However, while collecting such loose-grained statistical information works well for certain specific classes of problems (e.g., detecting traffic volume anomalies), and while logging all messages seems possible for certain protocols (e.g., retaining records of routing protocol updates [7]), localizing more general classes of faults (e.g., transient/intermittent faults, convergence events, instability) at the data plane has remained something of a black art. Understanding a network’s packet forwarding behavior would be simpler if it were possible to log detailed history of each packet inside the network. The history includes time and ordering information of each packet at each router. Simply logging such fine-grained information could provide substantial benefits including the ability to replay past network events (i.e., recreating the sequence of events taking place in the network over a period of time) for troubleshooting, perform fine-grained performance analysis, detect network hotspots, analyze optimal network parameters for routers and links, detect malicious activities, perform attribution of attacks, and perform traffic engineering. For example, deterministic replay has been used to debug distributed applications by reconstructing information about the ordering and sequence of events taking place within the system [8]. If packet-level history of each router in a network can be logged, the network administrator can simply re-run the events for offline diagnosis and analysis in a controlled environment along with online debugging and troubleshooting. However, doing fine-grained logging of packet-level history in large networks seems extremely challenging. We need to log vast volumes of state for storing timing and ordering information of packets at each router, need to retain that state over long periods, and keep it up-to-date over time. In general, monitoring architectures in such cases are composed of two levels. Level one uses fast memory counters to collect statistics, and the second level is used to store long-term logs. Compression is important at both levels. It is important at the counter level because fast memory, which is required to cope with the line speed, is expensive and power hungry. So we want to keep that small. Compression in the second level is important, because we need to store vast volumes of log for long periods. The current flow monitoring standard NetFlow [5] keeps its first level information in DRAM as it generates large volume of data. Updating per-packet counters in DRAM is already impossible with today’s line speeds;
furthermore, the gap between DRAM speeds (improving 79% per year) and link speeds (improving 100% per year) is increasing over time [9]. NetFlow solves this problem by sampling; only sampled packets result in updates. This reasonably impacts the accuracy of our objectives. In this paper, we consider the questions “To what degree is it possible to log important data-plane behavior in large networks?” and “How much information do we need to log for this purpose while still retaining reliability and scalability in terms of memory, processing and control overhead?”. We propose a scalable and reliable architecture called RESCUE (REliable and SCalable distribUted nEtwork monitoring) with aggregation-based “compression” techniques to reduce the amount of storage required to analyze data-plane behavior. These compression techniques enable our design to scale to core routers (by enabling statistics-counting to take place in fast memory such as TCAM and SRAM), reduce cost of longterm storage (by reducing necessary disk storage and control information to keep that storage up-to-date), as well as speed up monitoring operations such as replay and online analysis of data-plane events (by reducing the amount of information that needs to be traversed when analyzing logs). Due to the extremely challenging nature of this problem, we make use of techniques that bring some loss in accuracy (in particular, we employ some lossy forms of compression). We do not log the payloads or header information of data packets; only timing and ordering information (i.e., metadata) is logged, and we also lose some information about packet delays. We do not attempt to reconstruct the precise ordering of events across routers, instead we assume routers in the network have clocks that are loosely synchronized (e.g., using GPS [10] or NTP [11]) and only aim to reconstruct event orderings across routers within that granularity. However, we show that even with these relaxed assumptions, our system still retains substantial benefits for network monitoring, management and troubleshooting. We provide a list of possible faults in networks, and show that unlike sampling-based approaches (e.g., NetFlow), RESCUE can deterministically localize problems in each of these cases. We perform several experiments, and find that our design can scale to current Internet-scale traffic with low overhead in terms of processing, memory and control traffic, and allows for more accurate diagnosis than previouslyproposed approaches. We believe this may be an early step towards solving the larger challenging question of how to design efficient traffic-level monitoring protocols for wide-area networks. Our proposed technique is applicable in military backbone networks, wired and wireless backbone of tactical networks, ISP networks, data center networks, or any large scale enterprise networks for scalable traffic monitoring, online troubleshooting and offline analysis. II. R ELATED W ORK The traditional approach to network traffic monitoring focuses on statistical monitoring at a per-flow or per-interface granularity. Sampled NetFlow [5] with sampling parameter N (one out of every N packets is sampled) is used to detect and monitor large flows. SNMP is used to collect link-based statistics, and sometimes used in conjunction with NetFlow
to detect traffic volume anomalies [12]. cSAMP [6] improves upon NetFlow with hash-based coordination and network-wide optimization to eliminate redundant reports without explicit communication between routers. While these approaches are used for accounting [13], traffic engineering [14] and volume anomaly detection, they suffer from inaccuracy when performing more general analyses, for example when estimating the number of flows [15], estimating performance of new service deployments or network algorithms [16], detecting transient anomalies, or measuring properties of network convergence. To detect traffic anomalies, NetFlow logs are often combined with OSPF (Open Shortest Path First) routing tables in order to determine paths taken by packets. However, synchronizing traces across different sources is challenging, prone to mistakes, and can have reduced accuracy. RESCUE tries to solve these tasks more accurately. By analyzing logs provided by our framework, we can determine specific paths and timing information about individual packets inside a network. It provides a higher information metric [17] with lower memory requirement as compared to previous approaches. A subjective comparison is given in Table I. Maier et al. [18] proposed a scheme to archive the raw contents of network traffic streams in order to perform network security analysis. However, their scheme only stores the first 10 − 20 kilobytes of data of each connection that works well for their target domain of intrusion detection, but is not sufficient to deal with other network misbehaviors like routing instability and link congestion. Our proposed framework aims to provide stronger accountability, the ability to localize the cause of a particular network fault (such as a packet loss) and deterministically narrow it back to the source, as opposed to collecting statistical information. Some works focus on detecting anomalous network behavior by logging and analyzing control-plane messages (i.e., routing protocol messages). Markopoulou et al. [19] used the Python Routing Toolkit (PyRT) as a passive IS-IS listener to collect IS-IS link up/down messages. These messages were analyzed to detect and classify IP layer connectivity failures among the routers. Shaikh et al. [7] presented a monitoring framework that provides real-time tracking of OSPF updates and facilitates offline in-depth analysis of route flapping, LSA (Link State Advertisement) storms and other anomalous behavior. While several important aspects of network performance can be understood by observing updates in the network’s control plane, other aspects (such as problems that only manifest themselves in the data plane, or control/data plane inconsistencies [20]) require analysis of data-plane behavior as well, which we target in this work. III. S YSTEM G OALS Our high-level goal is to construct a trace of network activities that allows the ability to reproduce, in as much detail as possible, information about events taking place in a network. To accomplish this, we need to know the time and ordering information of each packet at each router on some level of granularity. As we do not require strict synchronization across routers, global ordering of packets across routers can be resolved with the help of path information gathered through
TABLE I C OMPARISONS WITH RELATED WORK
Unsampled NetFlow complete high incomplete no
Sampled NetFlow incomplete moderate to low incomplete no
routing protocol updates [21]. One simple approach is to log necessary information without any compression as each packet traverses the network through different routers. However, logging packet-level information individually for each packet is not feasible for several reasons. First, routers must collect online statistics in a fast memory (such as SRAM or TCAM) to keep up with line rates. However, the size of such memory is bounded (often in the range of couple of megabytes [22]), due to their high cost and large power demands. Per-packet information would not fit in such memory, and streaming it to DRAM would not scale due to limitations on memory bandwidth. Second, storing logs of individual data packets would not scale. Third, processing such logs for analyses would represent a massive computational challenge. To deal with these challenges, we propose techniques to compress packet level information. In order to effectively diagnose and localize problems in a networks, we would like to ensure that the signature of the original event (the way the event manifests itself on network operation) is captured in the compressed trace. To clarify our design requirements, we consider here some taxonomies of events (proposed in [23]) and the particular design choices necessary for our system to capture their signatures. In particular, there are three key cases: events may manifest themselves in the data plane (affecting how data packets are forwarded), in the control plane (affecting how routes are computed), or both. Events affecting the data plane: Many kinds of events trigger undesired data-plane behavior, including failures of links or routers, congestion, and misconfigurations. The underlying cause of these events may vary widely: a router/link may fail due to hardware and software errors, overload, configuration errors, or planned maintenance activities. However, all these events cause one or more data packets to be handled in a manner differently than the desired behavior (e.g., they are dropped, or they oscillate back and forth between paths, or loop between routers). Hence a mechanism that can log and replay packet-level forwarding behavior at the data plane would be sufficient to collect signatures of a number of such events. Events affecting the control plane: Many events can harm the correctness of route computations within the network: route advertisements may flap due to internal or external instability (which can overload routers), misconfigurations, or router software implementation errors. However, in any of these cases, there can only be two kinds of effects on the network: either routing updates become logically incorrect, or they become inconsistent with the values of the data plane. In either case, maintaining a log of control-plane packets (for example, as done in [7]), and correlating them with data-plane logs, is sufficient to contain the signatures of these events. In light of the above discussion, it is evident that in order
cSAMP incomplete low incomplete no
RESCUE complete low complete yes
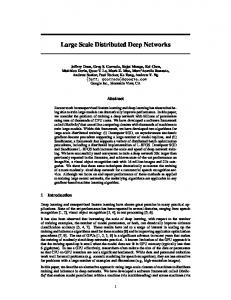
to develop a general mechanism to pinpoint the location and root cause of network faults, a comprehensive record of dataplane activities needs to be maintained, including information about packet latencies, forwarding paths, packet orderings or arrival patterns. However, more detailed packet information (contents of data packets, original source destination IPs, ports, extremely fine-grain information about packet arrival times) does not seem necessary to diagnose these problems. IV. S YSTEM M ODEL To address our goals, we propose the distributed logging infrastructure shown in Figure 1. Packet-level information is logged at routers, compressed over time intervals, and sent to a central node (called the Domain Controller or DC) for storage. Our infrastructure consists of several components. ROUTER MONITOR
DC compressed metadata Router Router Router
Data Manager
Fraction of packets sampled Memory requirement Per-packet IGP path information Per-packet latency information
Data Store Update Log
Event Log
Fig. 1. Components of Router Monitor: interface for distributed logging of compressed metadata.
A. Router Monitor Each router contains a Router Monitor with two components: Data Store: When an event occurs at a router (a data packet arrives, or is forwarded, or some control-plane change occurs), an update needs to be sent to the DC reporting about the event. However, sending updates to the DC on every event is not scalable. To deal with this, each router maintains a local Data Store, which stores time and ordering information of each packet per OD (Origin router-Destination router) flow (i.e., per ingress-egress router pair) in an Update Log. It then performs aggregation (shown in Section V-A and V-B) on that metadata, which is sent (via the Data Manager component) to the DC periodically. Data Store also keeps an Event Log that stores additional information about changes (e.g., changes in access control list or router configuration) in router’s state. This information is also sent to the DC periodically. The DC correlates the information of Update Log and Event Log for proper reasoning of anomalies at routers. Data Manager: The Data Manager is responsible for updating the Data Store and periodically sending reports to the DC. If updated too quickly, update overhead may be too high, whereas slow updates may increase event detection time in the network. Data Manager controls the rate at which updates are sent to the DC in two ways: a minimum update interval µ, and
a maximum number of events y that can be sent as a single batch to the DC. If events occur at a rate r, the Data Manager will not send updates at a rate faster than max(1/µ, r/y). y acts as a safety valve to ensure that router memory does not get exhausted when there is a sudden burst of packets. This also prevents any sort of Denial of Service (DoS) attacks on router memory due to the use of RESCUE. In order to handle router failures, the Data Manager periodically refreshes a backup copy of the recent in-memory Update Log by making use of router’s NVRAM (Non-Volatile Random Access Memory). The rate of this backup task is higher than the log update rate to the DC. Use of NVRAM enhances reliability of RESCUE as all the packets that have been observed by a router and saved in its NVRAM will eventually be reported to the DC once the router recovers after a failure event.
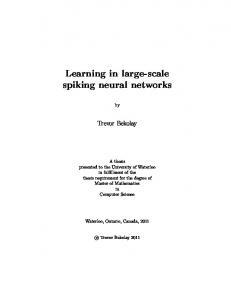
A. Log Aggregation Existing traffic monitoring schemes (e.g., [5], [6], [24], [25], [26], and their variants) reduce the amount of log stored at a router by keeping per-flow state. As our objective is to deal with recording data-plane events inside the network, compression can be done by keeping state per ingress-egress pair (IEP) of routers. States are compressed by aggregating information of packets belonging to a particular IEP into a single virtual packet. Each virtual packet is associated with a unique IEP value, called Virtual ID (VID). Details of virtual packet and VID are explained later in this section. A simple example given in Figure 2 shows that NetFlow creates 4 records for 5 packets traversing a router whereas IEP/virtual packet based compression saves space by storing only 2 virtual packets. RESCUE: IEP/virtual packet based state at router P X, Y virtual packet record
ISP1
B. Domain Controller
C
The Domain Controller (DC) provides a central point of control where network operators can interact with the monitoring facility. The DC maintains monitoring sessions with routers, where metadata information is received over a reliable channel. The DC stores this metadata for offline analysis. It also performs further aggregation (shown in Section V-C) on the metadata, by removing redundant observations across routers, and optionally discarding information for packets that were processed “correctly” (e.g., no anomalous event was triggered). We assume that the DC has complete knowledge of link delays between routers and learns about the network topology by tracking routing protocol updates such as OSPF updates [7]. To distribute load and improve resilience to failures, our design is amenable to hierarchical and replicated deployment. In particular, a separate DC could be assigned per logical group of routers within the network where each DC is responsible for collecting traces from its own group. Before analysis, logs from all the DCs need to be aggregated. In a similar manner, multiple DCs may be assigned per logical group of routers. We do this by replicating router feeds to each of the DCs. When one DC goes offline and comes back up, it selects another DC within the group, and downloads that DC’s log to resynchronize itself. In addition to this, our design is also amenable to other widely used techniques (e.g., the technique presented in [21]) for load balancing and service replication.
B
V. PACKET M ETADATA C OMPRESSION AND S TORAGE In Section V-A, we show our basic algorithm and data structure for logging packet-level history via aggregation. The na¨ıve way of aggregating packets can lose information about the ordering of packets within the sequence. To address this, we provide a modification to our algorithm in Section V-B. Section V-C describes the storage facility at the DC and how routers reliably send updates to the DC. Finally we show the analytical computation of the memory requirement at routers in Section V-D.
R, S
S2
S
X
P R
ISP2 A
ISP3
virtual packet record
Y
S1
A, S2 flow record B, S2 flow record C, S1
flow record
C, S2
flow record
NetFlow: flow based state at router p
Fig. 2. An example demonstrating the difference in log sizes under RESCUE and NetFlow. P, R, S, X and Y are routers.
When a router receives a packet or forwards it, it reports the packet arrival and its forwarding information to the DC. To make it scalable, RESCUE collects metadata about groups of packets, and sends that group to the DC periodically. In particular, this metadata is expressed in the form of a virtual packet. Each virtual packet contains the metadata of certain number of real packets with the same ingress and egress router pair. We assign each virtual packet a virtual packet id (VID), which is computed as a combination of the ingress and egress router IDs. The ingress router assigns a sequence number or packet id (PID) to each packet when it first enters into the network. The PID is locally unique to a router for each VID and increases monotonically. The VID and PID pair can uniquely identify a packet inside the network. Each packet stores its VID and PID pair in a small shim header. As packets of the same VID are expected to follow the same path in the network, intermediate routers in the path are likely to observe consecutive PIDs of the same VID. To allow multiple data packets to be aggregated into a single virtual packet, we must discard information that is different across them. Ideally, we would like to discard only information irrelevant to our troubleshooting and performance analysis goals. Examples of such information are data packet payloads and fine-grained timing information (since highly precise timing information about packets within a single flow is not necessary to understand most performance criteria, as we show in the results section). To control the amount of discarded timing information, RESCUE provides a tunable timestamp granularity (TSG) parameter. The TSG signifies the minimum granularity on which different data packet receipt times are distinguished. When a timestamp (e.g., T Ss ) is generated
for a packet belonging to a certain VID value (say vid), all packets having the same VID and arriving within the next TSG time will be assigned the same timestamp range [T Ss , T Se ], where T Se is the timestamp of the last packet arrived in the interval [T Ss , T Ss +T SG]. Thus, each virtual packet contains its VID and a sequence of PIDs along with their timestamp ranges since the last update was sent to the DC. In order to reduce packet size, instead of storing the PIDs for every packet in the virtual packet, we only store the lower bound (lb) and upper bound (ub) of PIDs belonging to the same timestamp range. The virtual packet format hence takes the form: [vidi , < (T Sijs , T Sije )[lbijk , ubijk ] >] for i, j, k ≥ 0. When a data packet arrives at the router, we need to quickly look up its VID and PID values. Here, we use a tree-based data structure (tree-based data structures in fast memory are used in modern routers to perform high speed lookups for data packet forwarding [16]) in the Update Log. The starting point in this data structure is the root (∆), followed by the second level containing VID nodes (αvid ) each storing a unique value vid. Each VID node can have multiple timestamp nodes (βTs ,Te ) as its children with start timestamp value Ts (= T Ss ) and end timestamp value Te (= T Se ) where (Te − Ts < T SG). The lowest level (leaves) of this tree structure contains PID nodes (δpl ,pu ) storing lower value pl (= lb) and upper value pu (= ub) of consecutive PIDs that were received during the time period of the immediate parent timestamp node. Note that, in case of packet loss, the ordering of packets for a single VID may not be sequential. In this case, one timestamp node contains multiple leaf nodes. p
f
a
u
s
d
b
t
q
e
g
c
r
v
Fig. 3. Example with two OD flows; one corresponds to VID = au and the other corresponds to VID = bv.
Δ α( β(
δ(
)
)
)
(a)
(b)
Fig. 4. (a) Tree-based data structure for log storage, (b) Incorporating information of packet ordering.
Here we provide an example of the above algorithm. Let us consider the topology of a network as shown in Figure 3, with two VID values au and bv. Packets of VID value au traverse the router-level path a → d → q → s → u while packets with VID value bv traverse b → e → g → q → r → t → v. Table II shows the ordering sequence of packets arriving at router q based on their actual time of arrival. For simplicity, we assume that all packets at each row arrive at the same physical time (according to the local clock granularity of the router). Let us also assume that TSG value is 10ms at router
q, and the link d − q fails at actual time T4 = 8ms that affects only the packets having VID value au, and recovers at time T5 = 10ms. Packets 16 and 17 having VID value au are lost due to this link failure before arriving at router q. From Table II, (T3 − T1 ) < 10ms, (T5 − T1 ) < 10ms, (T4 − T2 ) < 10ms and (T8 − T7 ) < 10ms. Hence, we can merge T1 , T3 and T5 into one timestamp range T1→5 = [2, 10] at timestamp node β2,10 . Similarly T2→4 = [6, 8] and T7→8 = [17, 20], and they are put at timestamp nodes β6,8 and β17,20 respectively in the tree structure. The resulting tree is shown in Figure 4(a). Note that packets 16 and 17 are lost, and hence the node T1→5 in Figure 4(a) must store two separate leaves, one for the PID range [1, 15] and another for [18, 26]. TABLE II E XAMPLE : P UTTING INCOMING PACKETS AT ROUTER q UNDER DIFFERENT TIMESTAMP NODES (βTs ,Te ) VID au bv au bv au bv au au
Packet sequence 1 → 10 1 → 12 11 → 15 13 → 25 18 → 26 26 → 40 27 → 36 37 → 41
Actual time of arrival T1 = 2ms T2 = 5ms T3 = 6ms T4 = 8ms T5 = 10ms T6 = 16ms T7 = 17ms T8 = 20ms
Assigned timestamp [t1 , t2 ] T1→5 T2→4 T1→5 T2→4 T1→5 T6→6 T7→8 T7→8
= [2, 10] ∈ β2,10 = [5, 8] ∈ β5,8 = [2, 10] ∈ β2,10 = [5, 8] ∈ β5,8 = [2, 10] ∈ β2,10 = [16, 16] ∈ β16,16 = [17, 20] ∈ β17,20 = [17, 20] ∈ β17,20
B. Pattern Logging It is desirable to gain information about the particular sequence and ordering information of data traffic traversing a router. This can shed light on the performance of particular queuing or packet processing schemes (e.g., performance of route caching mechanisms [16]), bandwidth allocation and forwarding across routers, and the underlying sources of resource contention. We extend our tree-based algorithm to keep track of this information by detecting patterns of packet arrivals, and storing them with low space requirement. For example (following the previous example described in Figure 4), let us assume that the ordering sequence of packet arrival for the last two entries in Table II is 27, 28, 37, 29, 30, 38, 31, 32, 39, 33, 34, 40, 35, 36, 41. We refer to this pattern as an interleaving-based pattern, as a sequential ordering of earlier PIDs is embedded within an ordered sequence of later PIDs. Moreover, this interleaving pattern is deterministic and regular, and hence it can be simply captured by storing the two PID ranges, the PIDs where they start being interleaved, and some concise information about the pattern of how they are interleaved. For example, in the aforementioned packet stream, there is a 2 : 1 pattern between the sequence of PIDs, i.e., (27 to 36) and (37 to 41). We extend the tree-based data structure described earlier to store these packet arrival patterns in a compact way with low lookup overhead. At each leaf node of the tree, we specify two node variables: next pattern and pattern length. If δp1 ,p2 and δp3 ,p4 are the ith and j th child of the same parent and they have interleave pattern of PIDs of ratio m:n, then δp1 ,p2 .next pattern and δp3 ,p4 .next pattern variables point to j and i respectively, and δp1 ,p2 .pattern length and δp3 ,p4 .pattern length are set to m and n likewise. Using similar approach, we can associate pattern information for higher
number of PID nodes. The corresponding parent timestamp node (βTs ,Te ) keeps a last update index variable that is the index of the last updated leaf under this timestamp node. Every time there is a break/gap in the PID sequence, we create a new leaf node and update the next pattern and pattern length variables of the last updated leaf node. If the pattern persists, these two variables will not change over time, and only the upper bound of the leaf node needs to be updated. In the last example, if this pattern-recording procedure is enabled, then the sub-tree corresponding to the last two rows of Table II will be as shown in Figure 4(b). A similar approach may be used to merge patterns across VIDs. To validate this approach, we conduct some simple experiments with a 3Com [27] Gigabit Switch with eight 1 Gbit ports. We set up an experiment where we inject packet flows on different input ports, and study the sequence of arrival patterns exiting the switch. We find that all flows exiting the switch can be characterized as interleaving-based patterns. As a quick sanitycheck, we also validate this effect using the ns-2 [28] network simulator. C. Log Storage at the DC Routers typically do not have sufficient storage to store logs for an extended period of time and hence need to periodically send updates to the Domain Controller reporting the current set of virtual packets. Reliable delivery of these updates need to be ensured as loss of updates may affect future analysis activities. The DC must be prepared to handle loss of packet metadata information due to router failure and be ready to track packet traversal information even in the presence of missing updates. In this section, we first describe the way updates are reported reliably and stored at the DC. We then discuss how the routers and the DC deal with loss of packet metadata information due to router failure. Next, we show compression across updates at the DC. Reliable delivery and storage: In order to ensure reliable delivery of updates, routers maintain dedicated TCP connections with the DC to send these updates. It ensures that updates are received in order and they do not get lost while in transit due to intermediate device or link failure. As mentioned earlier, there are two types of updates that each router generates. The first type tracks all the packets received by a router (received packet update, or RPU) and the second type tracks those packets that have been successfully processed and whose outgoing link have been determined (processed packet update, or PPU). We assume that the DC is equipped with large storage facility. At the DC, there are two log files for each router that records raw updates (i.e., serialized version of the tree-based structure maintained by the routers) coming from a particular router. The first log records RPU and the second records PPU. Handling router failure: In case of a router failure, the DC will not receive any update from the failed router till it recovers. After recovery, the router checks its NVRAM to figure out if there exists any partial log that was not sent to the DC due to the failure. If one exists, then the router immediately sends that partial log to the DC and resumes its normal operation. Now, the router may have been in the
midst of processing some packets and updating the tree-based log structure before the failure event. Some parts of the log may not have been saved in NVRAM. Due to the failure, the router will lose all its unsaved logs present in its memory and there will be a gap in the log reported to the DC when the router recovers. This will affect the path determination task as it is not possible to deduce which set of packets were actually processed by the router just before it failed. However, by consulting the logs of its neighbor routers, it is possible to have a rough idea about the packets that were being processed by the router and whose information was not sent to the DC because of the failure. Compression across updates: We do further compression across individual routers’ updates. Instead of storing timing information of a single packet multiple times for each individual router traversed by that packet, the DC can store all the same PIDs (of same VID) reported within a specific time interval (T SGDC ) by multiple routers under one timestamp node (βTs ,Te ), where (Te − Ts ) ≤ T SGDC . To support this, each timestamp node needs to store the number of routers whose updates are compressed. Using such structure, the DC can reconstruct individual updates reported by those routers at some granularity of time, as coarse grained path information and latency between the routers are available at the DC [21]. Although this approach loses timing precision, it still keeps ordering information of packets intact and reduces memory requirement at the DC. D. Memory Requirement at Routers Here we present the theoretical analysis of required memory at routers. Let us assume that the mean packet inter-arrival time is λ and the number of unique VIDs received per second by a router is ν. In practice ν