1937
The Journal of Experimental Biology 203, 1937–1946 (2000) Printed in Great Britain © The Company of Biologists Limited 2000 JEB2781
ALLOMETRIC SCALING RELATIONSHIPS OF JUMPING PERFORMANCE IN THE STRIPED MARSH FROG LIMNODYNASTES PERONII ROBBIE S. WILSON1,*, CRAIG E. FRANKLIN1 AND ROB S. JAMES2 Ecology Laboratory, Department of Zoology, The University of Queensland, St Lucia, QLD 4072, Australia and 2School of Natural and Environmental Sciences, Coventry University, Priory Street, Coventry CV1 5FB, UK
1Physiological
*e-mail:
[email protected]
Accepted 29 March; published on WWW 23 May 2000 Summary thus more closely resembled Hill’s model for the scaling We constructed a force platform to investigate the of locomotion. We also examined the scaling relationships scaling relationships of the detailed dynamics of jumping of jumping performance in metamorph L. peronii by performance in striped marsh frogs (Limnodynastes recording the maximum jump distance of 39 animals peronii). Data were used to test between two alternative weighing between 0.19 and 0.58 g. In contrast to the models that describe the scaling of anuran jumping post-metamorphic L. peronii, DJ and Umax were highly performance; Hill’s model, which predicts massdependent on body mass in metamorphs and were independence of jump distance, and Marsh’s model, described by the equations DJ=38M0.53 and which predicts that jump distance increases as M0.2, where M is body mass. From the force platform, scaling Umax=1.82M0.23, respectively. Neither model for the relationships were calculated for maximum jumping force scaling of anuran jumping performance resembled data (Fmax), acceleration, take-off velocity (Umax), massfrom metamorph L. peronii. Although the hindlimbs of specific jumping power (Pmax), total jumping distance post-metamorphic L. peronii scaled geometrically (body (DJ) and total contact time for 75 L. peronii weighing mass exponent approximately 0.33), the hindlimbs of between 2.9 and 38.4 g. Fmax was positively correlated metamorphs showed greater proportional increases with with body mass and was described by the equation body mass (mass exponents of 0.41–0.42). Fmax=0.16M0.61, while Pmax decreased significantly with body mass and was described by the equation Pmax=347M−0.46. Both DJ and Umax were massKey words: scaling, jumping performance, allometry, power, striped marsh frog, Limnodynastes peronii. independent over the post-metamorph size range, and
Introduction Hill (1950) predicted that geometrically similar animals should run at the same speed and jump the same distance regardless of body size. However, because of the effects of not only body shape but also phylogenetic differences, the scaling relationships of locomotor performance for most terrestrial vertebrates are highly varied (Emerson, 1978; Huey and Hertz, 1982; Garland, 1983, 1984) and do not allow an adequate test of Hill’s prediction. Because body shape is very conservative within the anurans and they appear to scale geometrically (Emerson, 1978; Marsh, 1994), they offer an ideal system for testing Hill’s (1950) prediction. In contrast to Hill’s (1950) model, Marsh (1994) suggested that, when our existing knowledge of anuran allometry and muscle contractile properties is considered, the jumping distance of anurans should not be expected to be mass-independent but rather scale to M0.2, where M is body mass. Marsh (1994) attributes the differences between the two models to Hill’s (1950) assumption that the intrinsic shortening velocity of hindlimb muscle scales as M−0.33,
while the empirically derived scaling relationship scales as M−0.1. From the available data on the scaling of anuran jumping performance, it appears that the scaling relationships more closely resemble the predictions outlined by Marsh (1994) and do not support Hill’s (1950) prediction for the massindependence of jump distance. Maximum jump distance scales interspecifically with an average mass exponent of 0.20 (Emerson, 1978; Zug, 1978; for a review, see Marsh, 1994). Intraspecific analyses report that jump distance scales with a mass exponent of between 0.18 and 0.36 (Rand and Rand, 1966; Emerson, 1978; Miller et al., 1993), with an even greater mass exponent for metamorphs (between 0.41 and 0.69) (JohnAlder and Morin, 1990). However, several factors require that we do not reject Hill’s (1950) model on the strength of these analyses alone. First, many of these intraspecific analyses used both metamorph and post-metamorph animals to derive scaling relationships even though metamorph animals appear to scale
1938 R. S. WILSON, C. E. FRANKLIN AND R. S. JAMES differently from post-metamorph animals and bias scaling relationships towards higher mass exponents (Emerson, 1978; John-Alder and Morin, 1990). Moreover, only jump distance has been recorded and used to test between the two models of anuran jumping performance. Several other variables describing jumping performance should also vary predictably with body mass, such as maximum jumping acceleration and take-off velocity, and could be recorded and used to test between the two alternative models of scaling in anurans. Finally, several of the scaling analyses were only based on small sample sizes over a limited range of body sizes. Clearly, an intraspecific scaling analysis of jumping performance using a wide range of body sizes, and with the separate analyses of metamorph and post-metamorph animals, should be used to test between the two models of anuran jumping performance. In this study, we used a force platform to investigate the allometric scaling relationships of jumping performance in post-metamorphic striped marsh frogs (Limnodynastes peronii) over a tenfold increase in body mass. A customdesigned force platform allowed the determination of the ground reaction forces of a jumping frog in all three dimensions of movement and the scaling relationships of maximal jumping force, acceleration, take-off velocity, jump distance, contact time on the ground and maximal instantaneous power output to be determined. Scaling relationships of metamorph L. peronii jumping were also investigated and compared with those of the post-metamorphic animals by recording their total jump distance over a sixfold increase in body mass. Both metamorph and post-metamorph relationships were used to test between Hill’s (1950) and Marsh’s (1994) models for the scaling of anuran jumping performance. Materials and methods Striped marsh frogs (Limnodynastes peronii) (Duméril and Bibron) of various sizes were collected from Melbourne and
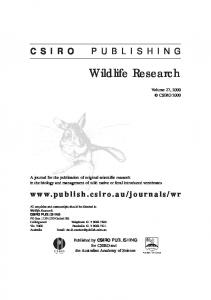
Boolarra, Victoria, Australia, during September 1996. The jumping performance of all frogs was assessed within at least 2 days of collection, after which they were released at their point of capture. Twelve L. peronii adults were collected in Brisbane and transported to the University of St Andrews, Scotland, UK, where a high-speed cine camera was used to validate the force platform experimentally. To examine the jumping performance of metamorph L. peronii, three foam nests were collected from Boolarra, Victoria, during January 1998 and placed in a 25 °C constant temperature room at The University of Queensland. The larvae were fed ad libitum on boiled lettuce until metamorphosis occurred. Jumping performance of the metamorphs was then assessed on the day after their tail had been completely resorbed. The force platform A custom-built force platform was constructed simultaneously to measure the vertical, horizontal and lateral ground reaction forces of a jumping frog (Fig. 1). The design of the force platform was based on that outlined by Katz and Gosline (1993) for measuring jumping performance in locusts. The platform consisted of a circular piece of balsawood (diameter 10.5 cm, width 8 mm) mounted on an L-shaped 10 mm×10 mm double-cantilever brass beam fixed to a solid wooden base. A sheet of sandpaper was attached to the surface of the platform to prevent the frogs from slipping during takeoff. Three spring blades were cut from the brass supporting beams by machining 10 mm×8.8 mm holes at different orientations at 90 ° to each other, leaving only a wall thickness of 0.6 mm along each side of the 10 mm long spring blades. To detect changes in force in the three dimensions, 5 mm aluminium foil strain gauges were attached to the outer side of each spring blade. Each strain gauge, which corresponded to a separate dimension, formed a quarter of a bridge circuit that fed a signal directly into a Maclab bridge amplifier. Data were collected by a Maclab data-acquisition system which recorded at a sampling frequency of 1000 Hz. Data were recorded in the Sandpaper surface
Balsawood platform Vertical strain gauge
Fig. 1. Illustration of the force platform used to measure the ground reaction forces of striped marsh frogs (Limnodynastes peronii) during jumping. The diagram shows the three strain gauges (representing each dimension) that measured the force applied to the surface of the platform by a jumping frog.
Machined hole in brass beam Lateral strain gauge
Horizontal strain gauge
Scaling of frog jumping performance 1939 Maclab version 3.5 software package using the accompanying Chart version 3.5.1 system with a 20 Hz low-frequency pass. Mechanical crosstalk between the different dimensions was less than 5 % within the force range associated with this experiment and was not corrected for. Serial calibrations of the platform were conducted by placing known masses onto the platform at different orientations and applying known forces in each plane with the relationship between gravitational force and voltage output determined (vertical dimension 68.0 mV N−1, both horizontal/lateral dimensions 44.8 mV N−1). Experimental validation of the force platform using highspeed cinematography To validate experimentally the data obtained from the force platform, four L. peronii jumps were simultaneously assessed with high-speed cinematography and the force platform. Highspeed cinematography has been used extensively in studies of fish and frog locomotion (Marsh and John-Alder, 1994; Temple and Johnston, 1998) and is considered an accurate method of measuring locomotor performance. Several jumping sequences were filmed with a 16 mm NAC E-10 high-speed cine camera at 500 frames s−1, with four usable sequences analysed. Framing speeds for each sequence were verified by using timing marks that recorded at 100 Hz on the edge of the film. Three 400 W light sources supplied adequate illumination for filming. The camera was positioned to film a side-on view of a frog on the force platform from a distance of 2.5 m, which allowed movement in the vertical and horizontal directions to be filmed. Lateral movements were filmed by suspending a mirror at an angle of 45 ° behind the platform. Frogs were encouraged to jump off the platform by gently touching the urostyle with a pair of forceps whilst simultaneously filming and recording force platform output. The body temperature of the frogs was kept at 24 °C during experiments by holding them in a temperature-controlled water bath for at least 1 h before jumping and maintaining the room temperature between 20 and 25 °C. Film was developed ‘open trap’ and then viewed and analysed using a motion-analysis system (MOVIAS, NAC, Japan). The position of the approximate centre of mass (near the centre of the coccyx; Marsh and John-Alder, 1994) in all three dimensions was digitised to determine the distance moved whilst on the platform. Four useable cine film sequences of frog jumps were analysed to determine take-off velocity, maximum acceleration and contact time. These cine film data were directly compared with values calculated from the force platform. Distance data were fitted with a sixth-order polynomial function to provide a smoothed curve from which velocity and acceleration could be calculated by differentiation. For each filmed frog jump, take-off velocity was estimated by taking the average of three velocity values centred on the frame at which take-off occurred. Maximum acceleration was estimated by using a moving average of three datum points over a period of 4 ms. Contact time was defined as the time at which movement was first detected until the point at which both feet left the platform.
Analysis of force-platform data The three recorded signals were analysed separately to determine the ground reaction forces produced during each jump for each dimension. The lateral (FL) and horizontal (FH) forces were then summed via vector analysis to represent a single force trace in the horizontal dimension (Fhl). To determine the total force (Fsum) applied to the ground during jumping, the vertical (Fv) and horizontal forces (Fhl) were then summed via vector analysis. The maximum force produced was estimated by using a moving average of three consecutive datum points over a period of 2 ms. To determine instantaneous lateral (AL) and horizontal (AH) acceleration, force values in the lateral (FL) and horizontal dimensions (FH) were divided by body mass (M) according to: AH = FH/M ,
(1)
AL = FL/M .
(2)
Acceleration in the vertical dimension (AV) was calculated as: AV = (FV − Mg)/M ,
(3)
where g is the acceleration due to gravity (in m s−2). Acceleration data were then used to calculate velocity by numerical integration, while the distance travelled by the centre of mass was calculated by numerical integration of the velocity data. Instantaneous power development (P) during a jump was calculated from the equation derived by Hirano and Rome (1984): P = MgVv + 0.5M[V2t − V2(t − 0.001)]/0.001 ,
(4)
where Vv is instantaneous velocity in the vertical dimension, and V is the instantaneous vector sum of velocity. Contact time (TC) during a jump was taken as the total time from when a jump began (i.e. after acceleration increased for three consecutive readings) until the time when the vector sum of acceleration in all dimensions returned to zero. The total jump distance (DJ) of the frogs was estimated as: DJ = [(Vhl × 2 × Vv)/9.8] + Dhl ,
(5)
where Dhl is the horizontal distance moved by the frog before take-off and Vhl is the vertical distance moved by the frog before take-off. To estimate the muscle-mass-specific jumping power of L. peronii during maximal jumps, the hindlimb muscle mass as a proportion of total body mass was determined for four animals collected from Brisbane, Australia. Frogs were killed by a blow to the head, pithing and transection of the spinal cord. The hindlimb muscles were dissected away from the limbs, and total body mass and hindlimb muscle mass were determined on an A200S Sartorius analytical balance (±0.01 g). Scaling relationships of jumping performance The maximum jumping performance of 75 postmetamorphic L. peronii was assessed at 24 °C using the customdesigned force platform that measured the ground reaction forces of a jumping frog in three dimensions. As these frogs
1940 R. S. WILSON, C. E. FRANKLIN AND R. S. JAMES included adult and sub-adult animals, they were referred to as post-metamophic frogs, which we defined as frogs that had not metamorphosed within the last few weeks before capture. We defined metamorph frogs in this study as those that had completely absorbed their tail within the last week. Jumps were elicited by pinching the urostyle with a pair of fine forceps, taking care to avoid applying forces to the platform. Each individual was stimulated to jump at least five times, with the jump that produced the greatest ground reaction force for each individual used as a measure of maximum jumping performance. The body temperature of the frogs was maintained at 24 °C for at least 3 h prior to experimental procedures by holding them in a shallow temperature-controlled water bath. The air temperature was maintained between 20 and 25 °C at all times, and the body temperature of the frogs did not change significantly during the jumping procedure. The body temperature of the frogs was determined by inserting a calibrated thermometer probe (±0.1 °C) into the cloaca. As the resolution of the force platform did not allow the collection of useful data for metamorph jumps, only maximum jump distance was recorded for these animals. Each metamorph was encouraged to jump along a wooden bench by lightly touching its urostyle. The ventral surface of the metamorph frogs was kept wet at all times, allowing their jump distance to be recorded by measuring the distance between damp marks left on the wooden bench by the frogs. At least five jumps from each individual were recorded, and the longest jump for each individual was used as a measure of maximum jumping distance. At the end of the jumping protocol, morphological measurements were taken for individual post-metamorphs and metamorphs. Snout-to-vent length (LSV), femur (vent-to-knee length) (LF) and tibia length (knee-to-ankle length) (LT) were measured with Mitutoyo calipers to the nearest 0.2 mm. Mass was measured with an A200S Sartorius analytical balance (±0.01 g).
of equations outlined by Marsh (1994). Calculations were based on the assumption that the angle of take-off to the horizontal was 45 °, a value close to the optimum angle of take-off. The position of the centre of mass at take-off was also assumed to have moved 1.2 times the length of the outstretched hindlimbs (Marsh, 1994). Average acceleration was calculated using the standard trajectory formulae outlined by Alexander (1968). Statistical analyses Allometric scaling relationships were expressed in the form y=aMb, where M is body mass, a is the proportionality coefficient and b is the mass exponent. The equations were calculated using log-transformed data and least-squares regression techniques. Data collected from the high-speed cine film and the force platform were compared using Student’s ttests. All results are presented as means ± S.E.M. Significance was taken at the level P0.05).
Scaling of frog jumping performance 1941 1.6
1.6
A
Fmax (N)
Force (N)
1.2 0.8 0.4
0
20
40
60
80
100
0.4
120 0.1
B
60
2
120 100 80
40 20 0
20
40
60
80
100
120
C
160
Amax (m s-2)
Acceleration (m s-2)
80
Power output (W kg-1)
Fmax = 0.16M0.61
0.6
0.2
0
0
A
1
4
10
20
40
B Amax = 166M−0.40
60 40
20
120
2
4
10
80
20
40
Mass (g)
40 0 0
20
40
60
80
100
120
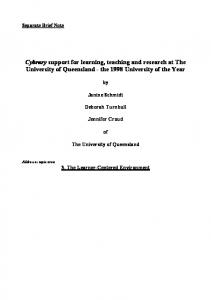
Time (ms) Fig. 2. Changes in (A) force, (B) acceleration and (C) instantaneous body-mass-specific power output during a typical maximal jump for three frogs of differing body mass at 24 °C measured with the force platform recording at 1000 Hz. Dotted, solid and dashed lines represent frogs of body mass 4.3, 12.8 and 30.8 g, respectively.
in a peak ground reaction force after half to two-thirds of the total contact time and then a sharp decay of force to take-off (Fig. 2A). The entire jumping event was completed in a short time: the time from initial acceleration until take-off was
Fig. 3. Relationship between body mass (M) and (A) maximum jumping force (Fmax) and (B) maximum jumping acceleration (Amax) for post-metamorphic striped marsh frogs (Limnodynastes peronii) weighing between 2.9 and 38.4 g recorded with a force platform at 1000 Hz.
between 60 and 130 ms. Positive acceleration occurred throughout the entire phase of contact with the platform (Fig. 2B) and resulted in a maximum velocity at the instant of take-off. Instantaneous jumping power usually took longer to develop than force, with maximum power attained after approximately three-quarters of the total contact time (Fig. 2C). Allometric scaling relationships were calculated for maximum jumping force (Fmax), acceleration (Amax), take-off velocity (Umax), mass-specific jumping power (Pmax), total
Table 2. Relationships between body mass and various parameters of jumping performance in post-metamorphic striped marsh frogs (Limnodynastes peronii) Maximum force (Fmax) Maximum acceleration (Amax) Contact time (TC) Take-off velocity (Umax) Jump distance (DJ) Maximum instantaneous power (Pmax)
N m s−2 ms m s−1 cm W kg−1 body mass
loga
b
r2
P
−0.79±0.03 2.22±0.03 −1.28±0.03 0.45±0.04 −0.14±0.07 2.54±0.07
0.61±0.03 −0.40±0.03 0.22±0.02 −0.07±0.04 0.06±0.07 −0.46±0.06
0.86 0.73 0.56 0.05 0.01 0.44