sensors Article
Scan Line Based Road Marking Extraction from Mobile LiDAR Point Clouds † Li Yan, Hua Liu, Junxiang Tan, Zan Li, Hong Xie and Changjun Chen * School of Geodesy and Geomatics, Wuhan University, Wuhan 430079, China;
[email protected] (L.Y.);
[email protected] (H.L.);
[email protected] (J.T.);
[email protected] (Z.L.);
[email protected] (H.X.) * Correspondence:
[email protected]; Tel.: +86-186-0272-6955 † This paper is an extended version of the paper entitled “Automated Road Markings Extraction from Mobile LiDAR Data”, presented at MMT 2015, 9–11 December 2015, Sydney, Australia. Academic Editor: Assefa Melesse Received: 23 March 2016; Accepted: 13 June 2016; Published: 17 June 2016
Abstract: Mobile Mapping Technology (MMT) is one of the most important 3D spatial data acquisition technologies. The state-of-the-art mobile mapping systems, equipped with laser scanners and named Mobile LiDAR Scanning (MLS) systems, have been widely used in a variety of areas, especially in road mapping and road inventory. With the commercialization of Advanced Driving Assistance Systems (ADASs) and self-driving technology, there will be a great demand for lane-level detailed 3D maps, and MLS is the most promising technology to generate such lane-level detailed 3D maps. Road markings and road edges are necessary information in creating such lane-level detailed 3D maps. This paper proposes a scan line based method to extract road markings from mobile LiDAR point clouds in three steps: (1) preprocessing; (2) road points extraction; (3) road markings extraction and refinement. In preprocessing step, the isolated LiDAR points in the air are removed from the LiDAR point clouds and the point clouds are organized into scan lines. In the road points extraction step, seed road points are first extracted by Height Difference (HD) between trajectory data and road surface, then full road points are extracted from the point clouds by moving least squares line fitting. In the road markings extraction and refinement step, the intensity values of road points in a scan line are first smoothed by a dynamic window median filter to suppress intensity noises, then road markings are extracted by Edge Detection and Edge Constraint (EDEC) method, and the Fake Road Marking Points (FRMPs) are eliminated from the detected road markings by segment and dimensionality feature-based refinement. The performance of the proposed method is evaluated by three data samples and the experiment results indicate that road points are well extracted from MLS data and road markings are well extracted from road points by the applied method. A quantitative study shows that the proposed method achieves an average completeness, correctness, and F-measure of 0.96, 0.93, and 0.94, respectively. The time complexity analysis shows that the scan line based road markings extraction method proposed in this paper provides a promising alternative for offline road markings extraction from MLS data. Keywords: mobile LiDAR scanning; point clouds; scan line; road points extraction; road markings extraction
1. Introduction Mobile Mapping Technology (MMT) emerged during the nineties in the twentieth century inspired by the availability of GPS technology for civilian uses. The world’s first mobile mapping system, named as GPSVan, which integrated a Code-Only GPS receiver, two CCD cameras, two video cameras and multiple dead reckoning sensors on a van, was integrated by Ohio State University in 1991 [1,2].
Sensors 2016, 16, 903; doi:10.3390/s16060903
www.mdpi.com/journal/sensors
Sensors 2016, 16, 903
2 of 21
Later, The University of Calgary implemented the VISAT system including a dual-frequency carrier differential receiver and Inertial Measurement Unit (IMU) instead of the Code-Only GPS receiver and dead reckoning sensors, CCD cameras were also used in the VISAT system [3,4]. Similar systems were developed and reported in KiSS [5], GPSVision [6] and GI-EYE™ [7]. Since 2000, the main mapping sensors used in mobile mapping systems have been switched from cameras to laser range finders or laser scanners [8]. The mobile mapping systems equipped with mobile laser scanners are named Mobile LiDAR Scanning (MLS) systems, and most of the newly developed systems belong to this type. MLS has been used in a variety of applications. The most obvious applications are road mapping and road inventory [9–13], in which road information such as curbstones, basic structures of road, road markings and traffic signs are extracted from MLS data. In [14,15], mobile LiDAR systems are used in tunnel cross-section and road cross-section measurements. In [16–18], the usage of mobile LiDAR systems in fluvial studies are reported. In [19], the railway infrastructure is automatically recognized from MLS data. In [20–22], mobile LiDAR systems are used for large scale plot mapping and individual tree crown reconstruction in forest research. In [23,24], MLS data are used to detect street environment changes and street-side vehicles. Geo-spatial information is extracted from MLS data for crowd control planning in [25]. Among the applications of MLS mentioned above, the most important and most promising applications are road mapping and road inventory, especially with the commercialization of Advanced Driving Assistance Systems (ADASs) and self-driving technology. In ADAS and self-driving, lane-level detailed 3D maps are needed for route planning and navigation in which the traditional 2D digital maps such as Google Maps are no longer sufficient. The most promising technology to generate such large scale lane-level detailed 3D maps is mobile LiDAR technology for its efficiency, cost-effectiveness, high accuracy and high density of the acquired point clouds. To generate lane-level detailed 3D maps using mobile LiDAR point clouds, road markings and road edges should be extracted from the raw LiDAR point clouds. Road markings are generally made of high reflectivity material, so the intensity values of road marking points are theoretically higher than that of asphalt road surface points. Thus road markings can be distinguished from road points according to intensity information. However, the intensity values recorded by laser scanners are affected by target surface characteristics, acquisition geometry, instrumental effects and environmental effects [26]. In MLS, instrumental parameters, including the transmitted energy, the intensity bit depth and scaling, the amplifier for low reflective surfaces, the automation gain control, the brightness reducer for near distances and the aperture size, can be considered as constant, and the environmental parameters, including atmospheric transmittance and wetness, can be considered as constant in a scanning project, so the main parameters affecting the intensity values are target surface characteristics and acquisition geometry. As pointed out in [27], the incidence angle and scanning distance affect the intensity values of terrestrial laser scanning greatly. Thus the intensity values of road points vary not only because of different target characteristics (i.e., asphalted road surface and road markings), but also because of different scanning incidence angle and scanning distance, making it difficult to separate road marking points from road points. In order to extract road markings more efficiently and simplify the road marking points extraction algorithm, road points (including asphalted road surface points and road marking points) are first extracted from the raw LiDAR point clouds and then road markings are further extracted from the road points. In [28], road surface is segmented from the feature image generated by the raw 3D LiDAR points. In [29], road edges are extracted by combination of two modified versions of the parametric active contour model and road points can be extracted by the obtained road edges. In [30], road points are extracted by curbstone information on both sides of the road. In [15,31], road points are segmented from points in each scanner cycle by PCA analysis. There are two typical types of methods to extract road markings from mobile LiDAR point clouds. The first type of methods convert the point clouds into georeferenced images and image processing methods are then used to extract road markings from the georeferenced images. In [11], 2D
Sensors 2016, 16, 903
3 of 21
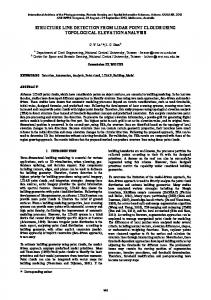
There are two typical types of methods to extract road markings from mobile LiDAR point clouds. The first type of methods convert the point clouds into georeferenced images and image processing methods are then used to extract road markings from the georeferenced images. In Sensors 2016, 16, 903 of 21 [11], 2D Georeferenced Feature (GRF) images are interpolated from the 3D road points3 by modified Inverse Distance Weight (IDW) interpolation, then Weighted Neighboring Difference Histogram is Feature used to (GRF) segment the GRF and Multi-Scale Tensor Votingby (MSTV) is used to Georeferenced images are images interpolated from the 3D road points modified Inverse extract road markings. In [30], geo-referenced intensity image is generated first by extended IDW Distance Weight (IDW) interpolation, then Weighted Neighboring Difference Histogram is used to method,the and then road markings are recognized by a point-density-dependent multi-threshold segment GRF images and Multi-Scale Tensor Voting (MSTV) is used to extract road markings. segmentation of the intensity image and refined by morphological closing operations. In [31], In [30], geo-referenced intensity image is generated first by extended IDW method, and thenroad road points are into using a nearest neighbor algorithm to assign intensity to a markings arerasterized recognized by images a point-density-dependent multi-threshold segmentation of thedata intensity regular then zebra crossings detected In by[31], Standard Houghare Transform image andmatrix, refinedand by morphological closingare operations. road points rasterizedfrom into edges images of the binary image. In [32], intensity curve fitting is used to reduce the variance of the using a nearest neighbor algorithm to assign intensity data to a regular matrix, and then zebraintensity crossings thenby intensity raster image is generated road markings extracted the raster arevalue, detected Standard Hough Transform from and edges of the binary are image. In [32],from intensity curve image by image processing method. In [33], candidate lane markings are localized in 3D by fitting is used to reduce the variance of the intensity value, then intensity raster image is generated and adaptive thresholding in scan then image 2D images are interpolated using the candidate road markings are extracted fromlines, the raster by image processing method. In3D [33], candidatelane lane markingare points and all candidate roadthresholding markings areindetected bythen Hough Transform clustering. markings localized in 3D by adaptive scan lines, 2D images are interpolated Finally, false detections are eliminated by trajectory constraints and geometry checks. The using the 3D candidate lane marking points and all candidate road markings are detected bysecond Hough type of methods extract road markings from 3D pointby clouds directly, which is much less Transform clustering. Finally, false detections arethe eliminated trajectory constraints and geometry reported until now. In [34], a method that extracts road marking points from 3D road points checks. The second type of methods extract road markings from the 3D point clouds directly, which is directly is reported. thisInmethod, road points are divided into multi-segments, and points road much less reported untilIn now. [34], a method that extracts road marking points from 3D road marking points areInextracted fromroad eachpoints segment by multi-thresholding methodand and refined by directly is reported. this method, are divided into multi-segments, road marking spatial density based filtering. points are extracted from each segment by multi-thresholding method and refined by spatial density Extracting road markings by converting 3D point clouds into 2D georeferenced images based filtering. simplifies theroad algorithms and mature processing algorithms can beimages used, simplifies but this Extracting markings bymany converting 3Dimage point clouds into 2D georeferenced method may lead to loss of high precision of the point clouds, and incompleteness the algorithms and many mature image processing algorithms can be used, but this method mayand lead incorrectness of some objects. Extracting road marking points from 3D point clouds directly has to loss of high precision of the point clouds, and incompleteness and incorrectness of some objects. seldom been This paper proposes a scan directly line-based to extract road This marking Extracting road reported. marking points from 3D point clouds hasmethod seldom been reported. paper points from 3D mobile LiDAR point clouds directly. The workflow of the method is illustrated in proposes a scan line-based method to extract road marking points from 3D mobile LiDAR point clouds Figure The 1. Inworkflow this method, themethod acquiredispoint cloudsinare first preprocessed to remove the isolated directly. of the illustrated Figure 1. In this method, the acquired point LiDAR points in the air and organized into scan lines, then the road points are extracted by clouds are first preprocessed to remove the isolated LiDAR points in the air and organized into scan moving least squares line fitting using the seed road points extracted by Height Difference (HD) lines, then the road points are extracted by moving least squares line fitting using the seed road points betweenbytrajectory data and road road marking points are extracted from scan extracted Height Difference (HD) surface. betweenFinally, trajectory data and road surface. Finally, road marking line points by Edge Detection and Edge Constraint (EDEC) method after intensity smoothing and points are extracted from scan line points by Edge Detection and Edge Constraint (EDEC) method Fake Road Marking Points (FRMPs) are eliminated by segment andare dimensionality based after intensity smoothing and Fake Road Marking Points (FRMPs) eliminated byfeature segment and refinement. dimensionality feature based refinement.
Raw Mobile LiDAR Data
Isolated LiDAR Points Removal
Mobile LiDAR Data
Scan line Separation
Mobile LiDAR Data in Scan lines
Trajectory Data
Road Points Extraction HD Estimation Seed Road Points Extraction Full Road Points Extraction
Road Points
Road Marking Points Extraction Intensity Data Smoothing Road Markings Detection Refinement
Road Marking Points
Figure Figure 1. 1. The The workflow workflow of of the the scan scan line-based line-based road road markings markings extraction extraction method. method.
This paper is structured as follows: Section 2 introduces our preprocessing methods including the method to remove isolated LiDAR points in the air from the raw LiDAR data and the approach to organize LiDAR point clouds into scan lines. In Section 3, the method to extract road points is addressed in detail and Section 4 focuses on the algorithms of road marking points extraction from
Sensors 2016, 16, 903 Sensors 2016, 16, 903
4 of 21 4 of 21
This paper is structured as follows: Section 2 introduces our preprocessing methods This paper is structured as follows: Section 2 introduces our preprocessing methods including the method to remove isolated LiDAR points in the air from the raw LiDAR data and including the method to remove isolated LiDAR points in the air from the raw LiDAR data and the approach to organize LiDAR point clouds into scan lines. In Section 3, the method to extract Sensors 2016, 16, 903 4 of 21 the approach to organize LiDAR point clouds into scan lines. In Section 3, the method to extract road points is addressed in detail and Section 4 focuses on the algorithms of road marking points road points is addressed in detail and Section 4 focuses on the algorithms of road marking points extraction from road points and FRMPs elimination. Experiments, results and discussion are extraction from road points and FRMPs elimination. Experiments, results and discussion are presented in Section 5.elimination. Finally, Conclusions are presented in Section 6. are presented in Section 5. road points and FRMPs Experiments, results and discussion presented in Section 5. Finally, Conclusions are presented in Section 6. Finally, Conclusions are presented in Section 6. 2. Preprocessing 2. Preprocessing 2. Preprocessing 2.1. Isolated LiDAR Points Removal 2.1. Isolated LiDAR Points Points Removal Removal 2.1. Isolated LiDAR The isolated LiDAR points in the air occurring in the scanned point clouds affect the The isolated isolatedLiDAR LiDARpoints points the air occurring inscanned the scanned point clouds affect the The in in theinformation air occurring in the point clouds affect the algorithms used to extract object from point clouds. Actions should be algorithms taken to algorithms used to extract object from information from point clouds. Actions should be taken to used to extract object information point clouds. Actions should be taken to remove or There reduce remove or reduce the isolated LiDAR points in the air before any subsequent operations. remove or reduce the isolated LiDAR points in the air before any subsequent operations. There the isolated LiDARfor points in the airLiDAR beforepoints any subsequent causes for the are many causes the isolated in the air, operations. and the dustThere in theare airmany is a case in point. are manyLiDAR causespoints for theinisolated LiDAR points inthe theair air,isand theindust in the air is a case inthe point. isolated the air, and the dust in a case point. No matter what No matter what the causes are, the intensity values of the isolated LiDAR points in the air arecauses low. No matter what the causes the intensity values of the isolated LiDAR points2inshows the airthe areintensity low. are, the intensity of are, the isolated LiDAR points in the air are low. Figure Figure 2 shows values the intensity histogram of some isolated LiDAR points manually labeled from a Figure 2 shows the isolated intensityLiDAR histogram of manually some isolated LiDAR points manually labeled from a the histogram of some points from a dataset, which indicates thatare dataset, which indicates that the intensity values oflabeled almost all isolated LiDAR points in the air dataset, which indicates that the intensity values of almost all isolated LiDAR points in the air are intensity values of almost isolated LiDAR pointsLiDAR in the air are less than may by be objects because less than 10. This may beall because that the isolated points in the air 10. are This reflected less than 10. ThisLiDAR may bepoints because that theare isolated LiDAR points with in thevery air are reflected by objects that the isolated in the air reflected by objects small diameter present with very small diameter present in the air. Due to the small diameter, a very small part of thein with very small diameter present ina the air. Duepart to the diameter, a very small leading part of the the air. Due toisthe small diameter, very small of small the laser energy reflected, to of the laser energy reflected, leading to the observed small intensity values. is Another characteristic laser energy is reflected, leading to the observed small intensity values. Another characteristic ofthat observed small intensity values. Another characteristic of the isolated LiDAR points in the air is the isolated LiDAR points in the air is that their scanning distance (the distance from object to the isolated LiDAR points the air is that their scanning distance (the distance from object to the their scanning (the in distance laser scanner) is obviously shorter of laser scanner)distance is obviously shorter from than object that oftothe previous scanned point and the than next that scanned laser scanner) is obviously shorter than that of the previous scanned point and the next scanned previous scanned point the 3. next scanned point, as illustrated in Figure 3. point, as illustrated inand Figure point, as illustrated in Figure 3. Number of Isolated Number LiDAR PointsofinIsolated the air LiDAR Points in the air
8000 8000 6000 6000 4000 4000 2000 2000 0 0
1 2 3 4 5 6 7 8 9 10 11 12 13 14 15 16 17 18 19 20 21 22 23 24 25 26 27 28 29 30 31 1 2 3 4 5 6 7 8 9 10 11 12 13 14 15 16 17 18 19 20 21 22 23 24 25 26 27 28 29 30 31
Intensity Value Intensity Value
Figure 2. The intensity histogram of manually classified isolated LiDAR points in the air. Figure The intensity histogram manually classified isolated LiDAR points the air. Figure 2. 2. The intensity histogram ofof manually classified isolated LiDAR points inin the air.
Laser scanner Laser scanner
Laser ray Laser ray Road surface Road surface
Laser scanner Laser scanner
Laser ray Laser ray Isolated point in the air Isolated point in the air Road surface Road surface
(a) (b) (a) (b) Figure 3. Three consecutive object points scanned by MLS: (a) three points are all road points; Figure 3. Three consecutive object points scanned by MLS: (a) three points are all road points; (b) one point is isolated point in points the airscanned with scanning distance obviously shorter than that of Figure 3. Three consecutive object by MLS: (a) three points are all road points; (b)the one (b) one point is isolated point in the air with scanning distance obviously shorter than that of the previous pointpoint and the nextair point. point is isolated in the with scanning distance obviously shorter than that of the previous previous point and the next point. point and the next point.
According to the two characteristics of the isolated LiDAR points in the air identified above, According to the two characteristics of the isolated LiDAR points in the air identified above, a point p withto scanning distance value is classified isolated LiDAR S c and I c , points According the two characteristics of intensity the isolated LiDAR in theas airanidentified above, a a point p with scanning distance S c and intensity value I c , is classified as an isolated LiDAR point p with scanning distance Sc and intensity value Ic , is classified as an isolated LiDAR point in
Sensors 2016, 16, 903
5 of 21
903 5 of 21 of the the air Sensors based2016, on 16, Equation (1). In the equation, Sp and Sn correspond to the scanning distance previous point and the next point, and ρ I is the intensity threshold:
point in the air based on Equation (1). In the equation, Sp and Sn correspond to the scanning # distance of the previous point and the next point, and ˘I is the intensity threshold:
@p :
if
pSc ă S p & Sc ă Sn & Ic ă ρ I Isolated LiDAR point Isolated LiDAR point if ( S c < Sotherwise p & S c < S n & I c