Scapegoat: an Adaptive monitoring framework for Component-based systems Inti Gonzalez-Herrera, Johann Bourcier, Erwan Daubert, Walter Rudametkin, Olivier Barais, Fran¸cois Fouquet, Jean-Marc J´ez´equel
To cite this version: Inti Gonzalez-Herrera, Johann Bourcier, Erwan Daubert, Walter Rudametkin, Olivier Barais, et al.. Scapegoat: an Adaptive monitoring framework for Component-based systems. Antony Tang. Working IEEE/IFIP Conference on Software Architecture, Apr 2014, Syndey, Australia. 2014.
HAL Id: hal-00983045 https://hal.inria.fr/hal-00983045 Submitted on 24 Apr 2014
HAL is a multi-disciplinary open access archive for the deposit and dissemination of scientific research documents, whether they are published or not. The documents may come from teaching and research institutions in France or abroad, or from public or private research centers.
L’archive ouverte pluridisciplinaire HAL, est destin´ee au d´epˆot et `a la diffusion de documents scientifiques de niveau recherche, publi´es ou non, ´emanant des ´etablissements d’enseignement et de recherche fran¸cais ou ´etrangers, des laboratoires publics ou priv´es.
Scapegoat: an Adaptive monitoring framework for Component-based systems Inti Gonzalez-Herrera
Johann Bourcier
Erwan Daubert
Walter Rudametkin
Univ Rennes 1 - IRISA Campus de Beaulieu 35042 Rennes, France
[email protected]
Univ Rennes 1 - IRISA Campus de Beaulieu 35042 Rennes, France
[email protected]
Univ Rennes 1 - IRISA Campus de Beaulieu 35042 Rennes, France
[email protected]
INRIA Campus de Beaulieu 35042 Rennes, France
[email protected]
Olivier Barais
François Fouquet
Jean-Marc Jézéquel
Univ Rennes 1 - IRISA Campus de Beaulieu 35042 Rennes, France
[email protected]
Univ du Luxembourg Luxembourg, Luxembourg
[email protected]
Univ Rennes 1 - IRISA Campus de Beaulieu 35042 Rennes, France
[email protected]
Abstract—Modern component frameworks support continuous deployment and simultaneous execution of multiple software components on top of the same virtual machine. However, isolation between the various components is limited. A faulty version of any one of the software components can compromise the whole system by consuming all available resources. In this paper, we address the problem of efficiently identifying faulty software components running simultaneously in a single virtual machine. Current solutions that perform permanent and extensive monitoring to detect anomalies induce high overhead on the system, and can, by themselves, make the system unstable. In this paper we present an optimistic adaptive monitoring system to determine the faulty components of an application. Suspected components are finely instrumented for deeper analysis by the monitoring system, but only when required. Unsuspected components are left untouched and execute normally. Thus, we perform localized just-in-time monitoring that decreases the accumulated overhead of the monitoring system. We evaluate our approach against a state-of-the-art monitoring system and show that our technique correctly detects faulty components, while reducing overhead by an average of 80%.
I.
I NTRODUCTION
Modern computing systems, such as home automation, pervasive and ubiquitous systems are becoming a larger part of our lives. The tight connection with our living environment introduces new needs for these systems, such as the coevolution of the system with its environment, the adaptation of the system to available resources and to users’ behaviours, and the reliability of the system in front of faulty or malicious behaviours. Modern component frameworks assist software developers in coping with these new needs by providing introspection, reconfiguration, advanced technical services, among other facilities. These frameworks provide an extensible middleware and assist in managing technical issues such as security, transaction management, or distributed computing. They also support the simultaneous execution of multiple software components on the same virtual machine [34], [16], [11]. While component frameworks simplify the programming
model for software developers, the isolation between the various components is limited because they are collocated on the same virtual machine. This allows components to be communicate efficiently and to share references to complex objects, something which is generally not possible when crossing the process boundary. However, one faulty software artifact may compromise the whole system by, for example, consuming all available resources on the machine. Furthermore, because these systems evolve in open environments where humans have central roles, software developers are unable to anticipate all future configurations of the application at design-time [3]. In these highly unpredictable environments, detecting irregular behaviour and maintaining the system in a consistent state is an important concern that can be addressed through continuous monitoring. State of the art monitoring systems [17], [24], [7] extract steady data-flows of system parameters, such as the time spent executing a component, the amount of I/O and memory used, and the number of calls to a component. The overhead that these monitoring systems introduce into applications is high, which makes it unlikely for them to be used in production systems. Results presented in [8] show that overhead due to fine-grain monitoring systems can be up to a factor of 4.3. Our experiments, presented in this paper, show that overhead grows with the size of the monitored software. Thus, overhead greatly limits the scalability and usage of monitoring systems. In this paper, we address excessive overhead in monitoring approaches by introducing an optimistic adaptive monitoring system that provides lightweight global monitoring under normal conditions, and precise and localized monitoring when problems are detected. Although our approach reduces the accumulated amount of overhead in the system, it also introduces a delay in finding the source of a faulty behaviour. Our objective is to provide an acceptable trade-off between the overhead and the delay to identify the source of faulty behaviour in the system. Our optimistic adaptive monitoring system is based on the following principles:
•
•
•
Contract-based resource usage. The monitoring system follows component-based software engineering principles. Each component is augmented with a contract that specifies their expected or previously calculated resource usage [5]. The contracts specify how a component uses memory, I/O and CPU resources. Localized just-in-time injection and activation of monitoring probes. Under normal conditions our monitoring system performs a lightweight global monitoring of the system. When a problem is detected at the global level, our system activates local monitoring probes on specific components in order to identify the source of the faulty behaviour. The probes are specifically synthesized according to the component’s contract to limit their overhead. Thus, only the required data are monitored (e.g., only memory usage is monitored when a memory problem is detected), and only when needed. Heuristic-guided search of the problem source. We use a heuristic to reduce the delay of locating a faulty component as quickly as possible while maintaining an acceptable overhead. This heuristic is used to inject and activate monitoring probes on the suspected components. However, overhead and latency in finding the faulty component are greatly impacted by the precision of the heuristic. A heuristic that quickly locates faulty components will reduce both delays and the accumulated overhead of the monitoring system. We propose using
[email protected] techniques in order to build an efficient heuristic.
The Daum project1 provides a software application that supports firefighters in these situations. The application runs on devices with limited computational resources because it must be mobile and taken on-site. It provides numerous services for firefighters depending on their role in the crisis. In this paper we focus on the two following roles: •
•
A collaborative functionality that allows commanding officers to follow and edit tactical operations. The firefighters’ equipment include communicating sensors that report on their current conditions. A drone control system which automatically launches a drone equipped with sensors and a camera to provide a different point-of-view on the current situation.
As is common in many software applications, the firefighter application may have a potentially infinite number of configurations. These configurations depend on the number of firefighters involved, the type of crisis, the available devices and equipment, among other parameters. Thus, it is generally not possible to test all configurations to guarantee that the software will always function properly. Consequently, instead of testing all configurations, there is a need to monitor the software’s execution to detect faulty behaviours and prevent system crashes. However, fine-grained monitoring of the application can have excessive overhead that makes it unsuitable with the application and the devices used in our example. Thus, there is a need for an accurate monitoring system that can find faulty components while reducing overhead.
The evaluation of our optimistic adaptive monitoring system shows that, in comparison to other state-of-the-art approaches, the overhead of the monitoring system is reduced by up to 80%. Regarding latency, our heuristic reduces the delay to identify the faulty component when changing from global, lightweight monitoring to localized, just-in-time monitoring.
The Daum project has implemented the firefighter application using a Component Based Software Architecture. The application makes extensive use of the Kevoree2 component model and runtime presented below.
The remainder of this paper is organized as follows. Section II presents the background on
[email protected] and motivates our work through a case study which is used to validate the approach. Section III provides an overview of the Scapegoat framework. It highlights how the component contracts are specified, how monitoring probes are injected and activated on-demand, how the ScapeGoat framework enables the definition of heuristics to detect faulty components without activating all the probes, and how we benefit from
[email protected] to build efficient heuristics. Section IV validates the approach through a comparison of detection precision and detection speed with other approaches. Finally, section V discusses related work and section VI discusses the approach and presents our conclusion and future work.
Kevoree is an open-source dynamic component platform, which relies on
[email protected] [10] to properly support the dynamic adaptation of distributed systems. Our use case application and the implementation of the Scapegoat framework make extensive use of the Kevoree framework. The following subsections detail the background on componentbased software architecture, introduce the
[email protected] paradigm and give an overview of the Kevoree platform.
II.
BACKGROUND AND MOTIVATING EXAMPLE
A. Motivating example In this section we present a motivating example for the use of an optimistic adaptive monitoring process in the context of a real-time crisis management system in a fire department. During a dangerous event, many firefighters are present and need to collaborate to achieve common goals. Firefighters have to coordinate among themselves and commanding officers need to have an accurate real-time view of the system.
B. Kevoree
1) Component-based software architecture: Software architecture aims at reducing complexity through abstraction and separation of concerns by providing a common understanding of component, connector and configuration [15], [28], [35]. One of the benefits is that it facilitates the management of dynamic architectures, which becomes a primary concern in the Future Internet and Cyber-Physical Systems [31]. Such systems demand techniques that let software react to changes by self-organizing its structure and self-adapting its behaviour. Many works [20] have shown the benefits of using componentbased approaches in such open-world environments [3]. To satisfy the needs for adaptation, several component models provide solutions to dynamically reconfigure a software architecture through, for example, the deployment of new 1 https://github.com/daumproject 2 http://www.kevoree.org
modules, the instantiation of new services, and the creation of new bindings between components. In practice, componentbased (and/or service-based) platforms like Fractal [11], OpenCOM [12], OSGi [34] or SCA [32] provide platform mechanisms to support dynamic architectures.
probes, iii) heuristic-guided faulty component detection. The following subsections present an overview of these three principles in action.
2)
[email protected]: Built on top of dynamic component frameworks,
[email protected] denote model-driven approaches that aim at taming the complexity of dynamic adaptation. It basically pushes the idea of reflection [30] one step further by considering the reflection-layer as a real model: “something simpler, safer or cheaper than reality to avoid the complexity, danger and irreversibility of reality”. In practice, component-based and service-based platforms offer reflection APIs that allow instrospecting the application (e.g., which components and bindings are currently in place in the system) and dynamic adaptation (e.g., changing the current components and bindings). While some of these platforms offer rollback mechanisms to recover after an erroneous adaptation [25], the purpose of
[email protected] is to prevent the system from actually enacting an erroneous adaptation. In other words, the “model at runtime” is a reflection model that can be decoupled from the application (for reasoning, validation, and simulation purposes) and then automatically resynchronized. This model can not only manage the application’s structural information (i.e., the architecture), but can also be populated with behavioural information from the specification or the runtime monitoring data.
In both the Kevoree and ScapeGoat approaches, we follow the contract-aware component classification [5], which applies B. Meyer’s Design-by-Contract principles [29] to components. In fact, ScapeGoat provides Kevoree with Quality of Service contract extensions that specify the worst-case values of the resources the component uses. The resources specified are memory, CPU, I/O and the time to service a request.
The Kevoree framework: Kevoree provides multiple concepts that are used to create a distributed application that allows dynamic adaptation. The Node concept is used to model the infrastructure topology and the Group concept is used to model the semantics of inter-node communication, particularly when synchronizing the reflection model among nodes. Kevoree includes a Channel concept to allow for different communication semantics between remote Components deployed on heterogeneous nodes. All Kevoree concepts (Component, Channel, Node, Group) obey the object type design pattern [21] in order to separate deployment artifacts from running artifacts. Kevoree supports multiple execution platforms (e.g., Java, Android, MiniCloud, FreeBSD, Arduino). For each target platform it provides a specific runtime container. Moreover, Kevoree comes with a set of tools for building dynamic applications (a graphical editor to visualize and edit configurations, a textual language to express reconfigurations, several checkers to valid configurations). As a result, Kevoree provides a promising environment by facilitating the implementation of dynamically reconfigurable applications in the context of an open-world environment. Because our goal is to design and implement an adaptive monitoring system, the introspection and the dynamic reconfiguration facilities offered by Kevoree suit the needs of the ScapeGoat framework. III.
T HE S CAPE G OAT FRAMEWORK
Our optimistic adaptive monitoring system extends the Kevoree platform with the following principles: i) component contracts that define per-component resource usage, ii) localized and just-in-time injection and activation of monitoring
A. Specifying component contracts
For example, for a simple Web server component we can define a contract on the number of instructions per second it may execute [7] and the maximum amount of memory it can consume. The number of messages can be specified per component or per component-port. The example is shown in Listing 1.3 This contract extension follows the component interface principle [1], and allows us to detect if the problem comes from the component implementation or from a component interaction. That is, we can distinguish between a component that is using excessive resources because it is faulty, or because other components are calling it excessively. addComponent WsServer650@node0 : WsServer { // Specify that this component can use 258 CPU // instructions per second, cpu_wall_time = ’258’, // Specify that this component can consume a maximum of 15000 // bytes of memory, memory_max_size = ’15000’, // Specify that the contract is guaranteed under the assumption that // we do not receive more than 10k messages on the component and // 10k messages on the port named service // ( this component has only one port ) throughput_msg_per_second=’all=10000;service=10000’ }
Listing 1.
Component contract specification example
B. An adaptive monitoring framework within the container Scapegoat provides a monitoring framework that adapts its overhead to current execution conditions and leverages the architectural information provided by Kevoree to guide the search for faulty components. The monitoring mechanism is mainly injected within the component container. Each Kevoree node/container is in charge of managing the component’s execution and adaptation. Following the
[email protected] approach, each node can be sent a new architecture model that corresponds to a system evolution. In this case, the node compares its current configuration with the configuration required by the new architectural model and computes the list of individual adaptations it must perform. Among these adaptations, the node is in charge of downloading all the component packages and their dependencies, and loading them into memory. During this process, Scapegoat provides the existing container with (i) checks to verify that the system has enough resources to manage the new component, and (ii) instrumentation for the component’s classes in order 3 Contract examples for the architecture presented in section II-A can be found at http://goo.gl/uCZ2Mv.
to add bytecode for the monitoring probes. Scapegoat uses the components’ contracts to check if the new configuration will not exceed the amount of resources available on the device. And Scapegoat instruments the components’ bytecode to monitor object creation (to compute memory usage), to compute each statement (for calculating CPU usage), and to monitor calls to classes that wrap I/O access such as the network or file-system. We provide several instrumentation levels that vary in the information they obtain and in the degree they impact the application’s performance: • • • •
Global monitoring does not instrument any components, it simply uses information provided directly by the JVM. Memory instrumentation or memory accounting, which monitors the components’ memory usage. Instruction instrumentation or instruction accounting, which monitors the number of instructions executed by the components. Memory and instruction instrumentation, which monitors both memory usage and the number of instructions executed.
Probes are synthesized according to the components’ contracts. For example, a component whose contract does not specify I/O usage will not be instrumented for I/O resource monitoring. Probes can be dynamically activated or deactivated, with the exception of memory usage probes. Memory consumption probes must remain activated to guarantee that all memory usage is properly accounted for, from the component’s creation to the component’s destruction. Indeed, deactivating memory probes would cause object allocations to remain unaccounted for. However, probes for CPU and I/O usage can be activated on-demand to check for component contract compliance.
monitor(C: Set, heuristic : Set→Set) init memory probes (c | c ∈ C ∧ c.memory_contract 6= ∅) while container is running wait violation in global monitoring checked = ∅ faulty = ∅ while checked 6= C ∧ f aulty = ∅ subsetToCheck = heuristic ( C \ checked ) instrument for adding probes ( subsetToCheck ) faulty = fine −grain monitoring( subsetToCheck ) instrument for removing probes ( subsetToCheck ) checked = checked ∪ subsetToCheck if faulty 6= ∅ adapt the system ( faulty , C) fine −grain monitoring( C : Set ) wait few milliseconds // to obtain good information faulty = {c | c ∈ C ∧ c.consumption > c.contract} return faulty
Listing 2.
• •
1) ScapeGoat’s architecture: The Scapegoat framework is built using the Kevoree component framework. Scapegoat extends Kevoree by providing a new Node Type and three new Component Types: •
•
As a result, at any given moment, applications must be in one of the following monitoring modes:
•
• •
No monitoring. The software is executed without any monitoring probes or modifications. Global monitoring. Only global resource usage is being monitored, such as the CPU usage and memory usage at the Java Virtual Machine (JVM) level. Full monitoring. All components are being monitored for all types of resource usage. This is equivalent to current state-of-the-art approaches.
Localized monitoring. Only a subset of the components are monitored. Adaptive monitoring. The monitoring system changes from Global monitoring to Full or Localized monitoring if a faulty behaviour is detected.
For the rest of this paper we use the term all components for the adaptive monitoring policy that indicates that the system changes from global monitoring mode to full monitoring mode if and when a faulty behaviour is detected.
To take advantage of having dynamic probes, we attempt to minimize the overhead of the monitoring system by activating selected probes only when a problem is detected at the global level. We estimate the most likely faulty components and then activate the pertinent monitoring probes. This technique means we only activate fine-grain monitoring on components suspected of misbehavior. After monitoring this subset of components, if any of them are indeed faulty, the monitoring system has finished and determines that these components are the source of the problem. If the subset of components are determined to be healthy, the system continues its search and starts monitoring the second most likely faulty subset. The monitoring mechanism implemented for ScapeGoat is summarized in listing 2.
•
The main monitoring loop implemented in ScapeGoat
•
Monitored Node. Handles the admission of new components by storing information about resource availability. Before admission, it checks the security policies and registers components with a contract in the monitoring framework. Moreover, it intercepts and wraps class loading mechanisms to record a component type’s loaded classes. Such information is used later to (de)activate the probes. Monitoring Component. This component type is in charge of checking component contracts. Basically, it implements a complex variant of the algorithm in listing 2. It communicates with other components to identify suspected components. Ranking Component. This is an abstract Component Type; therefore it is user customizable. It is in charge of implementing the heuristic that ranks the components from the most likely to be faulty to the least likely. Adaptation component. This component type is in charge of dealing with the adaptation of the application when a contract violation is detected. It is also a customizable component. The adaptation strategy whenever a faulty component is discovered is out os scope of this paper. Nevertheless, several strategies may be implemented in Scapegoat, such as removing faulty components or slowing down communication between components when the failure is due to a violation in the way one component is using another.
2) Implementation strategy: Scapegoat aims minimizing monitoring overhead when the framework is running in Global Monitoring mode. To achieve this, ScapeGoat removes as many monitoring probes as possible and only activates probes that are required. This requires changing the bytecode that defines the application’s classes at runtime, when the monitoring mode changes. Bytecode is changed at a per-component basis. We use the ASM library to perform bytecode manipulation and a Java agent to get access to and transform the classes. Bytecode manipulation has been proposed before for resource accounting and profiling in Java [6], [7], [14]. C. Leveraging
[email protected] to build an efficient monitoring framework As presented in section III-B, our approach offers a dynamic way to activate and deactivate fine-grain localized monitoring. We use a heuristic to determine which components are more likely to be faulty. Suspected components are the first to be monitored. Our framework can support different heuristics, which can be application or domain-specific. In this paper we propose a heuristic that leverages the use of the
[email protected] approach to infer the faulty components. The heuristic is based on the assumption that the cause of newly detected misbehavior in an application is likely to come from the most recent changes in the application. This can be better understood as follows: • •
recently added or updated components are more likely to be the source of a faulty behaviour; components that directly interact with recently added or updated components are also suspected.
We argue that when a problem is detected it is probable that recent changes have led to this problem, or else, it would have likely occurred earlier. If recently changed components are monitored and determined to be healthy, it is probable that the problem comes from direct interactions with those components. Indeed, changes to interactions can reveal dormant issues with the components. The algorithm used for ranking the components is presented in more detail in listing 3. In practice, we leverage the architectural-based history of evolutions of the application, which is provided by the
[email protected] approach. IV.
E VALUATION
In this section we present our experiments and discuss the usability of our approach. We focus on the following research questions to assess the quality and the efficiency of ScapeGoat: •
•
What is the impact of the various levels of instrumentation on the application? Our approach assumes high overhead for full monitoring and low overhead for a lightweight global monitoring system. The experiments presented in section IV-A show the overhead for each instrumentation level. Does our adaptive monitoring approach have better performance than state-of-the-art monitoring solutions? The experiment presented in section IV-B highlights the performances benefits of our approach considering a real-world scenario.
ranker () : list visited = ∅ ranking = {} for each model M ∈ History N = {c | c was Sadded in M} c.neighbors Neighbors = c∈N ranking . add N\ visited visited = visited ∪ N SortedNeighbors = sort (Neighbors \ visited ) ranking . add SortedNeighbors visited = visited ∪ Neighbors return ranking sort (S : Set) : list r = {} if S 6= ∅ choose b | b ∈ S ∧ b is newer than any other element in S r . add b, sort (S\{b}) return r
Listing 3.
•
The ranking algorithm (uses the model history for ranking).
What is the impact of using a heuristic in our adaptive monitoring approach? The experiment presented in section IV-C highlights the impact of the application and component sizes, and the need of a good heuristic to quickly identify faulty components.
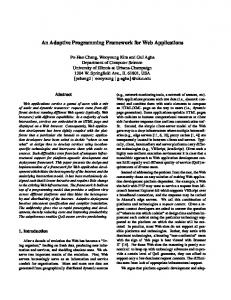
The efficiency of our monitoring solution is evaluated on two dimensions: the overhead on the system and the delay to detect failures. We show there is a trade-off between the two dimensions and that ScapeGoat provides a valuable solution that increases the delay to detect a faulty component but reduces accumulated overhead. a) Use case: We have built several use cases based on a template application from our motivating example in section II-A. We reused an open-source crisis-management application for firefighters that has been built with Kevoree components. We use two functionalities of the crisis-management application. The first one is for managing firefighters. The equipment given to each firefighter contains a set of sensors that provides data for the firefighter’s current location, his heartbeat, his body temperature, his acceleration movements, the environmental temperature, and the concentration of toxic gases. These data are collected and displayed in the crisis-management application, which provides a global-view of the situation. The second functionality uses drones to capture real-time video from an advantageous point-of-view. Figure 1 shows the set of components that are involved in our use-case, including components for firefighters, drones and the crisis-management application4 . The components in the crisis-management application are used in our experiments, but the physical devices (drones and sensors) are simulated through the use of mock components. Every use case we present extends the crisis-management base application by any one of the following possibilities: adding new or redundant components, adding external Java applications with wrapper components (e.g., Weka, DaCapo), or modifying existing components (e.g., to introduce a fault into them). 4 More information about these components is given in http://goo.gl/ x64wHG
The component configuration for our crisis-management use-case.
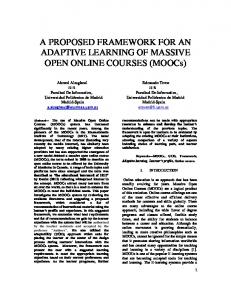
A. Overhead of the instrumentation solution Our first experiment compares the various instrumentation levels to show the overhead of each one. In this experiment, we compare the following instrumentation levels: No monitoring, Global monitoring, Memory instrumentation, Instructions instrumentation, Memory and instructions instrumentation (i.e., Full monitoring). In this set of experiments we used the DaCapo 2006 benchmark suite [9]. We developed a Kevoree component to execute this benchmark 5 . The container was configured to use full monitoring and the parameters in the contract are upper bounds of the real consumption6 . Figure 2 shows the execution time of several DaCapo tests under different scenarios. First, we wish to highlight that Global monitoring introduces no overhead compared with the No monitoring mode. Second, the overhead due to memory accounting is lower than the overhead due to instruction accounting. This is very important because, as we described in section III-B, memory probes cannot be deactivated dynamically. We calculated the overhead as: overhead =
W ithInstrumentation GlobalM onitoring
5 http://goo.gl/V5T6De 6 Scripts
are generated from those available at http://goo.gl/FR8LC7.
40
Full Monitoring (Memory) Full Monitoring (CPU) Full Monitoring (Memory & CPU)
20
Fig. 2.
ch
n lu
se
ar
la xa
t
de x in lu
ar ch
on th jy
db ql hs
fo
p
0 tlr
The evaluation of our approach is tightly coupled with the quality of the resource consumption contracts attached to each component. We built the contracts following classic profiling techniques. The contracts were built by performing several runs of our use cases, without inserting any faulty components into the execution. Firstly, we executed the use cases in an environment with global monitoring activated to get information for the global contract. Secondly, percomponent contracts were created by running the use cases in an environment with full monitoring.
No monitoring Global monitoring
an
b) Measurement Methodology: To obtain comparable and reproducible results, we used the same hardware across all experiments: a laptop with a 2.90GHz Intel(R) i7-3520M processor, running Fedora 19 with a 32 bit kernel and 8GB of system memory. We used the HotSpot Java Virtual Machine version 1.7.0-40, and Kevoree framework version 2.0.12. Each measurement presented in the experiment is the average of ten different runs under the same conditions.
Time (seconds)
Fig. 1.
Execution time for tests using the DaCapo Benchmark
The average overhead due to memory accounting is 3.70, while the value for instruction accounting is 6.54. These values are not as good as the values reported in [8]; the difference is negligible for memory accounting but they obtain a superior value between 3.2 and 4.3 for instructions accounting. The performance difference comes from a specific optimization that we chose not to apply. The optimization provides fast access to the execution context by adding a new parameter to each method. Nevertheless, this solution needs to keep a version of the method without the new parameter because native calls cannot be instrumented like that. We decided to avoid such an optimization because duplication of methods increases the size of the applications, and with it, the memory used by the heap. In short, our solution can reach similar values if we include the mentioned optimization, but at the cost of using more memory. On the other hand, the values we report are far lower than the values reported in [8] for hprof. Hence, we consider that our solution is comparable to state of the art approaches in the literature. In addition, we plan to study alternatives to improve instruction accounting. For example, we plan to study the use of machine learning for monitoring [33]. Based on a machine learning approach, it is possible to train the monitoring system to do the instruction instrumentation. Then, instead of doing normal instruction instrumentation, we might only do, for example, method-calls instrumentation and with the learning data, the monitoring system should be able to infer the CPU usage of each call, whilst lowering the overhead. The results of our experiment shown in figure 2 demonstrate the extensive impact the Full monitoring mode, which
600 Time (seconds)
Full monitoring
400
Adaptive with Localized monitoring Global Monitoring
200
Table I shows the tests we built for the experiment. We developed the tests by extending the template application. Faults were introduced by modifying an existing component to break compliance with its resource consumption contract. We reproduce each execution repetitively; thus, the faulty behaviour is triggered many times during the execution of the application. The application is not restarted. Figure 3 shows the execution time of running the use cases with different scenarios. Each scenario uses a specific monitoring policy (Full monitoring, Adaptive monitoring with All Components, Adaptive monitoring with Localized monitoring, Global monitoring). This figure shows that the overhead differences between Full monitoring and Adaptive monitoring with All Components is clearly impacted by scenarios that cause the system to transition too frequently between a lightweight Global and a fine-grain Adaptive monitoring. Such is the case for use cases UC3 and UC4 because the faulty component is inserted and never removed. Using Adaptive monitoring is beneficial if the overhead of Global monitoring plus the overhead of switching back and forth to All Components monitoring is less than the overhead of the Full monitoring for the same execution period. If the application switches between monitoring modes too often then the benefits of adaptive monitoring are lost. The overhead of switching from Global monitoring to full components or Localized monitoring comes from the fact that the framework must reload and instrument classes to activate the monitoring probes. Therefore, using Localized monitoring reduces the number of classes that must be reloaded. This is shown in the third use-case of figure 3, which uses a heuristic based on the number of failures. Because we execute the faulty component many times, the heuristic is able to select, monitor and identify the faulty component quickly. This reduces overhead by 80%. We use the following equation to calculate overhead:
Gain = 100 −
OurApproach − GlobalM onitoring ∗ 100 F ullM onitoring − GlobalM onitoring
U C6
U C5
U C4
U C1
U C3
0
B. Overhead of Adaptive Monitoring vs Full Monitoring The previous experiment highlights the usefulness of using Adaptive monitoring. However, switching from Global monitoring to either Full or Localized monitoring introduces an additional overhead due to having to instrument components and activate monitoring probes. Our second experiment compares the overhead introduced by the adaptive monitoring with the overhead of Full monitoring as used in state-of-the-art monitoring approaches.
Adaptive with All Components
U C2
uses either Memory instrumentation or CPU instrumentation, has on the application. Our Adaptive monitoring mode, which uses Global monitoring and switches to Full monitoring or localized monitoring, is able to reduce this accumulated overhead due to the fact that Global monitoring has no appreciable overhead.
Fig. 3. Execution time for some use cases under different monitoring policies.
C. Overhead from switching monitoring modes, and the need of a good heuristic As we explain in the previous experiments, even if using Localized monitoring is able to reduce the overhead of the monitoring system, the switch between Global and Localized monitoring introduces additional overhead. If this overhead is too high, the benefits of adaptive monitoring are lost. In this experiment we show the impact of the application’s size, in terms of number of components, and the impact of the component’s size, in terms of number of classes, on adaptive monitoring. We also show that the choice of the heuristic to select suspected components for monitoring is important to minimize the overhead caused from repeated instrumentation and probe activation processes. For the use case, we created two components and we introduced them into the template application separately. Both components perform the same task, which is performing a primality test on a random number and sending the number to another component. However, one of the components causes 115 classes to be loaded, while the other only loads 4 classes. We used the same basic scenario with a varying number of primality testing components and component sizes. In this way, we were able to simulate the two dimensions of application size. The exact settings, leading to 12 experiments, are defined by the composition of the following constraints: • •
Ncomp = {4, 8, 16, 32, 64, 128} which defines the number of components for the application Sizecomp = {4, 115} which defines the number of classes for a component
With these use cases, we measured the delay to find the faulty component and the execution-time overhead caused by monitoring. Figures 4 and 5 show the delay to detect the faulty component with regards to the size of the application. In the first figure, the component size is 115 classes, and in the second figure, the component size is four classes. 1) Impact of the application size: Using figures 5 and 7, we see that the size of the application has an impact on the delay to detect faulty components, and also on the monitoring overhead. We also calculated the time needed to find the faulty component with the All components mode after its initialization (the time needed to switch from Global monitoring). This time is around 2 seconds no matter the size of the application.
Delay time (seconds)
All components Perfect Heuristic Random Heuristic
20 100 15 10
50
5 0 0
50
100
0
50
Number of components
100
Number of components
Execution time (seconds)
Fig. 4. Delay time to detect fault with a component size Fig. 5. Delay time to detect fault with a component size of 115 classes. of four classes.
1,000
1,000
500
500
0
50
All components Perfect Heuristic Random Heuristic Non adaptive monitoring
0
100
50
100
Number of components
Number of components
Fig. 6. Execution time of main task with a component size Fig. 7. Execution time of main task with a component size of four classes. of 115 classes.
That is the reason the switch from Global monitoring to All components has such a large effect on overhead.
These figures also show that using Localized monitoring instead of All components when switching from Global monitoring helps reduce the impact of the application’s size by reducing the number of components to monitor and the number of classes to instrument. However, we also see that using a sub-optimal heuristic may have negatively impacted the delay to detect faulty components. This can be explained by the multiple switches that the Random heuristic may often require to locate the faulty component.
2) Impact of the component size: In figures 4 and 5 we see that even if we use a good heuristic, the size of the components to monitor impacts the delay in detecting the faulty component. Like the application’s size, component size impacts the switch from Global monitoring to Localized monitoring. A good heuristic reduces the number of transitions; thus, it reduces overhead. TABLE I. Test Name UC1 UC2 UC3 UC4 UC5 UC6
Monitored Resource CPU, Memory CPU, Memory CPU, Memory CPU CPU, Memory Memory
D. Threats to validity Our experiments show the benefits of using adaptive monitoring instead of state-of-the-art monitoring approaches. As in every experimental protocol, our evaluation has some bias which we have tried to mitigate. All our experiments are based around the same case study. We have tried to mitigate this issue by using an available real case study. We have also used different settings across our experiments, even if all of the experiments are based on the same case study. Thus, our experiments limit the validity of the approach to applications with the same characteristics of the presented case study. New experiments with other use cases are needed to broaden the validation scope of our approach. The evaluation of the heuristic mainly shows the potential impact of using an ideal heuristic. More case study and experiments are needed to fully validate the value of our
[email protected] based heuristic. V.
R ELATED WORK
The Scapegoat framework is related to component monitoring,
[email protected], component isolation and component
F EATURES OF USE CASES .
Faulty Resource CPU CPU CPU CPU CPU CPU
Heuristic number of failures number of failures number of failures number of failures less number of failures number of failures
External Task Weka, training neural network dacapo, antlr dacapo, chart dacapo, xalan dacapo, chart Weka, training neural network
performance prediction approaches. Performance and resource-consumption prediction approaches are complementary to the Scapegoat framework because they can assist in better specifying the component contracts. Some approaches require developers to provide extensive per-component metadata at design-time in order to calculate the application’s overall performance or resource consumption [4], [22]. Prediction approaches have been achieved by using combinations of design-time and runtime analyses [2]. However, although many approaches to performance prediction have been proposed, none of them have obtained widespread use [23]. KAMI [19] builds performance models at design-time but uses and continually refines them at runtime. By collecting runtime data, they are able to build performance and resource consumption models that reflect real usage. They are able to adapt the application according to changes in components’ behavior, but they do not use nor propose an adaptive monitoring system to minimize overhead. State of the art monitoring systems [17], [24], [7] extract steady data-flows of system parameters, such as, the time spent executing a component, the amount of I/O and memory used, and the number of calls to a component. The overhead that these monitoring systems introduce into applications is high, which makes it unlikely for them to be used in production systems. Maurel et al. [27] propose an adaptive monitoring framework for the OSGi platform. Similarly to our work, they propose a global monitoring system that changes to a localized monitoring system when a problem is detected. However, their work is focused on CPU usage and does not consider other resources, such as, memory or I/O. Gama and Donsez [18] propose using virtual machines in separate processes or using MVM isolates [13] to manage trusted and untrusted components. After an evaluation period, untrusted components can be moved to the trusted JVM if no problems are detected. This allows the main application to depend on potentially faulty components without risking severe crashes. We can also cite Microsoft technologies such as COM (Component Object Model) components which can be either loaded in the client application process or provided in an isolated process [26]. In addition to process virtualization, some operating systems also propose user-space virtualization, which isolates not only the processes but also the memory, the network interface and the file system. Examples of these approaches are Jails7 for BSD, LXC8 and CGroups for Linux, and lmctfy9 . All of these approaches have the drawback of limiting code and instance sharing and introduce additional overhead in cross-boundary component interactions. Furthermore, depending on the complexity of the approach, there is also overhead in having to manage multiple processes. VI.
is augmented with a contract that specifies its resource usage, such as peak CPU and memory consumption. ScapeGoat uses a global monitoring mode that has a very small overhead on the system, and a fine-grained localized monitoring mode that performs extensive checking of the components’ contracts. The system switches from the global monitoring mode to the localized monitoring mode whenever a problem is detected at the global level in order to identify the faulty component. Furthermore, we proposed a heuristic that leverages information produced by the
[email protected] approach to quickly predict the faulty components. ScapeGoat has been implemented on top of the Kevoree component framework which uses the
[email protected] approach to tame the complexity of distributed dynamic adaptations. The evaluation of ScapeGoat shows that the monitoring system’s overhead is reduced by up to 80% in comparison with state-of-the-art full monitoring systems. The evaluation also presents the benefits of using a heuristic to predict the faulty component. This paper contributes to the state of the art by providing a monitoring framework which adapts its overhead depending on current execution conditions and leverages the architectural information provided by Kevoree to drive the search for the faulty component. The work presented in this paper opens various research perspectives. Scapegoat currently uses code injection at loadtime to perform fine-grain monitoring. The adaptive monitoring approach we have presented provides good results, but we believe we can reduce the overhead of CPU and memory monitoring by using a modified JVM and injecting specialized bytecode to cooperate with it. The modified JVM would account for the resources at a low-level, while the instrumentation code could provide application-level information like the component boundaries. This should result in a more efficient solution than calculating resource usage at the applicationlevel only. A second research perspective consists in proposing an appropriate reaction when the source of a problem is discovered by ScapeGoat. Indeed, the reconfiguration when a resource-consumption problem is found could range from resource limitations for guilty components, to a replacement of the component or of part of the application. In the context of a distributed system, the set of possible reconfigurations is larger and can include moving components across the distributed infrastructure. In this context, choosing a reconfiguration to efficiently deal with the discovered fault will be necessary. ACKNOWLEDGEMENT This work has been supported by the European FP7 Marie Curie Initial Training Network RELATE (Grant Agreement No. 264840). It has been also supported by the ITEA2 MERgE project, and by the French project InfraJVM (Grant Agreement No. ANR-11-INFR-0008).
C ONCLUSION
In this paper we presented ScapeGoat, an adaptive monitoring framework to perform lightweight yet efficient monitoring of Component-Based Systems. In ScapeGoat, each component 7 http://www.freebsd.org/doc/handbook/jails.html 8 http://lxc.sourceforge.net/ 9 https://github.com/google/lmctfy
R EFERENCES [1]
L. Alfaro and T. Henzinger, “Interface theories for component-based design,” in Embedded Software, ser. Lecture Notes in Computer Science, T. Henzinger and C. Kirsch, Eds. Springer Berlin Heidelberg, 2001, vol. 2211, pp. 148–165. [2] M. Autili, P. Di Benedetto, and P. Inverardi, “A hybrid approach for resource-based comparison of adaptable java applications,” Science of Computer Programming, 2012.
[3] [4]
[5] [6] [7]
[8] [9]
[10] [11]
[12] [13] [14]
[15]
[16]
[17]
[18]
[19]
[20]
[21] [22]
L. Baresi, E. Di Nitto, and C. Ghezzi, “Toward open-world software: Issue and challenges,” Computer, vol. 39, no. 10, pp. 36–43, Oct. 2006. S. Becker, H. Koziolek, and R. Reussner, “Model-based performance prediction with the palladio component model,” in Proceedings of the 6th international workshop on Software and performance, ser. WOSP ’07. New York, NY, USA: ACM, 2007, pp. 54–65. A. Beugnard, J.-M. Jézéquel, N. Plouzeau, and D. Watkins, “Making components contract aware,” Computer, vol. 32, no. 7, pp. 38–45, Jul. 1999. W. Binder, “Portable and accurate sampling profiling for java,” Softw. Pract. Exper., vol. 36, no. 6, pp. 615–650, May 2006. W. Binder and J. Hulaas, “Exact and portable profiling for the {JVM} using bytecode instruction counting,” Electronic Notes in Theoretical Computer Science, vol. 164, no. 3, pp. 45 – 64, 2006, proceedings of the 4th International Workshop on Quantitative Aspects of Programming Languages (QAPL 2006). W. Binder, J. Hulaas, P. Moret, and A. Villazón, “Platform-independent profiling in a virtual execution environment,” Softw. Pract. Exper., vol. 39, no. 1, pp. 47–79, Jan. 2009. S. M. Blackburn, R. Garner, C. Hoffman, A. M. Khan, K. S. McKinley, R. Bentzur, A. Diwan, D. Feinberg, D. Frampton, S. Z. Guyer, M. Hirzel, A. Hosking, M. Jump, H. Lee, J. E. B. Moss, A. Phansalkar, D. Stefanovi´c, T. VanDrunen, D. von Dincklage, and B. Wiedermann, “The DaCapo benchmarks: Java benchmarking development and analysis,” in OOPSLA ’06: Proceedings of the 21st annual ACM SIGPLAN conference on Object-Oriented Programing, Systems, Languages, and Applications. New York, NY, USA: ACM Press, Oct. 2006, pp. 169– 190. G. S. Blair, N. Bencomo, and R. B. France, “
[email protected],” IEEE Computer, vol. 42, no. 10, pp. 22–27, 2009. E. Bruneton, T. Coupaye, M. Leclercq, V. Quéma, and J. Stefani, “The FRACTAL Component Model and its Support in Java,” Software Practice and Experience, Special Issue on Experiences with Autoadaptive and Reconfigurable Systems, vol. 36, no. 11-12, pp. 1257– 1284, 2006. G. Coulson, G. Blair, P. Grace, A. Joolia, K. Lee, and J. Ueyama, “A component model for building systems software,” in In Proc. IASTED Software Engineering and Applications (SEA’04, 2004. G. Czajkowski and L. Daynàs, “Multitasking without compromise: a virtual machine evolution,” ACM SIGPLAN Notices, vol. 47, no. 4a, pp. 60–73, 2012. G. Czajkowski and T. von Eicken, “JRes: a resource accounting interface for java,” in Proceedings of the 13th ACM SIGPLAN conference on Object-oriented programming, systems, languages, and applications, ser. OOPSLA ’98. New York, NY, USA: ACM, 1998, pp. 21–35. E. M. Dashofy, A. van der Hoek, and R. N. Taylor, “An infrastructure for the rapid development of XML-based architecture description languages,” in 24th International Conference on Software Engineering, ser. ICSE ’02. New York, NY, USA: ACM, 2002, pp. 266–276. F. Fouquet, B. Morin, F. Fleurey, O. Barais, N. Plouzeau, and J.-M. Jézéquel, “A dynamic component model for cyber physical systems,” in CBSE, V. Grassi, R. Mirandola, N. Medvidovic, and M. Larsson, Eds. ACM, 2012, pp. 135–144. S. Frénot and D. Stefan, “Open-service-platform instrumentation: Jmx management over osgi,” in Proceedings of the 1st French-speaking conference on Mobility and ubiquity computing, ser. UbiMob ’04. New York, NY, USA: ACM, 2004, pp. 199–202. K. Gama and D. Donsez, “A self-healing component sandbox for untrustworthy third party code execution,” in Proceedings of the 13th international conference on Component-Based Software Engineering, ser. CBSE’10. Berlin, Heidelberg: Springer-Verlag, 2010, pp. 130–149. [Online]. Available: http://dx.doi.org/10.1007/978-3-642-13238-4_8 C. Ghezzi and G. Tamburrelli, “Predicting performance properties for open systems with kami,” in Architectures for Adaptive Software Systems, ser. Lecture Notes in Computer Science, R. Mirandola, I. Gorton, and C. Hofmeister, Eds. Springer Berlin Heidelberg, 2009, vol. 5581, pp. 70–85. V. Grassi, R. Mirandola, N. Medvidovic, and M. Larsson, Eds., Proceedings of the 15th ACM SIGSOFT Symposium on Component Based Software Engineering, CBSE 2012, part of Comparch ’12 Federated Events on Component-Based Software Engineering and Software Architecture, Bertinoro, Italy, June 25-28, 2012. ACM, 2012. R. Johnson and B. Woolf, “The Type Object Pattern,” 1997. M. D. Jonge, J. Muskens, and M. Chaudron, “Scenario-based prediction of run-time resource consumption in component-based software
[23]
[24] [25] [26] [27]
[28] [29] [30]
[31] [32]
[33]
[34] [35]
systems,” in In Proceedings of the 6th ICSE Workshop on Componentbased Software Engineering (CBSE6. IEEE, 2003, p. pages. H. Koziolek and J. Happe, “A qos driven development process model for component-based software systems,” in Proceedings of the 9th international conference on Component-Based Software Engineering, ser. CBSE’06. Berlin, Heidelberg: Springer-Verlag, 2006, pp. 336– 343. H. Kreger, W. Harold, and L. Williamson, Java and JMX: Building Manageable Systems. Boston, MA: Addison-Wesley, 2003. M. Léger, T. Ledoux, and T. Coupaye, “Reliable dynamic reconfigurations in a reflective component model,” Component-Based Software Engineering, pp. 74–92, 2010. J. Löwy, COM and. NET: Component Services. O’Reilly Media, Inc., 2001. Y. Maurel, A. Bottaro, R. Kopetz, and K. Attouchi, “Adaptive monitoring of end-user osgi-based home boxes,” in Proceedings of the 15th ACM SIGSOFT symposium on Component Based Software Engineering, ser. CBSE ’12. New York, NY, USA: ACM, 2012, pp. 157–166. N. Medvidovic and R. N. Taylor, “A Classification and Comparison Framework for Software Architecture Description Languages,” IEEE Trans. Softw. Eng., vol. 26, pp. 70–93, January 2000. B. Meyer, “Applying "design by contract",” Computer, vol. 25, no. 10, pp. 40–51, Oct. 1992. B. Morin, O. Barais, G. Nain, and J.-M. Jezequel, “Taming Dynamically Adaptive Systems with Models and Aspects,” in ICSE’09: 31st International Conference on Software Engineering, Vancouver, Canada, May 2009. E. D. Nitto, C. Ghezzi, A. Metzger, M. P. Papazoglou, and K. Pohl, “A journey to highly dynamic, self-adaptive service-based applications,” Autom. Softw. Eng., vol. 15, no. 3-4, pp. 313–341, 2008. L. Seinturier, P. Merle, R. Rouvoy, D. Romero, V. Schiavoni, and J.-B. Stefani, “A Component-Based Middleware Platform for Reconfigurable Service-Oriented Architectures,” Software: Practice and Experience, 2011. G. Tesauro, N. K. Jong, R. Das, and M. N. Bennani, “A hybrid reinforcement learning approach to autonomic resource allocation,” in Autonomic Computing, 2006. ICAC’06. IEEE International Conference on. IEEE, 2006, pp. 65–73. The OSGi Alliance, “OSGi Service Platform Core Specification, Release 5.0,” Jun. 2012, http://www.osgi.org/Specifications/. R. van Ommering, F. van der Linden, J. Kramer, and J. Magee, “The Koala Component Model for Consumer Electronics Software,” Computer, vol. 33, no. 3, pp. 78–85, 2000.