9th IFAC symposium on Control of Power and Energy Systems Indian Institute of Technology 9th IFAC symposium on Control of Power Indian Institute of Technology 9th IFAC symposium on Control Power and and Energy Energy Systems Systems December 9-11, 2015. Delhi, Indiaof 9th IFAC symposium on Control and Energy Indian Institute of Technology Technology Available online Systems at www.sciencedirect.com December 9-11, 2015. Delhi, Indiaof Power Indian Institute of Indian Institute of Technology December 9-11, 9-11, 2015. 2015. Delhi, Delhi, India India December December 9-11, 2015. Delhi, India
ScienceDirect
IFAC-PapersOnLine 48-30 (2015) 025–030 Application Application of of TLBO TLBO for for Distribution Distribution Network Network Planning Planning via via Coordination Coordination of of Distributed Generation and Network Reconfiguration Application of TLBO for Distribution Network Planning via Coordination ApplicationDistributed of TLBO for Distribution via Coordination of of Generation andNetwork NetworkPlanning Reconfiguration Distributed Generation and Network Reconfiguration Distributed Generation Network Reconfiguration Neeraj Kanwar*, Nikhil Gupta*, K.and R. Niazi *, Anil Swarnkar*, R.C. Bansal**
Neeraj Kanwar*, Nikhil Gupta*, K. R. *, Anil Swarnkar*, R.C. Bansal** Niazi Neeraj Neeraj Kanwar*, Kanwar*, Nikhil Nikhil Gupta*, Gupta*, K. K. R. R. Niazi *, *, Anil Anil Swarnkar*, Swarnkar*, R.C. R.C. Bansal** Bansal** Niazi Neeraj Kanwar*, Nikhil Gupta*, K. R. Niazi *, Anil Swarnkar*, R.C. Bansal** *Department of Electrical Engineering, Malaviya National Institute of Technology, Jaipur, Rajasthan 302017 *Department of Electrical Engineering, Malaviya National Institute of Technology, Jaipur, Rajasthan 302017 India (e-mail:
[email protected],
[email protected],
[email protected], *Department of Electrical Electrical Engineering, Engineering, Malaviya National National Institute Institute of Technology, Technology, Jaipur, Jaipur,
[email protected]) Rajasthan 302017 302017 *Department of Malaviya of Rajasthan India (e-mail:
[email protected],
[email protected],
[email protected],
[email protected]) *Department of Electrical Engineering, Malaviya National Institute of Technology, Jaipur, Rajasthan 302017 **Department of Electrical, Electronics and Computer Engineering, University of Pretoria, South Africa, India (e-mail:
[email protected],
[email protected],
[email protected],
[email protected]) India (e-mail:
[email protected],
[email protected],
[email protected],
[email protected]) **Department of Electrical, Electronics and Computer Engineering, University of Pretoria, South Africa, India (e-mail:
[email protected],
[email protected],
[email protected],
[email protected]) (e-mail:
[email protected]) **Department of Electrical, Electronics and Computer Engineering, University of Pretoria, South Africa, **Department of Electrical, Electronics and Computer Engineering, University of Pretoria, South Africa, (e-mail:
[email protected]) **Department of Electrical, Electronics and Computer Engineering, University of Pretoria, South Africa, (e-mail: (e-mail:
[email protected])
[email protected]) (e-mail:
[email protected]) Abstract: This paper proposes an application of Teaching Learning Based Optimization (TLBO) method Abstract: This paper proposes an application of Teaching Learning Based Optimization (TLBO) method for optimalThis integration of Distributed Generations (DGs)Learning in distribution systems to minimize annual Abstract: paper an of Based (TLBO) Abstract: paper proposes proposes an application application of Teaching Teaching Based Optimization Optimization (TLBO) method method for optimalThis integration of Distributed Generations (DGs)Learning in distribution systems to minimize annual Abstract: This paper proposes an application of Teaching Learning Basedfactor Optimization (TLBO) method energy loss and to maintain a better node voltage profile using penalty approach. A piece-wise for optimal integration of Distributed Generations (DGs) in distribution systems to minimize annual for optimal integration of Distributed Generations (DGs) using in distribution systems to minimize annual energy loss and to maintain a better node voltage profile penalty factor approach. A piece-wise for optimal integration of Distributed Generations (DGs) using in network distribution systems to after minimize annual linear variable load pattern isaaconsidered and the distribution is reconfigured optimal DG energy loss and to maintain better node voltage profile penalty factor approach. A piece-wise energy loss and to maintain better node voltage profile using penalty factor approach. A piece-wise linear variable load pattern is considered and the distribution network is reconfigured after optimal DG energy loss and to maintain a better node voltage profile using penalty factor approach. A piece-wise placement. Efforts have been made to scan the search space efficiently in such a way that every node of linear variable variable loadhave pattern is made considered and the distribution network is is reconfigured afterevery optimal DG linear load pattern is considered and the distribution network reconfigured after optimal DG placement. Efforts been to scan the search space efficiently in such a way that node of linear variable load pattern is considered and the distribution network is reconfigured after optimal DG the system is a candidate node for DG placement with a priority level. The proposed method is applied on placement. Efforts have been been made to placement scan the the search search space efficiently in proposed such aa way way that every every node on of placement. Efforts have made to scan space efficiently in such that node of the system is a candidate node for DG with a priority level. The method is applied placement. Efforts have been to placement scan search space efficiently in proposed such a way that every node of IEEE 33-bus distribution system. The the results obtained arelevel. promising when compared other the system system is candidate nodemade for DG with priority level. The method is with applied on the is aatest candidate node for DG placement with aa priority The proposed method is applied on IEEE 33-bus test distribution system. The results obtained are promising when compared with other the system is atest candidate node for DG placement with a priority level. The proposed method is with applied on recently established methods. IEEE 33-bus distribution system. The results obtained are promising when compared other IEEE 33-bus test distribution The results obtained are promising when compared with other recently established methods. system. IEEE 33-bus test distribution system. The results obtained are promising when compared with other recently established methods. recently established methods. © 2015, IFAC (International Federation of Automaticsearch, Control)network Hosting by Elsevier Ltd. Allsmart rights reserved. Keywords: Distributed generations, intelligent reconfiguration, distribution recently established methods. Keywords: Distributed generations, intelligent search, network reconfiguration, smart distribution systems, teaching learning based optimization. Keywords: Distributed generations, intelligent search, network reconfiguration, smart Keywords: Distributed intelligent search, network reconfiguration, smart distribution distribution systems, teaching learninggenerations, based optimization. Keywords: Distributed generations, intelligent search, network reconfiguration, smart distribution systems, teaching learning based optimization. systems, teaching learning based optimization. systems, teaching learning based optimization. TeacherD,i Position of the teacher at Dth dimension for ith 1. NOMENCLATURE TeacherD,i Position of the teacher at Dth dimension for ith iteration 1. NOMENCLATURE Position of of the the teacher teacher at at Dth Dth dimension dimension for for ith ith TeacherD,i D,i iteration Position Teacher 1. NOMENCLATURE Position ofnode the teacher Dth dimension for ith Teacher NOMENCLATURE Maximum voltage at (p.u.) V D,i iteration max D Number1. of design variables iteration 1. NOMENCLATURE Maximum node voltage (p.u.) V D Number of design variables iteration Minimum node Vmax min E Total branches in the system Maximum node voltage (p.u.) V max Maximum node voltage voltage (p.u.) (p.u.) V D Number of design design variables max Minimum node (p.u.) D Number of variables min E Total branches in the system th Maximum node voltage voltage (p.u.) V Minimum specified node voltage (p.u.) max D Number of design variables minS Energy loss for uncompensated system at j load ELoss Minimum node voltage (p.u.) V bj min th Minimum node voltage (p.u.) V E Total branches in the system min specified node voltage (p.u.) E Total branches in the system minS Energy loss for uncompensated system at j load ELoss Minimum node voltage bj Voltage at the nth node (p.u.) V min th E Total in the system n level branches Minimum specified node voltage V th minS Minimum specified node voltage (p.u.) (p.u.) V Energy loss for uncompensated system at j load ELossbj minS Voltage at the nth node (p.u.) Energy loss for uncompensated system at j load ELoss n th bj level th Minimum specified node(p.u.) voltage (p.u.) V Maximum nodenth voltage deviation at nth node ΔV minS uncompensated system at j load n ELossbj Energy loss for compensated system at j load Voltage at the nth node V aj n th Voltage at the node (p.u.) V level loss for compensated system at j load n n Maximum node voltage deviation at nth node ΔV level ELossaj Energy Voltage at the nth node (p.u.) V (p.u.) n th level Maximum node voltage voltage deviation deviation at at nth nth node node ΔVnn Maximum node ΔV ELoss Energy loss (p.u.) aj ELossaj Energy loss for for compensated compensated system system at at jjth load th load level Maximum node ΔVn Xnew New solution of voltage learner deviation at nth node Energy loss for(p.u.) compensated system at j load Feeder current IELoss (p.u.) aj n (p.u.) level Xnew New of learner level current (p.u.) Feeder In m ax (p.u.)solution level currentcurrent Xnew New solution of of learner learner Rated Xnew New solution Feeder (p.u.) IIInnnm ax Feederfeeder currentcurrent (p.u.) (p.u.) Xold Existing solution of learner Rated feeder (p.u.) Xnew New solution of learner I Feeder current (p.u.) (p.u.) IMean nm ax Xold Existing solution of learner Mean of the learners at Dth dimension for ith Rated feeder current IInnmm ax D,i Rated feeder current (p.u.) ax Mean feeder of the current learners at Dth dimension for ith Mean Xold Existing solution solution of of learner learner Rated (p.u.) D,i I nn Xold Existing iteration Mean of of the the learners learners at at Dth Dth dimension dimension for for ith ith MeanD,i Xold Existing solution of learner Mean Mean D,i iteration Mean of the learners Dth dimension for ith Mean Difference mean of the at learners at Dth dimension ΔMean D,i 2. INTRODUCTION iteration iteration Difference mean of the learners at Dth dimension ΔMeanD,i 2. INTRODUCTION D,i iteration for ith iteration Difference mean of of the the learners learners at at Dth Dth dimension dimension ΔMeanD,i 2. INTRODUCTION INTRODUCTION Difference mean ΔMean 2. D,i for ith iteration meannodes of thefor learners at Dth dimension The existing distribution ΔMeanD,i Difference 2. INTRODUCTION Set ith of candidate DGs placement N systems are moving towards smart for iteration for ith iteration Set of candidate nodes for DGs placement NDG The existing distribution systems are moving towards smart DG for ith iteration N Number of system nodes distribution systems to achieve socio economic and Set of candidate nodes for DGs placement N The existingsystems distribution systemslarger are moving moving towards smart smart DG Set of candidate nodes for DGs placement NDG The existing distribution systems are towards Number of system nodes distribution to achieve larger socio economic and Set of candidate nodes for DGs placement N Number of load levels The existing distribution systems are moving towards smart DG other non-tangible benefits. The potential promise of the L N Number of system nodes distribution systemsbenefits. to achieve achieve larger sociopromise economic and NL system nodes distribution systems to larger socio economic and Number of load levels other non-tangible The potential of the N Number of system nodes distribution systems to achieve larger socio economic and Branch number nN smart grid includes improved reliability and power quality, Number of load levels other non-tangible benefits. The potential promise of the L Number of load levels other non-tangible benefits. The potential promise of the L Branch number nN smart grid includes improved reliability and power quality, Number of load limit levelsat one candidate node (kW) NDG other non-tangible benefits. The potential promise of the DG penetration L reduction in peak demand, reduction in transmission Branch number nnP smart grid includes improved reliability and power quality, Branch number limit at one candidate node (kW) smart grid in includes improved reliability andinpower quality, DG penetration P reduction peak demand, reduction transmission DG Branch number nP smart grid in includes improved reliability andinpower quality, Maximum DG penetration for thenode system congestion costs, increased energy efficiency, better asset DG penetration limit at at one onelimit candidate (kW) PDG,max reduction peak demand, reduction DG DG penetration limit candidate (kW) P reduction in peak demand, reduction in transmission transmission DG Maximum DG penetration limit for thenode system congestion costs, increased energy efficiency, better asset DG,max DG penetration limit at one candidate node (kW) P reduction in peak demand, reduction in transmission (kW) DG utilization, ability to accommodate more renewable energy, Maximum DG penetration penetration limit limit for for the the system system PDG,max congestion costs, energy efficiency, better asset Maximum DG P congestion costs, increased increased energy more efficiency, betterenergy, asset (kW) utilization, ability to accommodate renewable Maximum DG penetration penetration limit limit for for the the system system PDG,max congestion costs, increased energy efficiency, better asset Minimum DG DG,max etc. (El-Hawary, 2014). The present trend towards DG,min (kW) utilization, ability to accommodate more renewable energy, (kW) utilization, ability to accommodate more renewable energy, Minimum DG penetration limit for the system PDG,min etc. (El-Hawary, 2014). The present trend towards utilization, ability to accommodate more renewable energy, (kW) deregulation in power sector is forcing electric distribution Minimum DG penetration penetration limit limit for for the the system system PDG,min etc. (El-Hawary, 2014). The present trenddistribution towards Minimum DG P etc. (El-Hawary, 2014). present trend towards DG,min (kW) deregulation in power sector The is forcing electric Minimum DG penetration limitof forthe thesystem system etc. (El-Hawary, 2014). The present trend towards PDG,min Nominal active power demand utilities to improve their energy efficiencies for cost cutting (kW) deregulation in power sector is forcing electric distribution (kW) deregulation in power sector is forcing electric distribution PDD Nominal active power demand of the system utilities to improve theirsector energy efficiencies for cost cutting (kW) deregulation in power is forcing electric distribution whereas customers are becoming more sensitive to reliability P Nominal active power demand of the system utilities to to improve are their energy efficiencies efficiencies for to cost cutting PDD Nominal active power demand of the system utilities improve their energy for cost cutting (kW) whereas customers becoming more sensitive reliability P Nominal active power demand of the system utilities to improve their energy efficiencies for cost cutting PF Node deviation penalty factor D and power quality. are Further, the scarcity of fossil fuels and (kW) whereas customers becoming more sensitive to reliability (kW) voltage whereas customers are becoming more sensitive to reliability PF Node voltage deviation penalty factor and power quality. Further, the scarcity of fossil fuels and (kW) whereas customers are becoming more sensitive to reliability Feeder power loss (kW) P strict environmental issues enforce electric utilities to tap loss PF Node voltage deviation penalty factor and power quality. Further, the scarcity of fossil fuels and PF Node voltage deviation penalty factor and power quality. Further, the scarcity of fossil fuels and Feeder power loss (kW) P strict environmental issues enforce electric utilities to tap loss PF Node voltage deviation penalty factor and power quality. Further, theavailable scarcity ofaccordance fossil fuels and energy whatever and wherever in to the Real power flow at sending end of the nth branch Feeder power loss (kW) P n strict environmental issues enforce electric utilities to tap loss Feeder power loss (kW) P strict environmental issues enforce electric utilities to tap loss energy whatever and wherever available in accordance to the P Real power flow at sending end of the nth branch n Feeder power loss (kW) Ploss strict environmental issues enforce electric utilities to tap philosophy of smart grids. To achieve these applications, the (kW)power energy whatever and wherever available in to the P Real energy whatever and grids. wherever available in accordance accordance to the Pnn Real power flow flow at at sending sending end end of of the the nth nth branch branch philosophy of smart To achieve these applications, (kW) energy whatever and wherever available in accordance to last the P Real power flowflow at sending end end of the nth branch penetration level of DGs has been increased during the Qnn Reactive power at sending of the nth philosophy of smart grids. To achieve these applications, the (kW) philosophy of smart grids. To achieve these applications, the (kW) penetration level of DGs has been increased during the last Qn Reactive power flow at sending end of the nth philosophy of smart grids. To achieve these applications, the (kW) few years. It is widely acknowledged that strategically placed branch (kVAr) penetration level of DGs DGs has been been increased increased during the the last Q Reactive power penetration of has during last Qnn Reactive power flow flow at at sending sending end end of of the the nth nth few years. Itlevel is widely acknowledged that strategically placed branch (kVAr) penetration level of DGs been increased during last Qnn Reactive power sending and operated DG units canhas yield several benefits suchthe as loss Resistance of theflow nth at branch (Ω)end of the nth R few years. It is widely acknowledged that strategically placed branch (kVAr) few years. It is widely acknowledged that strategically placed branch (kVAr) and operated DG units acknowledged can yield several benefits such as loss Resistance of the nth branch (Ω) Rn few years. It is widely that strategically placed branch (kVAr) TF Teaching factor at Dth dimension for ith iteration D,i and operated operated DG DG units units can can yield yield several several benefits benefits such such as as loss loss Resistancefactor of the the nth nth branch (Ω) for ith iteration R and n Resistance of branch (Ω) R n D,i TF Teaching Dth dimension and operated DG units can yield several benefits such as loss Resistancefactor of theat nth branch (Ω) for ith iteration R n TF Teaching at Dth dimension D,i TF Teaching factor at Dth dimension for ith iteration TFD,i Teaching D,i Copyright © 2015 IFAC factor at Dth dimension for ith iteration 25 Copyright 2015 IFAC 25 Hosting by Elsevier Ltd. All rights reserved. 2405-8963 © 2015, IFAC (International Federation of Automatic Control) Copyright ©under 2015 responsibility IFAC 25 Control. Peer review© of International Federation of Automatic Copyright 2015 IFAC 25 Copyright © 2015 IFAC 25 10.1016/j.ifacol.2015.12.348
IFAC CPES 2015 26 December 9-11, 2015. Delhi, India
Neeraj Kanwar et al. / IFAC-PapersOnLine 48-30 (2015) 025–030
feeder topological structure by managing the open/close status of sectionalizing and tie-switches under contingencies or normal operating conditions (Swarnkar et al., 2011). Changing the network topology by reallocating loads from one feeder to another may balance loads among the feeders and decrease the real power losses (Guimaraes et al., 2010). Therefore, this is another resource which can be utilized in conjunction with optimal placement of DGs in distribution systems.
reduction, voltage and reliability enhancement, and network upgrade deferral, while on the other hand, improper placement and operations of DG units in some circumstances may reduce benefits and even jeopardize the existing systems (Hung et al., 2013). The optimal DG allocation problem involves the determination of sizing and siting of DGs to meet out desired objectives while satisfying several operational and network constraints. It is a mixed integer, non-linear, complex combinatorial optimization problem and has been solved successfully using various modern stochastic-based techniques such as particle swarm optimization (PSO) (ElZonkoly et al., 2013; Kayal and Chanda, 2013; Kansal et al., 2013), artificial bee colony (ABC) (Abu-Mouti and ElHawary, 2011), genetic algorithm (GA) (Celli et al., 2005; Shukla et al., 2010), evolutionary programming (EP) (Khatod et al., 2013), bacterial foraging optimization (BFO) (Mohamed and Kowsalya, 2014), harmony search algorithm (HSA) (Kollu et al., 2014); Rao et al., 2013), cuckoo search algorithm (CSA) (Moravej and Akhlaghi, 2013), etc. However, these techniques are associated with their own intrinsic disadvantages and that probably leads to premature convergence. Moreover, these optimization techniques require tuning of their algorithm-specific parameters. The tuning of parameters is not only computationally demanding but also very crucial, as it may affect their overall performance.
In this paper, the optimal DG integration problem of distribution systems for energy loss minimization with node voltage constraints is formulated keeping in view the network reconfiguration to provide a more realistic picture. The multiobjective problem is framed to maximize annual energy loss reduction and to maintain a better node voltage profile using penalty factor approach while considering piece-wise linear load pattern. The problem is optimized using a TLBO based method wherein the search space is effectively and efficiently scanned without loss of diversity by proposing an intelligent search approach. The optimal dispatches of DGs are determined at each load level separately and are placed in the distribution network which is then reconfigured to further maximize the benefits. 3. PROBLEM FORMULATION The objective function F is formulated to maximize the annual energy loss reduction while maintaining a better node voltage profile using penalty factor approach and is defined as:
TLBO is one of the potential swarm intelligence-based algorithms developed by (Rao et al. 2011). It has gained popularity with its effective applications to many real-life optimization problems, such as multi-objective placement of the automatic regulators in the distribution system, data clustering, environmental economic problems, optimization of planar steel frames, dynamic economic dispatch problems, and 3-D image registration, etc. (Savsani et al. 2014). The prominent feature of TLBO is that it is free from algorithmspecific parameters and requires only common control parameters like population size and maximum iterations. This makes it a class apart than other stochastic-based optimization techniques.
NL
NL
j 1
j 1
M ax F P F ( E L oss bj E L oss aj )
(1)
where, PF is the node voltage deviation penalty factor, which is given by PF = 1/(1+ (Max (ΔVn))) where, 1 V n ; V m in s V n V m in Vn 0 ; V m in V n V m a x a very larg e n u m b er ; else
(2)
(3)
The problem is computationally demanding, as the search for the best combination amongst the various possible combinations for the DG allocation is computationally arduous even for a small distribution system (Khatod et al. 2013). Therefore, many researchers (Khatod et al, 2013; Kollu et al., 2014; Rao et al., 2013; Acharya et al., 2006; Naik et al., 2013; Das, 2008) have squeezed the problem search space by reducing the number of candidate nodes for DG placement using a suitable node sensitivity approach. In these approaches, a node priority list is obtained from which only top few candidate nodes are selected to redefine the problem search space. However, the sensitivities are normally calculated for the base case conditions, where no such devices have been installed (Gallego et al. 2001).
According to (3), only those DG topologies will be accepted which keep the node voltages within Vmins and Vmax. This allows those candidate solutions having node voltages between Vmin and Vmins. In this way, the whole burden of node voltage profile enhancement is not imposed on optimal DG placement as the network reconfiguration can also enhance the voltage profiles of distribution systems, subject to the following operational constraints:
Distribution networks are reconfigured frequently with the changing operating conditions. This is one of the effective means to improve their performance. It is a process that alters
PDG,min ≤ PDG ≤ PDG,max ∑PDG ≤ PD NDG,a ≠ NDG,b; a, b N
g(h) = 0 In I
26
max n
(4) (5) (6) (7) (8)
IFAC CPES 2015 December 9-11, 2015. Delhi, India
Neeraj Kanwar et al. / IFAC-PapersOnLine 48-30 (2015) 025–030
XnewD,i = XoldD,i + ΔMeanD,i
Equation (4) represents the set of power flow equations. The feeder current and node compensation limits are restricted by (5) and (6), respectively. The system compensation limit is defined by (7), whereas any repetition of candidate nodes is prohibited by (8).
2
In this phase, each learner improves his or her knowledge by interacting randomly with other learners. A learner learns new things if the other learners have more knowledge than him or her. For the ith iteration, two students, Xf and Xk; f ≠ k, are chosen randomly. If they have better knowledge than the learner XoldD,i, the difference between them is added to update leaner’s knowledge according to following relations:
M in . Ploss
R
2
Pn + Q n n
n 1
Vn
2
(9)
(10)
Vmax ≥ Vn ≥ Vmin
(11)
In the present work, the codification proposed in (Swarnkar et al., 2011) is used to solve the network reconfiguration problem. This is a rule-based codification to check and correct infeasible radial topologies while attempting this problem.
In this phase, learners learn through the teacher who tries to improve the existing mean result MeanD,i of the class at ith iteration towards him or her so let the new mean is TeacherD,i. The difference of the mean results is then evaluated as below (Rao and Patel, 2013):
(13)
(16)
In the present work, candidate nodes are selected by proposing an intelligent search approach. The proposed approach is different than the conventional one in the sense that the node sensitivity is observed in terms of the change in objective function to be optimized, instead of the change in power loss. Moreover, the system nodes are arranged in the decreasing order of change in the objective function and then the candidate nodes are selected from this list using Roulette Wheel Selection. In this way the nodes are selected according to their probability of priority. This approach reserves the right of each system node to remain in the problem search space during the computational process. Therefore, the problem search space is virtually squeezed without loss of diversity.
4.1 Teacher Phase
TFD,i= MeanD,i / Teacher D,i The dimension is updated using the relation (14).
XnewD,i = XoldD,i + rand (Xf – Xk): f(Xk) < f(Xf)
While initializing, or otherwise, it is always better if all the tentative solutions spread in such a way that most of them lie near the area where the global optima may exist. But, this is a difficult task. Nevertheless, a sufficient diversity is essential to explore new solution points in the problem search space. Several researchers (Acharya et al., 2006; Das, 2008; Khatod et al., 2013; Rao et al., 2013; Naik et al., 2013; Kollu et al., 2014) have applied perturbation based node sensitivity approach to get the node priority list for optimal allocation of distributed resources and then selecting top few nodes from it to redefine the problem search space. However, the sensitivities are normally calculated for the base case conditions, where no such device has been installed (Gallego et al., 2001). Furthermore, when selecting only top nodes as the sensitive components, it did not give the true picture of the entire distribution network (Haldar and Chakraborty, 2013). Therefore, such approaches are unreliable and may cause erroneous results.
TLBO is inspired by the passing on knowledge within a classroom environment where learners first acquire knowledge from the teacher and then from the classmates (Bouchekara et al., 2014). TLBO initiates with a group of tentative solutions, called learners, randomly dispersed in the problem search space. In the due course of time, these learners update their knowledge (fitness) through two stage learning process, i.e. ‘Teacher phase’ and the ‘Learner phase’. The ever best learner obtained through the iterative process is considered as the final solution. The prominent feature of TLBO is that unlike other optimization techniques it does not require any algorithm parameters to be tuned. Moreover, it uses the mean value of the population to update the solution and have greediness to accept a good solution, as in ABC (Rao et al., 2011). The learning phases of TLBO can be summarized as below.
(12)
(15)
5. INTELLIGENT SEARCH
4. TEACHING LEARNING BASED OPTIMIZATION
ΔMeanD,i = rand(TeacherD,i –TFD,i×MeanD,i) where, TFD,i is the teaching factor given by:
XnewD,i = XoldD,i + rand (Xk – Xf): f(Xf) < f(Xk)
For each phase, accept updated learner only when it provides better function value. There is no need to preserve the elite child as TLBO has greediness to accept a good solution at each stage. The algorithm terminates when either the maximum generation count is exhausted or all solutions acquire the same fitness.
Subject to constraints defined by (4)-(5) along with radial topology and node voltage constraints as given below: Ф(r) = 0
(14)
4.2 Learner Phase
The distribution network is reconfigured after optimally placing DGs. The reconfiguration problem is solved to minimize real power loss while satisfying various network operational constraints. The mathematical formulation of reconfiguration problem for loss minimization is formulated as below: E
27
27
IFAC CPES 2015 December 9-11, 2015. Delhi, India 28
Neeraj Kanwar et al. / IFAC-PapersOnLine 48-30 (2015) 025–030
Table 1. Initial data of 33-bus system
6. SIMULATION RESULTS
Particulars Sectionalizing Switches Base Configuration (open lines) Line Voltage (kV) Nominal Active Demand (kW) Nominal Reactive Demand (kVAr) Ploss at Light/Nominal/Peak load (kW) Vmin at Light/Nominal/Peak load (p.u.)
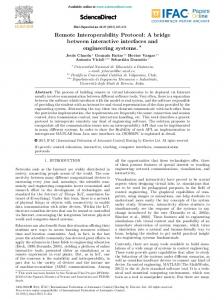
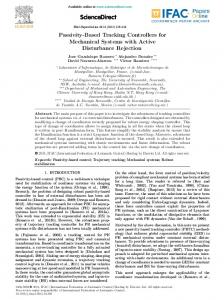
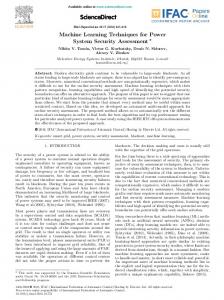
The proposed method is applied on 33-bus test distribution system. Single line diagram of the system is shown in Fig. 1. The initial configuration and nominal data of the system is given in Table 1. The detailed system data may be referred from (Baran and Wu, 1989). The annual load profile is assumed to be piecewise segmented in three load levels (LL), i.e., light (L), nominal (N) and peak (P) which are 50%, 100% and 160% of the nominal system load and the corresponding load durations are taken as 2000, 5260 and 1500 hours, respectively (Das, 2008). The maximum DG capacity at single node is taken 2 MW as in (Rao et al., 2013; Imran et al., 2014). It has been assumed that the power dispatch is available in the steps of 1kW. After usual tradeoff a population size of 10 and maximum iterations of 100 are set for this system. Following three different scenarios are considered for simulation.
Value 1-32 33-37 12.66 3715 2300 47.06/202.67/575.39 0.9583/0.9131/0.8528
Table 2. Comparison results for different scenarios S Particulars
• Scenario-3 Network reconfiguration after DG allocation
1 Optimal Configuration Ploss (kW) Vmin (p.u.) 2 DG allocation MW (Node)
The scenario in which the distribution network is first reconfigured and then optimal DGs are placed (Rao et al., 2013; Imran et al., 2014) is not considered in this work, as the network reconfiguration is the problem of system operation whereas the optimal allocation of DGs is the problem of system planning.
Ploss (kW) Vmin (p.u.) 3 Optimal Configuration Ploss (kW) Vmin (p.u.)
• Scenario-1 After network reconfiguration • Scenario-2 After optimal DG allocation
Light 7-9-14-3237 33.27 0.9698 0.374(14), 0.541(24), 0.530(30) 17.33 0.9845 7-8-9-3237 14.03 0.9853
Load Levels Nominal 7-9-14-3237 139.52 0.9378 0.752(14), 1.097(24), 1.068(30) 71.45 0.9686 7-8-9-3237 57.48 0.9703
A Peak 7-9-14-3237 379.95 0.8968 0.767(14), 1.097(24), 1.158(30) 233.61 0.9203 7-9-13-2832 170.78 0.9422
32. 24
62. 38
71. 00
S: Scenario, A: Percentage annual energy loss reduction
Table 3. Comparison of nominal power loss Scenario
2 3
GA (Rao et al., 2013) 100.1 98.36
Nominal Power Loss (kW) RGA HSA FWA (Rao et (Rao et (Imran al., al., et al., 2013) 2013) 2014) 97.6 96.76 88.68 98.23 97.13 68.28
TLBO
71.45 57.48
Table 4. Comparison of percentage annual energy loss reduction
Fig. 1. Single line diagram of 33-bus radial distribution system
Scenario Table 2 shows the best allocation of DGs obtained after 100 independent trials of TLBO. The table shows power loss, minimum node voltage and the percentage annual energy loss reduction. It can be observed from the table that annual energy loss is reduced substantially by 71 % and the minimum node voltage at peak load is improved from 0.8528 p.u. to 0.9422 p.u. in scenario-3. The optimal configurations for this scenario may also be referred from the table showing open lines for the radial topologies. It can be depicted from the table that the optimal network configuration is affected by the presence of DGs in distribution network.
2 3
Percentage Annual Energy loss Reduction HSA (Rao et FWA (Imran et TLBO al., 2013) al., 2014) 53.17 57.16 62.38 53.15 67.16 71.00
In order to show the effectiveness of TLBO, the results obtained are compared with other available established methods in Table 3. The table compares nominal power loss for scenario-2 and scenario-3, respectively. It can be observed from the table that TLBO is better than GA (Rao et al., 2013), RGA (Rao et al., 2013), HSA (Rao et al., 2013), and FWA (Imran et al., 2014). This is true for both scenarios. Further, the annual energy loss reduction is compared with HSA (Rao et al., 2013) and FWA (Imran et al., 2014) in Table 4. It can 28
IFAC CPES 2015 December 9-11, 2015. Delhi, India
Neeraj Kanwar et al. / IFAC-PapersOnLine 48-30 (2015) 025–030
29
The proposed TLBO explores and exploits the problem search space in much better way and thus converges to global or near global optima. This may attribute to the fact that the proposed formulation considers all load levels simultaneously, whereas other methods consider them individually. Moreover, the proposed intelligent search approach scans search space in such a manner that more candidature is provided to those nodes which are most prone for DG placement. This may causes early invasion of the individuals in the promising region and then they exploit it rigorously owing to enhanced searching potential of teaching-learning phases of TLBO.
be observed from the table that TLBO performs better than other techniques for both scenarios.
Table 5. Solution quality of TLBO Method TLBO
Best Fitness 1105343.97
Worst Fitness 1094932.90
Mean Fitness 1105205.43
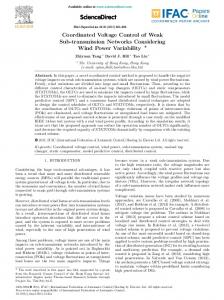
Fig. 2. Node voltage profiles for different scenarios It is noteworthy that the proposed TLBO has shown better performance than other recently established swarm intelligence based methods. The best solution explored is entirely different than other methods, as presented for comparison in Table 6. The solution explored by TLBO is better than other methods under identical system design conditions. This shows superiority of the proposed method.
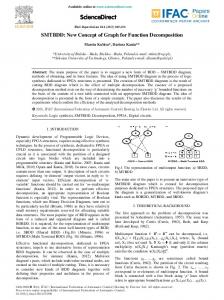
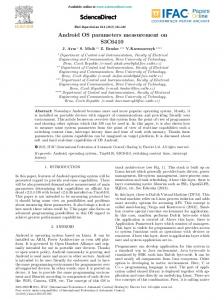
The node voltage profiles of the system, at peak load level, for all the three scenarios are shown in Fig. 2 and are also compared with the base case conditions. It can be observed from the figure that the node voltage profile is improved significantly for all three scenarios, but all node voltages approach to satisfactory level only in scenario-3. Therefore, the network performance is better in scenario-3 than other scenarios.
Table 6. Comparison of optimal solutions LL
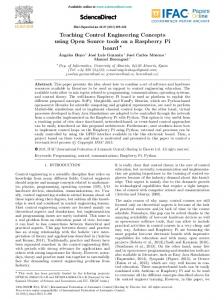
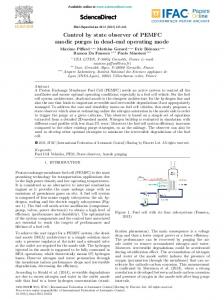
7. DISCUSSION The convergence characteristics of TLBO for best and mean fitness are shown in Fig. 3. It may be depicted from the convergence for mean fitness that all learners approaching towards the promising region at early stage of the computation and finally all of them converge near or at the global best. The convergence for best fitness shows that the best learner rushes towards the promising region very quickly and then it avoids multiple local trappings to obtain global or near global optima.
L
N
P
HSA (Rao et al., 2013) Node DG Capacity (MW) 32 0.1015 31 0.1843 30 0.2568 32 0.2686 31 0.1611 30 0.6612 32 0.2443 31 0.3068 30 1.2185
FWA (Imran et al., 2014) Node DG Capacity (MW) 32 0.5072 18 0.0947 14 0.2948 32 1.0146 18 0.1895 14 0.5897 32 1.6784 18 0.3013 14 0.9441
TLBO Node
30 24 14 30 24 14 30 24 14
DG Capacity (MW) 0.5300 0.5410 0.3740 1.0680 1.0970 0.7520 1.1580 1.0970 0.7670
8. CONCLUSIONS The optimal allocation of DGs in distribution systems is now becoming important due to economic and environmental issues, and also to enhance its performance and customers’ satisfaction in deregulated environment. This paper addresses the optimal allocation of DGs in distribution systems using TLBO method. The proposed formulation for DG allocation effectively minimizes the annual energy losses while providing better node voltage profiles considering piece-wise load variations. The effect of network reconfiguration is also investigated after optimal DG placement. The proposed intelligent search approach causes virtual squeezing of the search space that maintains a requisite amount of diversity. This improves accuracy and efficiency of the optimization technique. The special feature of TLBO observed is that its optimization process has greediness to accept good solution and that makes it different from other optimization techniques. The application results show that there is a significant improvement in the desired objectives. The application results are also compared with several recently
Fig. 3. Convergence characteristics of TLBO The solution quality of TLBO obtained after 100 trails is presented in Table 5 showing closely spaced best, mean and worst fitness. The standard deviation and coefficient of variance obtained are 1072.12 and 0.09, respectively for the sample of solutions. These indices are found to be well within reasonable limits and show that all solutions are close to the mean solution. Thus, TLBO is capable to generate good quality solutions. 29
IFAC CPES 2015 30 December 9-11, 2015. Delhi, India
Neeraj Kanwar et al. / IFAC-PapersOnLine 48-30 (2015) 025–030
established techniques showing promising results. TLBO has shown better solution quality and convergence characteristic.
Kansal, S., Kumar, V. and Tyagi, B. (2013). Optimal placement of different type of DG sources in distribution networks. Int. J. Electr. Power and Energy Syst., 53, 752–760, Dec. Kayal, P. and Chanda, C. K. (2013). Placement of wind and solar based DGs in distribution system for power loss minimization and voltage stability improvement. Electr. Power and Energy Syst., 53, 795–809, Dec. Khatod, D. K., Pant, V., and Sharma, J. (2013). Evolutionary programming based optimal placement of renewable distributed generators. IEEE Trans. Power Syst., 28 (2), May. Kollu, R., Rayapudi, S. R., and Sadhu, V. L. N. (2014). A novel method for optimal placement of distributed generation in distribution systems using HSDO. Int. Trans. Electr. Energy Syst., 24 (4), 547-561, Apr. Mohamed, I. A., and Kowsalya, M. (2014). Optimal size and siting of multiple distributed generators in distribution system using bacterial foraging optimization. Swarm and Evolut. Comput., 15, 58-65, Apr. Moravej, Z., and Akhlaghi, A. (2013). A novel approach based on cuckoo search for DG allocation in distribution network. Int J. Electr. Power and Energy Syst., 44 (1), 672–679, Jan. Naik, S. G., Khatod, D. K., and Sharma, M. P. (2013).Optimal allocation of combined DG and capacitor for real power loss minimization in distribution networks. Int. J. Electr. Power and Energy Syst., 53, 967–973, Dec. Rao, R. S., Ravindra, K., Satish, K., and Narasimham, S. V. L. (2013). Power loss minimization in distribution System using network reconfiguration in the presence of distributed generation. IEEE Trans. Power Syst., 28 (1), Feb. Rao, R. V., and Patel, V. (2013). Multi-objective optimization of two stage thermoelectric cooler using a modified teaching–learning-based optimization algorithm. Eng. Appl. of Artif. Intell., 26 (1), 430–445, Jan. Rao, R. V., Savsani, V. J., and Vakharia, D. P. (2011).Teaching–learning-based optimization: A novel method for constrained mechanical design optimization problems. Comput.-Aided Design, 43(3), 303–315, Mar. Savsani, P., Jhala, R. L., and Savsani, V. J. (2014). Comparative study of different metaheuristics for the trajectory planning of a robotic arm. IEEE Syst. J., 99, 1– 12, July. Shukla, T. N., Singh, S. P., Srinivasarao, V., and Naik, K. B. (2010). Optimal sizing of distributed generation placed on radial distribution systems. Electr. Power Compon. and Syst., 38 (3), 260-274, Jan. Swarnkar, A., Gupta, N., and Niazi, K. R. (2011). A novel codification for meta-heuristic techniques used in distribution network reconfiguration. Electr. Power Syst. Res., 81(7), 1619–1626, July.
REFERENCES Abdi, S. and Afshar, K. (2013). Application of IPSO-monte carlo for optimal distributed generation allocation and sizing. Int J. Electr. Power and Energy Syst., 44 (1), 786–797, Jan. Abu-Mouti, F. S. and El-Hawary, M. E. (2011).Optimal distributed generation allocation and sizing in distribution systems via artificial bee colony algorithm. IEEE Trans. Power Deliv., 26 (4), 2090-2101, Oct. Acharya, N., Mahat, P., and Mithulananthan, N. (2006). An analytical approach for DG allocation in primary distribution network. Int. J. Electr. Power and Energy Syst., 28 (10), 669–678, Dec. Baran, M. E., and Wu, F. (1989), Network reconfiguration in distribution system for loss reduction and load balancing. IEEE Trans. Power Deliv., 4 (2), 1401–1407, Apr. Bouchekara, H. R. E. H., Abido, M. A., and Boucherma, M. (2014). Optimal power flow using teaching-learningbased optimization technique. Electr. Power Syst. Res., 114, 49–59, Sep. Celli, G., Ghiani, E., Mocci, S., and Pilo, F. (2005). A multiobjective evolutionary algorithm for the sizing and siting of distributed generation. IEEE Trans. Power Syst., 20 (2), May. Das, D. (2008). Optimal placement of capacitors in radial distribution system using a Fuzzy-GA method. Int J. Electr. Power and Energy Syst., 30 (6-7), 361–367, July– Sep. El-Hawary, M. E. (2014). The smart grid—state-of-the-art and future trends. Electr. Power Compon. and Syst., 42( 3–4), 239–250, Mar. El-Zonkoly, A. M. (2011). Optimal placement of multidistributed generation units including different load models using particle swarm optimization. IET Gener. Transm. & Distrib., 5 (7), 760–771. Gallego, R. A., Monticelli, A. J., and Romero, R. (2001). Optimal Capacitor Placement in Radial Distribution Networks. IEEE Trans. Power Syst., 16 (4), Nov. Guimaraes, M. A. N., Castro, C. A., and Romero, R. (2010). Distribution systems operation optimization through reconfiguration and capacitor allocation by a dedicated genetic algorithm. IET Gener. Transm. & Distrib., 4 (11), 1213-1222. Haldar, V., and Chakraborty, N. (2013). Power loss minimization by optimal capacitor placement in radial distribution system using modified cultural algorithm. Int. Trans. Electr. Energy Syst. Hung, D. Q., Mithulananthana, N., and Bansal, R. C. (2013). A combined practical approach for distribution system loss reduction. Int. J. of Ambient Energy. Imran, A. M., Kowsalya, M., and Kothari, D. P. (2014). A novel integration technique for optimal network reconfiguration and distributed generation placement in power distribution networks. Int J. Electr. Power and Energy Syst., 63, 461–472, Dec.
30