When the red/green ratio passed through equilu- minance, the direction of ... minance), and we shall show that this motion is suf- ficient to drive optokinetic ...
No. 4
463
Reporrs
appear similar in a number of respects to the receptor potential that is seen following incubation of the retina with isobutylmethylxanthine, an inhibitor of phosphodiesterase. These similarities include an increase in latency, a decrease in rate of rise and amplitude, and a slowing of the off-response of the receptor potential. On this basis, we asked whether oxidation of GSH by diamide alters the level of cyclic nucleotides in a manner similar to isobutylmethylxanthine. While inhibition of phosphodiesterase is known to lead to a general increase in the concentrations of cyclic GMP and cyclic AMP, we find that diamide specifically decreases the level of cyclic GMP, reducing its dark-light difference, without significantly affecting the concentration of cyclic AMP. This makes it unlikely that the electrical changes in the receptor potential produced by diamide, although superficially similar to those produced by isobutylmethylxanthine, are produced through the same mechanism. The relationships of these processes are yet unknown, but are of potential importance in understanding normal and abnormal photoreceptor function. Key words: guanosine 3',5' monophosphate (cyclic GMP), adenosine 3',5' monophosphate (cyclic AMP), retina, diamide, glutathione oxidation, dark-adapted, light-adapted Acknowledgment. The authors thank Ms. Roxanne M. Bowman for excellent secretarial assistance.
From the Institute of Biological Sciences, Oakland University, Rochester, Michigan and the National Eye Institute, Bethesda, Maryland. Supported in part by Grant EY-01219 from the National Institutes of Health and by a Grant from the Michigan Eye Bank. Submitted for publication: January 19, 1983. Reprint requests: Dr. Barry S. Winkler, Institute of Biological Sciences, Oakland University, Rochester, MI 48063.
References 1. Fletcher RT and Chader GJ: Cyclic GMP: control of concentration by light in retinal photoreceptors. Biochem Biophys Res Comm 70:1297, 1976. 2. Miki N, Keirns J, Marcus F, Freeman J, and Bitensky M: Regulation of cyclic nucleotide concentrations in photoreceptors: an ATP-dependent stimulation of cyclic nucleotide phosphodiesterase by light. Proc Natl Acad Sci USA 70:3820, 1973. 3. Chader G, Herz L, and Fletcher R: Light activation of phosphodiesterase activity in retinal rod outer segments. Biochim Biophys Acta 347:491, 1974. 4. Cohen AI, Hall IA, and Ferrendelli JA: Calcium and cyclic nucleotide regulation in incubated mouse retinas. J Gen Physiol 71:595, 1978. 5. Winkler BS and Giblin FJ: Glutathione oxidation in retina: effects on biochemical and electrical activities. Exp Eye Res 36:287, 1983. 6. Winkler BS: Glycolytic and oxidative metabolism in relation to retinal function. J Gen Physiol 77:667, 1981. 7. Orr HT, Lowry OH, Cohen AI, and Ferrendelli JA: Distribution of 3':5'-cyclic AMP and 3':5'-cycIic GMP in rabbit retina in vivo: selective effects of dark and light adaptation and ischemia. Proc Natl Acad Sci USA 73:4442, 1976.
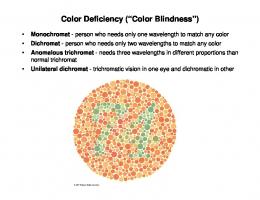
Screening for Color Blindness Using Optokinetic Nystogmus Patrick Cavanagh,* Sfuarr Ansris.f and George Marherf Red/green luminosity ratios were determined by a new method. A special colored grating of red and green bars appeared to move to the left (or right) when the red bars were darker (or lighter) than the green bars. Optokinetic nystagmic eye movements (OKN) elicited by this stimulus could be measured photoelectrically, or by directly watching the subject's eyes. When the red/green ratio passed through equiluminance, the direction of apparent movement (AM) and of OKN reversed in direction. Protans needed more red than normals to reach equiluminance, and deutans needed more green. This OKN method might be applied to nonverbal subjects such as infants and animals. Invest Ophthalmol Vis Sci 25:463-466, 1984
There are several established techniques for measuring color blindness. The Ishihara and American Optical (AO) pseudo-isochromatic plates and the Rayleigh anomaloscope rely upon the shifts in apparent hues seen by the color blind. These methods work well
for cooperative human adults: the pseudo-isochromatic plates require that the subject can read, and the anomaloscope requires him to make psychophysical adjustments. Measuring color blindness in nonverbal subjects such as infants and animals is much harder and typically requires discrimination learning techniques.1 Color blindness affects not only apparent hue, but also apparent brightness. A red-blind individual will see red colors as significantly darker than a normal subject. The relative luminosity of red and green measured with flicker photometry 23 gives three different distributions, one for red-blind (protan), one for greenblind (deutan), and one for normal subjects, although the deutan distribution overlaps somewhat with the normals. 34 We have devised a new method of measuring red/ green luminosity ratios that potentially could yield an
464
INVESTIGATIVE OPHTHALMOLOGY 6 VISUAL SCIENCE / April 1984
LUMINANCE
T1
VARIABLE
T2
FIXED 7/W/WW///////M
T3
T4
G
VARIABLE
Y
Y
objective measure of color blindness in nonverbal populations. A computer-generated television display presents a colored movie whose direction of apparent motion 5 depends on the red/green ratio (eg, left for green brighter, right for red brighter, no motion at equiluminance), and we shall show that this motion is sufficient to drive optokinetic nystagmus (OKN) in which the eyes follow the moving stripes. OKN, which is of proven value for assessing color vision defects in adults, 67 has been elicited from infants1 to measure their acuity etc., and we propose that OKN evoked by our stimulus could give a direct, objective measure of color blindness. Materials and Methods. Subjects were 28 students and research workers, comprising 7 protans, 11 deutans, and 10 normals, all of whom had given their informed consent prior to participation. Subjects were assessed as red-defective (protans) or green-defective (deutans) by screening them with the Ishihara and American Optical pseudo-isochromatic plates. The stimulus involved the alternation of red/green gratings with luminance gratings.8 A colored squarewave grating of red and green stripes is briefly presented and then replaced by an overlapping grating of light and dark yellow stripes displaced by half a bar width to the right (Fig. 1). Apparent motion is seen, in a direction that depends upon the relative brightness of the red and green stripes. If the red stripes are darker than the green, the red stripes are seen as jumping to the left into the succeeding dark stripes (Fig. 1). If the red stripes are lighter than the green they appear to
FIXED
Vol. 25
Fig. 1. Four colored gratings were exposed in a repetitive sequence, at ti mes T1 through T4, on the screen of a computer-controlled TV. Positions of the gratings were superimposed, not displaced vertically as illustrated. Each grating was displaced sideways by a one-quarter cycle (half a bar width) from its predecessor. Direction of apparent motion, shown by the arrows, depended on the luminance, a, When the red bars were darker than the green bars, the dark red bars in the grating at time Tl (or T3) appeared to jump leftward to the dark yellow bars in the grating at time T2 (or T4). b, Cpnversely when the red bars were lighter than the green bars they appeared to jump rightward to the light yellow bars.
jump to the right, into the succeeding light stripes (Fig. 1). If the red and green stripes are equally bright, then no motion is seen. Adding two more gratings produces a continuous four-stroke cycle, like a movie four frames long, which is displayed on a good quality TV monitor controlled by a computer. Frames 1 and 3 are gratings of red and green stripes, and frames 2 and 4 are gratings of light and dark yellow stripes. The cycle repeats endlessly, giving an impression of continuous, apparent motion. This stimulus is known to give accurate and reliable estimates of the red/green luminosity ratio, which agree well with estimates from conventional minimum flicker techniques, and which vary with spatial frequency: at higher spatial frequencies the luminous efficiency goes up for red and down for green.8 In order to determine the red/green luminosity ratio for which the direction of motion reversed, the ratio was swept slowly back and forth. Thus it started low with green much brighter than red, and the red luminance gradually increased linearly while the green luminance decreased over a period of 10 sec until red was much brighter than green. The luminosity ramp then ran back in the opposite direction for another 10 sec, and so on. The motion is carried by the luminance information, and when there is no brightness difference between red and green, there is no motion either. The point along the luminance ramp at which no motion is seen (and thus no OKN) gives the red/green luminosity ratio for the observer. The display was generated by a Grinnell graphics system controlled by LSI 11/23 computer. The TV
No. 4
Reporrs
465
Fig. 2. Red bars (of the green square wave grating in T l , luminance STIMULUS T3, of Fig. 1) gradually increased in luminance, and green bars decreased in luminance, over a ten sec peokn sw riod. Ramp then reversed. left OKN tracings in response to this stimulus had their slow GREEN BLIND phase to the left when red right bars were darker than green SW okn (left half of trace), but to the right when the red bars were lighter than the green (right NORMAL half of trace). OKN changed in direction at the equiluokn sw minance point (filled arrows). Switch settings, indicating RED BLIND subjective reversals in direction of motion, are shown as unfilled arrows (SW). OKN reversal point was shifted to the left for a typical deutan, who needed more green to reach equiluminance, and to the right for a typical protan, who needed more red to reach equiluminance. OKN for normals is shown in the middle trace.
screen, which subtended 36 X 36 degrees at the eye, was viewed from a distance of 28 cm in a dimly lit room. The spatial frequency of the gratings was 0.5 cycles per degree (bar width = 1 degree). The cycling rate was 5 Hz, giving an effective drift rate of 10 deg/ sec. The gratings were diffused slightly by a sheet of tracing paper taped to the screen. No fixation point was provided. The stimulus was designed to promote strong OKN. Subjects were asked to relax and look at the screen, and to indicate the direction of the apparent motion of the stripes (left, right, or ambiguous) by means of a hand-held switch, which was held to the left, to the right, or centered. At the same time their eye movements were recorded by a Biometrics photoelectric sensor coupled to a pen recorder. Two estimates of the equiluminance point were obtained for each subject, one from switch settings and one from OKN reversals. Both were averaged over the same ten luminance sweeps, taking a total of 100 sec. Results and Discussion. Subjects reported seeing a grating moving at a constant velocity that briefly degenerated into a flickering, ambiguous display and then reversed direction, again moving at a constant velocity. Figure 2 shows typical eye movement tracings from normal, protan, and deutan subjects. The ramp in the top trace shows the gradually changing red/green luminosity ratio in the stimulus. The OKN movements stopped and then reversed in direction in step with the subjects' reports of the direction of motion. Note that the equiluminance point in Figure 2 was shifted toward the red (right in Figure 2) for the red-defective eye and toward the green (left in Figure 2) for the
green-defective eye, showing that these subjects needed more red and more green, respectively, than a normal subject to reach equiluminance. Both OKN and the switch settings gave reliable indications of the red/green ratio at which equiluminance is seen, so OKN could be used potentially in subjects unable to give subjective reports. In fact OKN was the more reliable measure since the switch settings lagged behind OKN by a reaction time of 0.8 sec. This lag imposes artifactual shifts on the estimated equiluminance point, toward the red on the red-rising ramp and toward the green on the red-falling ramp. This artifact is cancelled by averaging over ramps. Figure 3a plots the mean equiluminance point for each subject derived in two ways: (1) subjectively from the reported reversals in apparent direction, signalled by the switch settings (abscissa) and (2) objectively from the OKN reversal points (ordinate). The two measures agree closely (r = .985, P