In this section we discuss the visualization features we use to communicate WMN .... has two MadWiFi9 controlled wireless Atheros-chipset cards: one forms an ...
SCUBA: Focus and Context for Real-time Mesh Network Health Diagnosis Amit P. Jardosh Panuakdet Suwannatat Tobias H¨ollerer Elizabeth M. Belding Kevin C. Almeroth Department of Computer Science, UC Santa Barbara Abstract. Large-scale wireless metro-mesh networks consisting of hundreds of routers and thousands of clients suffer from a plethora of performance problems. The sheer scale of such networks, the abundance of performance metrics, and the absence of effective tools can quickly overwhelm a network operators’ ability to diagnose these problems. As a solution, we present SCUBA, an interactive focus and context visualization framework for metro-mesh health diagnosis. SCUBA places performance metrics into multiple tiers or contexts, and displays only the topmost context by default to reduce screen clutter and to provide a broad contextual overview of network performance. A network operator can interactively focus on problem regions and zoom to progressively reveal more detailed contexts only in the focal region. We describe SCUBA’s contexts and its planar and hyperbolic views of a nearly 500 node mesh to demonstrate how it eases and expedites health diagnosis. Further, we implement SCUBA on a 15-node testbed, demonstrate its ability to diagnose a problem within a sample scenario, and discuss its deployment challenges in a larger mesh. Our work leads to several future research directions on focus and context visualization and efficient metrics collection for fast and efficient mesh network health diagnosis1 .
1 Introduction Metro-scale wireless mesh networks (WMNs)2 , consisting of hundreds of routers, are being deployed worldwide in city downtowns, malls, and residential areas3 . While several millions of dollars have been spent to deploy WMNs, these networks suffer from a plethora of problems that severely impact their performance. Some of the most common problems are weak client connectivity due to signal attenuation, interference from external devices, and misbehaving or misconfigured client nodes [1]. These problems have largely been responsible for WMN vendors not achieving sustainable client market penetration, thereby leading to dwindling business prospects for this technology. We believe that the effective diagnosis and troubleshooting of performance problems is key to the success of metro-scale WMNs. Although many novel metrics and techniques to diagnose and troubleshoot problems in WMNs have been proposed by the research community [9, 6], sifting through a sea of such metrics collected from each device in a metro-scale WMN can be overwhelming for network operators. As a solution, diagnostic tools utilize visualization techniques such as time-series plots and planar graphs4 . However, the diagnosis of problems by viewing a myriad of 1
2 3 4
A video demo of SCUBA is at http://moment.cs.ucsb.edu/conan/scuba/. We request the paper be considered for the best paper award because the metrics collected from our mesh testbed will be made publicly available. http://www.muniwifi.org/ www.tropos.com,www.firetide.com,www.strixsystems.com,www.meraki.com NetCrunch: http://www.adremsoft.com/netcrunch/index.php
2
SCUBA: Focus and Context for Real-time Mesh Network Health Diagnosis
such graphs and plots in large-scale WMNs can be very tedious and time-consuming. We believe that operators of large-scale WMNs need clever structured visualization techniques to quickly navigate through metrics and diagnose problems. Numerous publications have shown that good visualizations decrease the time and effort to evaluate large volumes of information in the Internet [11, 10, 8]5 . To our knowledge, diagnostic visualizations of large-scale WMNs have received little to no research attention yet. In this paper we argue that these networks can certainly benefit from visualization tools, especially due to their increasing sizes and complexities. To this end, we propose a focus and context visualization framework named SCUBA6 . SCUBA places performance metrics into several tiers or contexts. The topmost context provides a WMN operator with a broad contextual overview of WMN performance. By viewing only this broad context, WMN operators can quickly identify and locate problems within the WMN. Once a problem location is determined, an operator can choose to narrow his/her focus on the problem region and zoom to reveal detailed metric contexts within that region. In other words, the operator exposes a larger set of metrics within a small focal region to diagnose the cause of a performance problem. In this paper we propose a scheme for organizing metrics into three contexts (route, link, and client) with increasing detail. The placement of metrics is based on our experience of diagnosing WMN problems [5]. However, the main objective of SCUBA is to facilitate focus and context visualization for any scheme. Different schemes derived from WMN operators’ common diagnostic approaches will be explored in the future to define better contexts as well as better placement of metrics within contexts. To explain contexts, metrics, and views of SCUBA, we utilize the Google Mountain View WMN map of about 500 routers and gateways7 . To understand SCUBA’s ease of use in diagnosing a sample performance problem and it deployment challenges, we implement it on the 15-node UCSB MeshNet [5]. This paper is the first step towards structured, interactive visualizations for largescale WMN diagnosis, and it opens several new research directions. Our future work will mainly focus on conducting qualitative usability studies of SCUBA’s visualization methods, determination of appropriate sets of metrics and their placement within different contexts to better identify health problems, evaluation of SCUBA’s metric collection overhead on WMN performance, and development of techniques to reduce this overhead to facilitate real-time WMN health diagnosis.
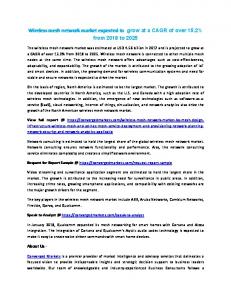
2 SCUBA: Focus and Context Visualizations The main objective of SCUBA is to facilitate fast and easy diagnosis of WMN performance problems by cleverly organizing the performance metrics for focus and context visualizations. In this section we discuss the metrics collection architecture, the organization of metrics into contexts, the different views SCUBA offers to the operator, and the variety of visualization features implemented in SCUBA. 2.1 Metrics Collection Architecture The performance metrics visualized by SCUBA are collected and computed from the routers and gateways in a WMN. As shown in Figure 1(a), each router sends a set of 5 6
7
CAIDA tools: http://www.caida.org/tools/visualization; NetDisco: http://www.netdisco.org The name SCUBA comes from the sport of scuba diving, where a diver swims close to the water surface and dives deeper to get a closer look at what is beneath the surface. http://wifi.google.com/city/mv/apmap.html
SCUBA: Focus and Context for Real-time Mesh Network Health Diagnosis SCUBA Server and Display
3
Routers Contexts Route
Metrics Focal Area
Throughput and RTT
Link
ETX
Client
Clients, Channel utilization RSSI, and External interference
Database GW Detail
Internet
(a) SCUBA’s metric collection architecture.
(b) Metric contexts used in this work
Fig. 1. SCUBA’s metrics collection architecture and metric contexts.
metrics to the SCUBA server via the gateway. The SCUBA server stores these metrics in two locations: a database so that temporal trends of metrics can be observed, and a data structure within main memory for fast access by SCUBA’s visualization engine. The SCUBA visualization engine is a standalone Java application written using the Swing GUI toolkit. We discuss the computation and collection of metrics specifically within the UCSB MeshNet in Section 3. 2.2 SCUBA’s Contexts One of the main obstacles to diagnosing problems in WMNs today is their sheer scale and the abundance of performance metrics that can be overwhelming to the WMN operator and unrealistic to analyze within a short period of time. To better organize the collected information, we propose that WMN performance metrics be placed into several contexts, where each context consists of one or more metrics. The topmost context provides the WMN operator with a holistic view, a broad contextual overview of WMN health. In other words, a WMN operator can quickly identify both the occurrence and the location of a problem in the WMN from such a broad context. An operator can then use SCUBA to focus on specific problem areas. Once the operator shifts focus, he/she can interactively zoom to view more detailed contexts. In other words, the operator can choose to reveal more metrics and therefore increase information detail isolated within the focal area. For the scope of this paper, we place WMN metrics within three contexts; the route, link, and client contexts. These three contexts and their metrics are summarized in Figure 1(b). The figure shows that as information detail increases, the focal region is narrowed in the lower SCUBA contexts. We next describe the organization of metrics in the three contexts and explain how these metrics help isolate causes of a sample WMN performance problem. Route Context: The route context is the topmost context and only displays multihop routes between each router and its corresponding Internet gateway. The context consists of two metrics: (a) throughput of TCP flows over the multi-hop routes formed from each router; and (b) the round-trip time (RTT) of UDP packets on the same routes. The two metrics are computed by each router and determine the quality of the route between the router and its gateway. We include these metrics in the topmost context of SCUBA because any significant drop in their values indicates a serious performance problem. WMN operators can use this problem indication and then zoom into the problem region to understand the real cause of a problem. For instance, problems such as sudden route flaps, unexpected drop in throughput, or an increase in RTT values can
4
SCUBA: Focus and Context for Real-time Mesh Network Health Diagnosis
cause a performance deterioration of TCP or UDP application flows that utilize those routes. Operators can further investigate the cause of such problems by increasing the context in the problem areas. Link Context: The link context reveals one additional metric, the expected transmissions count (ETX) [3] on a link between the nodes. In the link context, SCUBA displays the point-to-point MAC-layer links between nodes in addition to the routes from the route context. We use ETX as a metric in this context because it provides a good estimate of the health of links between nodes. The quality of links is likely to impact the routes that utilize them. As a result, if sudden route flaps or a significant drop in throughput are observed at the route context, the most likely cause is poor quality links utilized by the routes. Poor link quality is identified by an increase in the ETX value at the link context, and typically occurs due to three reasons: (a) heavy volume of traffic flowing over the link and/or neighboring links within its interference region; (b) external interference from a co-located radio wave source that does not belong to the WMN; and (c) heavy signal attenuation caused by some obstacle. Isolation of the causes of poor links is achieved by zooming to the next lower context. Client Context: The client context provides further insight into the cause of poor quality links. SCUBA includes four metrics within this context: (a) the number of clients associated with each router; (b) the percentage channel utilization [4] per client; (c) the received signal strength indicator (RSSI) of MAC-layer frames received from clients; and (d) the volume of external interference. These metrics are included within this context because they each describe client connections and traffic within a WMN. In the client context, SCUBA displays the clients associated with the routers, along with the links and the routes from the link context. A WMN operator will likely zoom to the client context only when the cause of problems cannot be easily determined at the link context. For instance, the cause of poor link quality can be isolated to either a large number of clients with high channel utilization values or external interference8. Both these causes can be determined from metrics in the client context. If neither have adversely impacted the quality of links, the WMN operator can determine that heavy signal attenuation by an obstacle is the likely cause of poor quality links, by the process of elimination. 2.3 Diagnostic Approaches and the Design of SCUBA The three contexts and the placement of metrics within the contexts we present for the current version of SCUBA have been designed based on own experience of building and deploying a WMN [5], and diagnosing problems using a logical top-to-bottom approach. In the future, we will evaluate additional contexts such as traffic and application, for better diagnosis. While our scheme is sufficiently general for diagnosing a wide variety of problems [1], they do not represent a complete set of metrics and their only scheme of organization within contexts. WMN operators may follow alternative diagnostic approaches in different deployment scenarios, and the metrics they may find useful in each scenario can also vary. However, since SCUBA is a visualization framework, it can be modified to utilize different schemes based on the diagnostic approaches preferred by operators. The effectiveness of SCUBA should then be evaluated qualitatively and quantitatively in specific scenarios, using metrics such as its ease of use, how 8
We compute external interference as the percentage of channel utilized by transmitters that are not associated with a router.
SCUBA: Focus and Context for Real-time Mesh Network Health Diagnosis
(a) Route throughput RTT and Link ETX.
5
and (b) Client channel utilization (c) Google WMN, without and signal strengths. SCUBA’s focus and context.
Fig. 2. SCUBA’s visualization features and an example WMN without focus and context.
quickly it can help diagnose a problem, and how many problems of interest it helps diagnose. Exploring other diagnostic approaches and evaluating their effectiveness forms interesting future work, and will only improve the utility of SCUBA. 2.4 SCUBA Visualization Features In this section we discuss the visualization features we use to communicate WMN health using the seven metrics discussed in the previous section. We use different color and size schemes for these features with a single consistent visualization policy across all contexts and metrics, which is to highlight problems in the WMN, resulting in fast and easy diagnosis of WMN problems. The visualization features, as illustrated in Figure 2, are as follows: WMN Nodes: We assume that a typical WMN backbone consists of two types of nodes: routers and Internet gateways. SCUBA displays routers as blue circles and gateways as more salient red triangles, as shown in Figure 2 and 3. Routes: WMN routers relay client packets destined for the Internet via other routers towards a gateway. The gateways relay packets destined for WMN clients towards the router with which they are associated. SCUBA visualizes the routes between routers and gateway as curved solid lines, as illustrated in Figure 2(a). In order to implement our policy of highlighting problems, the thickness of the lines is directly proportional to the RTT value; the higher the RTT, the thicker the line. On the other hand, the saturation and brightness levels of the line is inversely proportional to the throughput on an exponential scale using the HSB color scheme; low throughput routes appear bright red, while higher throughput routes are de-emphasized with a grey color. We also experimented with a more conventional mapping of throughput to line thickness, which might be preferrable for non-troubleshooting monitoring applications, but the presented scheme is advantageous when high salience of troublespots is important. Links: MAC-layer links between nodes are visualized at the link context. The links are visualized as dashed lines, as illustrated in Figure 2(a). To maintain our policy of highlighting problems, the length of white spaces between dashes are directly proportional to the ETX value; higher the ETX value, longer are the white spaces, the more broken the links appear. In order to make up for the reduction in saliency by the increasing gap sizes, the thickness of the dashed lines are increased proportional to the ETX value. This visualization feature ensures that the operators’ attention is drawn to poor quality broken links, and less towards good quality links represented as thin solid lines.
6
SCUBA: Focus and Context for Real-time Mesh Network Health Diagnosis
Clients: The client context of SCUBA shows clients and four related metrics. These metrics are illustrated in Figure 2(b). In this figure, the clients are placed around the router with which they are associated, and are visualized as sectors of a circle. The subtended angle of the clients’ sector is a value between 0◦ and 360◦ , proportional to the clients’ percentage channel utilization share. As a result, a router with client sectors that form a complete circle has its entire (100%) channel utilized by client frame transmissions. The radius of each client sector is inversely proportional to the RSSI value of the clients’ frames received by the router. As a result, the lower the clients’ RSSI, the farther the client is placed from the router, and the larger the radius. Based on these two visualization features of client sectors, a client with a large sector angle and large radius is quickly seen as a potential problem because of high channel utilization and low RSSI. The client with the largest sector area is highlighted in a bright blue color, making it easy for a WMN operator to locate all problem clients at the client context. The fourth metric, external interference, is visualized as a grey cloud around routers, as shown in Figure 2(c). The radius of the cloud is directly proportional to the volume of external interference. Moreover, when the interference cloud of two or more routers overlap, SCUBA darkens the color in the region of overlap, indicating more interference. 2.5 SCUBA Views In this section, we discuss two views of SCUBA, planar and hyperbolic. These views further ease the diagnosis of problems in large-scale WMNs by facilitating focus and context interaction [2] of the WMN operator with SCUBA’s contexts. In other words, using either of the two views operators can choose to focus on a specific location in the view while retaining some kind of overview of the whole network, and they can zoom to a context of their choice for further investigation of problems. To understand the benefit of these views, we use the Google WMN in Mountain View, California, which consists of 425 routers and 66 gateways. Since we do not have access to the actual metrics from this WMN, we use the geo-locations of the routers to create a sample large-scale visualization environment and synthetically generate values for metrics using simple assumptions. Links between routers and their corresponding ETX values are generated in loose correlation with the physical distances between routers. Routes are computed using a shortest path algorithm between the routers and their closest gateways. The throughput and RTT values are computed based on cumulative ETX values of links utilized by the routes to the gateway. Zero or more clients are matched with routers, such that their total count loosely approximates those published in a recent news article presenting statistics on the Google WMN [1]. The channel utilization, signal strength, and external interference metrics are randomly chosen from a uniform distribution. To clearly demonstrate the advantages of the focus and context visualizations of SCUBA, in Figure 2(c) we show a screenshot of all seven metrics from each of the three contexts displayed for the Google WMN. Because of the size of network, the screenshot appears cluttered, thereby limiting the ability of an operator to extract any coherent information from the view for problem diagnosis. We now discuss the two interactive SCUBA views, how they reduce screen clutter, their advantages over each other, as well as their trade-offs. Planar View: SCUBA’s planar view is shown in Figure 3. The WMN and its several contexts are rendered on a flat two-dimensional plane. Figure 3(a) shows the planar view
SCUBA: Focus and Context for Real-time Mesh Network Health Diagnosis
(a) Route context.
(b) Link context.
7
(c) Client context.
Fig. 3. Google WiFi mesh network using SCUBA’s planar view. P Side View F
P’
h Hyperbolic Surface
2-D Plane
P’ P F
Front View
(a) Side and front views.
(b) With h = 1.
(c) With h = 50.
Fig. 4. Google WiFi mesh network using SCUBA’s hyperbolic view.
with only the route context displayed for the entire Google WMN. Figure 3(b) shows the link context of a small subset of the network, when the WMN operator zooms to investigate any performance problems identified at the route context. These figures also show an inset overview in the top-right corner that indicates the focal region in the overall view. Further zooming reveals the client context, illustrated in Figure 3(c). The focus region in the overview inset is seen to shrink in size, because the operator is now zoomed to a smaller focus region. The advantage of SCUBA’s planar view is that it maintains the geographical location and orientation of all the routers and gateways, even while an operator changes focus and context. However, the trade-off of planar views is that while operators are zoomed in on lower metric contexts, they can only see the small inset overview of the whole network, which may not be sufficient to alert them to possible new unusual activity. We overcome this problem by using hyperbolic views [7]. Hyperbolic View: SCUBA uses the hyperbolic view to render routers, gateways, clients, and their corresponding metrics on a hyperbolic surface [7]. The basic idea of a hyperbolic view is to plot the focal point F of a two-dimensional plane at the center of the screen, and plot the remaining points on a hyperbolic surface, centered at the focal point. Figure 4(a) illustrates the side and front of a hyperbolic surface transformed from a simple two-dimensional planar surface. The figure shows that the non-focal location point P on a two-dimensional plane is distorted to P’ when transformed to the hyperbolic surface. The distortion depends on the height h of the hyperbola.
8
SCUBA: Focus and Context for Real-time Mesh Network Health Diagnosis
The hyperbolic view has an advantage over the planar view in that it automatically renders different contexts of SCUBA based on the position of the node with respect to the focal point. As shown in Figure 4(b), the node of interest forms the focal point of the hyperbolic surface and the remaining nodes are rendered on the hyperbolic surface, using the same orientation to the focal node as in the planar view. Also, as illustrated in Figure 4(b), SCUBA plots all the metric contexts for the focal node and progressively reduces the contexts for nodes further away from the focal node. As a result, only the route context is displayed for the nodes at the edge of the hyperbolic surface. Figure 4(c) shows that a parameter controls the depth of the hyperbolic surface, which determines how quickly context displays are reduced between the focus node and the surface edge. A main advantage of the hyperbolic view is that it shows a complete view of the WMN at all times, and automatically changes contexts as the operator interactively changes focus by mouse-dragging. As a result of this automation, the user is required to only choose his/her focus point, and SCUBA smoothly transitions to display the new focal region and the corresponding contexts. However, the trade-off of hyperbolic views is that it distorts the geographic locations of the nodes from that of a planar view. As a result of these trade-offs between the two views, SCUBA includes an inset overview similar to the one used in the planar view and allows a WMN operator to quickly toggle between the planar and hyperbolic views.
3 SCUBA Implementation on the UCSB MeshNet Our main goal for SCUBA is to make it easily usable and effective in diagnosing practical WMN problems. To test this goal, we have implemented SCUBA on the UCSB MeshNet. In this next section, we briefly discuss the design of the UCSB MeshNet and show how SCUBA is used to diagnose one sample performance problem within the MeshNet. Based on our experience of building SCUBA on the MeshNet, we discuss the implementation challenges of deploying SCUBA in a large-scale WMN. 3.1 UCSB MeshNet The UCSB MeshNet is an indoor WMN consisting of 14 multi-radio 802.11 a/g routers and one gateway, deployed on two floors of our department building [5]. Each router has two MadWiFi9 controlled wireless Atheros-chipset cards: one forms an access point (AP) to clients, and the other participates in forming the WMN backbone. The routes between routers’ backbone interfaces are formed using the MIT Roofnet software.10 The routers collect, compute, and send metrics to a central SCUBA server via the gateway over the routes. We have collected and stored the seven metrics discussed in this paper from each of the 14 routers for over one week. 3.2 Sample Problem Scenario and Diagnosis We now show how SCUBA is used to diagnose a sample problem created by a misconfigured client sending an unusually large volume of traffic. We use this problem as a sample because similar problems have been identified in the Google WMN [1] and diagnosing such a problem is likely to be more difficult without SCUBA. As shown in Figure 5, we use SCUBA to diagnose the problem using three simple actions. In the route context shown in Figure 5(a), the operator observes a unusually low throughput and high RTT values of a route indicated by the thick red lines. Based on 9 10
http://www.madwifi.org http://pdos.csail.mit.edu/roofnet/doku.php?id=software
SCUBA: Focus and Context for Real-time Mesh Network Health Diagnosis
9
(a) Route context shows a drop (b) Link context shows a (c) Client context shows a in route throughput. poor broken link. client with 97.49% utilization. Fig. 5. SCUBA used to diagnose a sample problem in the UCSB MeshNet.
this observation, the operator zooms in the region of the ”problem route” to access the link context. The link context in Figure 5(b) clearly shows that the links utilized by the problem route have a high ETX value indicated by the sparsely dashed straight lines. The increase in ETX values may have been caused by three possible reasons; too many clients, high external interference, or high traffic load. To isolate the cause, the operator zooms to the client context close to the edge router which is using the problem route, as shown in Figure 5(c). In this figure, since the cloud of external interference is not visible, the operator knows that external interference is low and is therefore not the problem. However, the large sector of the circle representing a client with 97.49% channel utilization looks clearly anomalous. The operator is thus assured that a single misconfigured and/or misbehaving client is overloading the channel with excess traffic and adversely impacting the performance of an entire route. Using these simple actions and diagnostic approaches using SCUBA, we show that problem diagnosis in large-scale WMNs can be easier and faster when using structured visualizations, as opposed to sifting through a myriad of graphs and plots. The current version of SCUBA allows operators diagnose several other performance problems, such as a flashcrowd of users overloading the network or suboptimal route topologies caused due to poor links or interference. The set of diagnosable problems will increase with the number and type of metrics collected. Moreover, a time dimension will allow SCUBA to diagnose many more temporal problems such as rapid route flaps and client mobility. 3.3 Deployment Challenges In this section, we discuss the challenges of deploying SCUBA on a production WMN and the techniques we use on the UCSB MeshNet to meet the challenges. Computational overhead: The CPU and memory overhead of computing all the metrics on each router can adversely impact the routers’ regular operation. An efficient metric processing mechanism should keep the overhead low. For instance, in the UCSB MeshNet, we compute clients’ channel utilization and external interference within the MadWiFi driver itself, reducing the overhead of processing frames in user-space. Similar optimizations form interesting research for larger WMNs with more metrics. Transmission overhead: The transmission of an extensive set of metrics from each router to its gateway can introduce significant load on the WMN routes and eat away channel capacity from regular traffic flows. In the UCSB MeshNet, the seven metrics typically form about a 10 KB bundle of data on an average per router with about 15 associated clients. While this load is negligible, more metrics collected frequently can significantly increase the cumulative traffic load on a production WMN. In the UCSB MeshNet, metrics are encoded and compressed before they are sent. The further reduction of such overhead is interesting future work, and will be very critical for the success of real-time diagnosis of WMN problems.
10
SCUBA: Focus and Context for Real-time Mesh Network Health Diagnosis
4 Conclusions In this paper, we propose a focus and context visualization framework called SCUBA for fast and efficient WMN health diagnosis. SCUBA places the WMN performance metrics into contexts and presents them in two views, planar and hyperbolic. We believe that visualization frameworks such as SCUBA will form the most structured and efficient means of WMN health diagnosis. SCUBA opens several new directions of research. The most prominent one is to qualitatively and quantitatively determine the best set of metrics and contexts that facilitate comprehensive diagnosis. To do so, we believe that qualitative usability studies of SCUBA’s visualization methods and the study of various diagnostic approaches followed by WMN operators will be very helpful. Another research direction is to reduce the metrics’ computation and collection overhead to achieve real-time visualization capabilities. A possible future extension is to make SCUBA use a set of diagnostic rules to automatically identify problem regions and adjust focus and context accordingly. Such automation will immediately direct an operator’s attention to the problem and will likely reduce diagnosis time. SCUBA is the first step towards interactive visualizations for fast and efficient WMN health diagnosis. We believe that as WMNs are rapidly deployed worldwide and as they increase in complexity, the need for such visualizations will grow. Faster and efficient health diagnosis will help operators maintain their WMN’s performance and therefore achieve the desirable economic success of the metro-scale mesh technology.
References 1. Tropos Report on Google WiFi Network. www.muniwireless.com/article/articleview/5403. 2. S. K. Card, J. D. Mackinlay, and B. Shneiderman. Readings in Information Visualization: Using Vision to Think. Morgan Kaufmann Publishers Inc., San Francisco, CA. 3. D. De Couto, D. Aguayo, J. Bicket, and R. Morris. A High-throughput Path Metric for Multi-hop Wireless Routing. Wireless Networks, 11(4):419–434, 2005. 4. A. P. Jardosh, K. N. Ramchandran, K. C. Almeroth, and E. M. Belding. Understanding Congestion in IEEE 802.11b Wireless Networks. In Proceedings of USENIX IMC, Berkeley, CA, October 2005. 5. H. Lundgren, K. N. Ramachandran, E. M. Belding-Royer, K. C. Almeroth, M. Benny, A. Hewatt, A. Touma, and A. P. Jardosh. Experiences from the Design, Deployment, and Usage of the UCSB MeshNet Testbed. IEEE Wireless Communications Magazine, 13:18– 29, April 2006. 6. S. Marti, T. Giuli, K. Lai, and M. Baker. Mitigating Routing Misbehavior in Mobile Ad hoc Networks. In Proceedings of MOBICOM, pages 255–265, Boston, MA, 2000. 7. T. Munzner. Interactive Visualization of Large Graphs and Networks. PhD thesis, Stanford University, June 2000. 8. V. Paxson. Strategies for Sound Internet Measurement. In Proceedings of IMC, pages 263– 271, Taormina, Sicily, October 2004. 9. L. Qiu, P. Bahl, A. Rao, and L. Zhou. Troubleshooting Wireless Mesh Networks. ACM SIGCOMM Computer Communication Review, 36(5):17–28, 2006. 10. J. Sommers, P. Barford, and W. Willinger. SPLAT: A Visualization Tool for Mining Internet Measurements. In Proceedings of PAM, Adelaide, Australia, March 2006. 11. J. Tukey. Exploratory Data Analysis. Addison-Wesley Menlo Park, CA, 1977.