Dec 9, 2002 - Re earch Board of Canada. umber 45 - 14 ere i ued a Department of ..... The results, as daily means, were downloaded to a laptop computer.
Seasonal Patterns of Biological and Physical Variables in Sediments of Lime Kiln Bay during 2000-2001
D.J. Wildish, H.M. Akagi and A. Martin
Fisheries and Oceans Canada Biological Station 531 Brandy Cove Road St. Andrews, NB E5B 2L9 December 2002
Canadian Technical Report of Fisheries and Aquatic Sciences 2447
Fisheries and Oceans
paches et Oceans
Canada
Canada
Canada
Canadian Technical Report of Fi herie and
quatic
cience
The e report contain cientific and technical information that repre ent an important contribution to exi ting kno ledge but which for orne rea on rna not be appropriate for primary cientific (i.e. Journal) publication. Technical Report are directed primaril to ard a orld ide audience and ha e an international di tribution. 0 re triction i placed on ubject matter and the erie reflect the broad intere t and policie of the Department of Fi herie and Ocean namel fi herie management, technolog and de elopment, ocean cience and aquaticen ironment rele ant to Canada. Technical Report rna be cited a full publication. The correct citation appear abo e the ab tract of each report. Each report ill be ab tracted in Aquatic Sciences and Fi herie Ab tract and ill be inde ed annuall in the Department' inde to cientific and technical publication. umber 1-456 in thi erie ere i ued a Technical Report of the Fi herie Re earch Board of Canada. umber 45 - 14 ere i ued a Department of the En ironment, Fi herie and arine ervice, Re earch and Development Directorate Technical Report. umber 15-924 ere i ued a Department of Fi herie and the En ironment, Fi herie and arine er i e Technical Report. The current erie name a changed ith report number 925. Detail on the a ailabilit of Technical Report in hard cop rna be obtained from the i uing e tabli hment indicated on the front co er.
Rapport technique canadien de cience halieutique et aquatique Ce rapport contiennent de ren eignement cientifique et technique qui con tituent une contribution importante au connai ance actuelle mai qui, pour une rai on ou pour une autre, ne emblent pa approprie pour la publication dan un journal cientifique. II n a aucune re triction quant au ujet, de fait la erie reflete la a te gamme de interet et de politique du ini tere de Peche et de Ocean, notamment ge tion de peche technique et de eloppement, cience oceanique et en ironnement aquatique, au Canada. Le Rapport technique peu ent etre con idere comme de publication complete. Le titre e act paraitra au haut du re ume de chaque rapport, qui era publie dan la re ue quatic cience and Fi herie b tract et qui figurera dan I inde annuel de publication cientifique et technique du ini tere. Le numero 1-456 de cette erie ont ete publie a titre de Rapport technique de l'Office de recherche ur Ie pecherie du Canada. Le numero 457- 14 a titre de Rapport technique de la Direction generale de la recherche et du de eloppement, er ice de peche et de la mer mini tere de I En ironnement. Le numero 15-924 ont ete publie a titre de Rapport te hnique du e ice de peche et de la mer ini tere de Peche et de I En ironnement. e nom de la erie a ete modifie apartir du numero 925. La page cou ·erture porte Ie nom de I etabli ement auteur ou I on peut e procurer Ie rapport ou cou erture cartonnee.
Canadian Technical Report of Fisheries and Aquatic Sciences 2447
December 2002
Seasonal Patterns of Biological and Physical Variables in Sediments of Lime Kiln Bay during 2000-2001
by
D. J. Wildish, H. M. Akagi and A. Martin
Fisheries and Oceans Canada Biological Station 531 Brandy Cove Road St. Andrews, New Brunswick, Canada E5B 2L9
This is the two hundred and forty-ninth Technical Report of the Biological Station, St. Andrews, NB
11
© Her Majesty the Queen in Right of Canada, 2002,
Cat. No. Fs 97-6/2447E
ISSN 0706-6457
Correct citation for this publication: Wildish, D.l, Akagi, H.M., and Martin, A. 2002. Seasonal patterns of biological and physical variables in sediments of Lime Kiln Bay during 2000-2001 Can. Tech. Rep. Fish. Aquat. Sci. 2447: iii + 46 p.
111
ABSTRACT
Wildish, D.l., Akagi, H.M., and Martin, A. 2002. Seasonal patterns of biological and physical variables in sediments of Lime Kiln Bay during 2000-2001. Can. Tech. Rep. Fish. Aquat. Sci. 2447: iii + 46 p. During the period from September 2000 to September 2001 we conducted montWy sediment interfacial and profile sampling at two stations within Lime Kiln Bay. This Bay has been utilized for salmon culture since 1981. Station R was seaward of a bar, which separated the two basins within the Bay and station E was located in the inner, landward basin. Both stations were close to salmon lease sites, but were> 100 m away from cages and so were not exposed to direct, near-field deposition (waste food, salmon faeces) from the cages. Reported here are the monthly results for redox, total sulfide, chlorophyll a, phaeophytin, enzymatically hydrolyzable amino acids, sediment interfacial temperature, sediment profile imaging and macrofaunal community characteristics, for stations Rand E.
RESUME
Wildish, D.l., Akagi, H.M., and Martin, A. 2002. Seasonal patterns of biological and physical variables in sediments of Lime Kiln Bay during 2000-2001. Can. Tech. Rep. Fish. Aquat. Sci. 2447: iii + 46 p. Pendant la periode de septembre 2000 a septembre 2001, nous avons procede a des echantillonnages mensuels (interfaciaux et de profil) de sediments, a deux stations d'echantillonnage dans la baie Lime Kiln, ou l'on pratique la salmoniculture depuis 1981. La station R partait d'une barre de sable, vers la mer, separant les deux bassins de la baie, et la station E se situait dans Ie bassin interieur, du cote de la terre. Les deux stations d'echantillonnage etaient situees a proximite de sites de salmoniculture, mais a plus de 100 metres de distance des cages afin de ne pas etre exposees aux depots de dechets alimentaires et de matieres fecales des saumons autour des cages. Le present rapport donne les resultats des prelevements mensuels des caracteristiques suivantes aux stations R et E: conditions d'oxydoreduction (redox), sulfure total, chlorophylle a, amino-acides hydrolysables par action enzymatique, temperature de I'interface des sediments, imagerie des sediments de profil et caracteristiques de la communaute macrofaunique.
INTRODUCTION
For marine coastal ecosystems at temperate latitudes, marked temporal, or seasonal, patterns of productivity and structure are driven by physical-chemical changes. These include, but are not limited to, climate, particularly temperature, as well as the distribution of plant nutrients by hydrodynamic forces and light availability. The purpose of this study was to investigate seasonality within sediments of a cold temperate climate at 45° North as part of the Fisheries and Oceans project - Environmental Studies for Sustainable Aquacuture, ESSA (see Hargrave 2002). There are many implications of seasonality for coastal ecosystem users. One current group of users within coastal areas of the Bay of Fundy is the salmon growers who place Atlantic salmon, Salmo salar L., smolts in floating sea-pens for growout in marine conditions, a process which takes 18-24 mo. The environmental effects which result from this activity have been studied in Canada and other parts of the World and are relatively well known (see reviews by Gowen and Bradbury 1987; Findlay and Watling 1997). Based on this understanding, environmental monitoring programs have been devised, e.g. for the Bay of Fundy (see Janowicz and Ross 2001), relying on geochemical measures which require a fall monitoring and spring follow-up, if the farm site shows a high level of organic enrichment. Thus we expected this research to have a practical application: to determine whether seasonality biases geochemical measures and thus influences the interpretation of monitoring results from fall to spring. Lime Kiln Bay is approximately 2.5 km long by I km wide at the mouth (Fig. 1) and opens into Letang Inlet and thence the Bay of Fundy. Lime Kiln Bay is surrounded by salmon farms in Back Bay, Bliss Harbour and inner Letang Harbour (Fig. 1), where a total of 23 farms were present in 2001. Lime Kiln Bay has been continuously used for salmon culture since 1981, with six farms present in 1996. The increasing biomass of salmon carried in the Bay before this time probably contributed (Stewart 1998) to a virus disease epidemic (infectious salmon anemia, ISA) starting in 1996. Ecological models (e.g., Silvert 1994; Cranston 1994) had suggested that the Letang Inlet was exceeding its holding capacity limits for organic wastes, calculated as plant nutrients or ammonium with holding capacity limits estimated between 7000 and 10,000 tonnes of salmon per year for Letang Harbour and vicinity (geographic area defined in Gregory et al. (1993». The results were refined with hydrodynamic modeling (Trites and Petrie 1995), which also suggested that Lime Kiln Bay was exceeding its holding capacity limits. These results were presented to the industry at a meeting held at the St. Andrews Biological Station in 1996 (unpublished). In 1996, the six farms present within Lime Kiln Bay had a combined allowable production limit of 735,000 fish. Assuming that all were marketed in the same year (unlikely, but the worst case scenario) and using the mean weight (4.36 kg) of ungutted fish at slaughter (Peterson et al. 2001), yields a total of 3205 tonnes per year. After 1998 and a fallowing period imposed by the provincial government following the ISA epidemic, the farm sites have been reduced to four (Fig. 1), presumably with a lower total biomass, and other Bay-wide management initiatives, such as single year-class stocking, implemented. Lime Kiln Bay is now stocked with a fresh batch of smolts every odd year. Thus in even years the total allowable production limit is 540,000 fish x 4.36 kg = 2354 tonnes. In odd years the production will be due only to smolt growth and hence less than this. Similar calculations for the whole of the Letang Harbour and vicinity area in 2001 (as used by Silvert (1994) and Cranston (1994) in their model predictions), based on a mean smolt biomass in the first year of 0.54 kg (Model 3 and initial 120g smolt size at 17 September, from Peterson et al. (2001» and market size of 4.36 kg, are shown in Table 1. These calculations suggest that holding capacity limits are still being exceeded.
2
Table 1. Calculation of annual salmon biomass (tonnes) in bay management areas (BMA's) 8, 9 and 10 based on allowable production limits (APL's as number of fish) for each lease. Lease in BMA 10 with dashed lines in Fig. 1 are excluded. An arbitrary # is used for each lease so that its APL remains confidential
#
BMA
8
APL x 1000 300 250 180 180 130 120 80 80
Smolt ..............
Market
713
5755
9 10 11 12
150 120 120 150
292
2354
13 14 15 16 17 18 19
160 200 135 320 180 200 220
764
6169
1,769
14,278
.~~,"--~~--~~-_.~~~----~--,-~---~--~~--.-~----~----.-~~-~~---
1 2 3 4 5 6
8
7
10
9
TOTALS
_~·_~"'''''''''''''''',i'''''''!;';lli"I«'ISSl._·· ~,=_~"""-:."",;",,,-~
R
E
Month
..
---~-----_._~-~-~~~----~-~-----_._--~----~~----_
S
B
S
B
October
27
19.82
41
195.24
November
23
7.41
42
60.45
January
21
4.38
51
54.71
February
22
5.90
48
41.60
March
20
20.50
45
148.24
April
21
2.55
50
126.89
May
25
35.48
30
22.82
June
36
16.76
44
90.65
July
21
21.68
34
50.55
August
31
8.95
48
33.79
September
26
9.96
43
31.65
._--_._~-
----
DISCUSSION Most of the data in Appendices 1-5 awaits further detailed analysis. Only sediment interfacial redoxes have been examined closely (Wi1dish et. al. 2003b) and shows that in sedimentary profiles with an aerobic upper layer, redoxes have a seasonal, sine wave pattern. The pattern decreases with increasing temperatures (when biological activity is high) and increases with decreasing temperatures (when biological activity is low). In highly organically enriched conditions where anaerobiosis reaches the sediment-water interface, interfacial redoxes
11
are an inverse function of total sulfide as found previously (Hargrave et al. 1997; Wildish et al. 1999). The demonstration here, that redox values in aerobic sediments are seasonal, has implications for environmental monitoring, notably in using geochemical measures to designate organic enrichment macrofaunal community stages. This is discussed in Wildish et al. (2003b) where the protocol proposed is as follows. In surficial sediments where an established farm is present, the redox is considered to be inversely related to sulfide and no seasonal correction is needed. Where farms are new and sulfide levels may not have built up in surficial sediments, the redox may be seasonal and a correction may be required. If necessary, we recommend correcting redox seasonally, with the aid of the simple models given in Wildish et al. (2003b), to correspond to the timing of original sampling. Although there appears to be no evidence for seasonality in total sulfides in the present data (Fig. 3), the possibility that enriched sediments, where sulfides exceed 1300 J.lM, may show that a seasonal signal exists and needs to be investigated. In Chesapeake Bay sediments, Marvin-DiPasquale and Capone (1998) found that there was a seasonal periodicity of sulfate reduction. This was controlled by temperature, carbon and sulfate limitation, and the presence/absence of macrofauna or dissolved oxygen. Since our ion analytic method measures total sulfides, inclusive of iron pyrites which are stable in most sediments, the seasonal cycling of sulfate reduction may be masked by the presence of a large reservoir of metallic sulfides. There are indications that sediments in Lime Kiln Bay are eutrophicated, particularly by the seasonal presence of high levels of chlorophyll a in the surface layers. These pigments originate from interfacial diatoms as well as phytoplankton from the water column, which may settle onto sediments during senescence. The generally high levels of total sulfide and low redoxes (which also varies seasonally) are indicators that microbial activity is high, consistent with a high level of sedimentary metabolism, and hence eutrophication. This is consistent with the plant nutrient predictive model outputs discussed in the ''Introduction.'' ACKNOWLEDGMENTS We thank Captain Wayne Miner and Danny Loveless of Pandalus III and Captain Eldon Carter of the W.E. Scott for help in sampling. For high quality SCUBA diving services we thank Luke Aymar, Dale Tucker and Joe Hunt. We also acknowledge the help of Ms. Nell Halse and the NB Salmon Growers Association for permission to use their building for laboratory analysis and photography purposes. For information on allowable production limits in salmon culture and Fig. 1, we thank Blythe Chang and the NB Dept. of Agriculture, Fisheries and Aquaculture.
12
REFERENCES
Berner, RA. 1963. Electrode studies of hydrogen sulphide in marine sediments. Geochim. Cosmochim. Acta 27: 563-575. Cranston, R. 1994. Dissolved ammonium and sulfate gradients in surficial sediment pore water as a measure of organic carbon burial rate. In Modelling benthic impacts of organic enrichment from marine aquaculture. Edited by RT. Hargrave. Can. Tech. Rep. Fish. Aquat. Sci. 1949: p. 93. Findlay, RH., Watling, L. 1997. Prediction of benthic impact for salmon net-pens based on the balance of benthic oxygen supply and demand. Mar. EcoI. Prog. Ser. 155: 147-157. Gowen, RJ., and Bradbury, N.R 1987. The ecological impact of salmonid farming in coastal waters: a review. Oceanogr. Mar. BioI. Annu. Rev. 25: 563-575. Gregory, D., Petrie, R Jordan, E, and Langille, P. 1993. Oceanographic, geographic, and hydrological parameters of Scotia-Fundy and southern Gulf of St.Lawrence inlets. Can. Tech. Rep. Hydrogr. Ocean Sci. 143: 248 p. Hargrave, RT.H., and Phillips, G.A. 1981. Annual in situ carbon dioxide and oxygen flux across a subtidal marine sediment. Estuar. Coast. Shelf. Sci. 12: 725-737. Hargrave, RT., Phillips, G.A., Doucette, L.I., White, M.J., Milligan, D.J., Wildish, D.J. and Cranston, RE. 1997. Assessing benthic impacts of organic enrichment from marine aquaculture. Water Air Soil Pollut. 99: 641-650. Hargrave, RT. 2002. Environmental studies for sustainable aquaculture (ESSA): 2002 workshop report. Can. Tech. Rep. Fish. Aquat. Sci. 2411: 112 p. Janowicz, M., and Ross, J. 2001. Monitoring for benthic impacts in the southwest New Brunswick salmon aquaculture industry. ICES. J. Mar. Sci. 58: 453-459. Lim, S.S.L., and Gratto, G.W. 1992. The effects of organic enrichment from Atlantic salmon aquaculture sites on the benthic macrofaunal communities in the lower Bay of Fundy. Final report to the New Brunswick Department of Fisheries and Aquaculture, 168 p. Marvin-DiPasquale, M.e., and Capone, D.G. 1998. Benthic sulfate reduction along the Chesapeake Bay central channel. 1. Spatial trends and controls. Mar. EcoI. Prog. Ser. 168: 213-228. Mayer, L.M., Schick, L.L. Sawyer, T., and Plante, C.J. 1995. Bioavailable amino acids in sediments: a biomimetic, kinetics-based approach. LimnoI. Oceanogr. 40: 511-520. Nilsson, H. e., and Rosenberg, R 2000. Succession in marine benthic habitats and fauna in response to oxygen deficiency: analysed by sediment-profile imaging and by grab samples. Mar. EcoI. Prog. Ser. 197: 139-149. Pearson, T.H., and Rosenberg, R 1978. Macrobenthic succession in relation to organic enrichment and pollution of the marine environment. Oceanogr. Mar. BioI. Annu. Rev. 16: 229-311.
13
Peterson, RH., Page, F., Steeves, G.D., Wildish, D.J., Harmon, P., and Losier, R 2001. A survey of 20 Atlantic salmon farms in the Bay of Fundy: influence of environmental and husbandry variables on performance. Can. Tech. Rep. Fish. Aquat. Sci. 2337: 117 p. Pohle, G., and Frost, F. 1997. Establishment of standard benthic monitoring sites to assess longterm ecological modification and provide predictive sequence of benthic community succession in the inner Bay of Fundy, New Brunswick. Final report to the New Brunswick Department of Fisheries and Aquaculture, 119 p. Stewart, J.E. 1998. Sharing the waters: an evaluation of site fallowing, year class separation and distances between sites for fish health purposes on Atlantic salmon farms. Can. Tech. Rep. Fish. Aquat. Sci. 2218: 63 p. Silvert, W. 1994. Modelling benthic deposition and impacts of organic matter loading. In Modelling benthic impacts of organic enrichment from marine aquaculture. Edited by RT. Hargrave. Can. Tech. Rep. Fish. Aquat. Sci. 1949: 1-18. Strickland, J.D.H., and Parsons, T.R 1968. A practical handbook of seawater analysis. Fish. Res. Board Can. Bull. 167: 311 p. Trites, RW., and Petrie, L. 1995. Physical oceanographic features of Letang Inlet including evaluation and results from a numerical model. Can. Tech. Rep. Hydrogr. Ocean Sci. 163: 55 p. Wildish, D.J., Akagi, H.M., Hamilton, N., and Hargrave, RT. 1999. A recommended method for monitoring sediments to detect organic enrichment from mariculture in the Bay of Fundy. Can. Tech. Rep. Fish. Aquat. Sci. 2286: 31 p. Wildish, D.J., Hargrave, RT., MacLeod, C., and Crawford, C.M. 2003a. Detection of organic enrichment near finfish net-pens by sediment profile imaging at SCUBA-accessible depths. Submitted to J. Exp. Mar. BioI. Bcol. Wildish, D.J., Barmuta, L., Crawford, C.M., MacLeod, c., and Butler, C.V.E. 2003b. Seasonality of redox measurements in interfacial marine sediments near salmon farms. Submitted to: Mar. Freshwat. Res.
14
45°05' N
, \
\ \ \ \
\
, \
Bay of F:undy
I \
I
I I
,,
, I
--J
.........
_---------_.--
o
2
i
kilometres 66°50'W
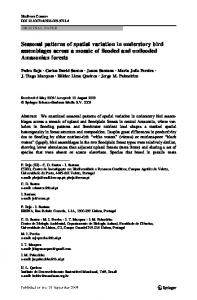
Fig. 1. Map of Letang Inlet showing Lime Kiln Bay and positions of stations R and E. Numbers refer to salmon farm leases in 2002. Sites 14, 16, 17 and 24 were not included in the Letang Harbour and vicinity model quoted. BMA = Bay Management Area.
15
400
I 0
•
300
200 0
>< 0
"'0 Q)
100
a:
0
•
0
; • e ~
~
~
e
•
§
0 0
100
• 0
0 0
Q 0
8
0
~
• 50
-100
;
0 ~
e•
0
a 0
• •
•
8
0
• i Q
~ 0
8 •
"
0
200
150
250
300
350
-200 Days
Fig. 2. Seasonality of redox in interfacial sediments at stations R (filled circles) and E (open circles), Lime Kiln Bay. Days are from the summer solstice (22 June in the northern hemisphere).
16
3000
•
2500
• •
2000 Q)
~:J
II)
g
1500
• •
0
I-
0
1000
• • •
• b oI ~ J ~ 0
•
0
e
0
,
8
• 0
0 0
0
100
50
0
•
0
0
•
500
0
, 150
•
g,
a,
200
250
~
0
•~g
•
0
,
300
.
350
Days
Fig. 3. Seasonality of total sulfides in interfacial sediments at station R and E, Lime Kiln Bay. Symbols as in Fig. 2.
900 800
0
700
0 0
600 III
500
::E ()
400
0
300 0
200 100
0
0
0
0 0
~
~
0 0
50
100
150
200
250
300
0
350
Days
Fig. 4. Seasonality of chlorophyll a in interfacial sediments at station E and R, Lime Kiln Bay. Symbols as in Fig.2.
17
14
- ---
12
...::::I ...co
10
Q.
6
~
4
Q)
-
,;
8
Q)
E Q)
2
0 1
2
3
4
5
6
7
8
9
10
11
12
Months 2001
Fig. 5. Sediment interfacial temperatures at station E, Lime Kiln Bay. Upper line is the maximum and lower line the minimum daily mean temperature. The middle line is the monthly average of all daily mean temperatures.
18
E
R o_~_a~~1 4
8
E
,,#,"%,,!!!!,,,-,*,,,-,",!"'~!.'
E
12
12
16 20
+---~---~----j
o
100
300
200
o
100
200
Eh
300
400
Eh
0
~
4
8~
E
E
12
16
8 12
16
20
20
w
m
~
®
W
~
0
chi a
200
400
600
800
1000
chi a
o~
o E
16 20
+-----r---~----i
o
1000
500
1500
o
500
1000
1500
S'
Fig. 6. Sediment profiling at stations Rand E, Lime Kiln Bay on 30 March 2001 for chlorophyll a (ChI a), redox (Eh) and total sulfide (S"") as J.lM. Profile depths are in centimeters (em).
19
Appendix 1. Monthly sediment interface and profiling results at stations Rand E, Lime Kiln Bay for the period 20 September 2000 to 19 September 2001. The numbers after R or E indicate the sequential core used and the numbers after the dash show the sampling depth in cm ( 0 0-2 cm)
20-Sept-00 . _ ._ _
"""","_,»J~_'~'
_ _ _ _-_._ _ _._ _-
~
Phaeo.,
EhNHE , Chi a _NQ=-___~____E_~~_ ..___p_g(~ _______I.Q~I ______mV______~= J! ~ __ Surface 63.21 70.99 72 91 7.79 RI-O 52.98 60.97 40 120 7.98 R2-0 238.00 298.42 120 220 60.42 R3-0 309.12 353.99 95 160 44.88 R4-0 97.67 113.39 39 320 15.72 R5-0 183.43 57 16.30 167.13 110 EI-0 107.97 -51 20.95 87.03 220 E2-0 97.63 54 19.50 78.13 35 E3-0 186.31 61 32.52 153.79 40 E4-0 202.34 -69 31 36.98 165.36 E5-0 Profile RI-0 RI-4 RI-8 RI-12 RI-16 R2-0 R2-4 R2-8 R2-12 R2-16 R2-20 EI-O EI-4 EI-8 EI-12 EI-16 EI-20 EI-24 EI-28 E2-0 E2-4 E2-8 E2-12 E2-16 E2-20 E2-24
--
-
17.08 9.13 0.74 2.36 0.70 12.24 19.85 3.55 1.79 0.55 0.47 43.48 14.20 7.00 1.96 2.81
169.41 90.62 8.63 22.91 8.76 306.00 97.43 45.33 28.61 9.61 8.07 148.78 85.27 42.95 33.30 53.91
186.49 99.76 9.37 25.27 9.47 318.23 117.28 48.87 30.39 10.16 8.54 192.26 99.47 49.95 35.27 56.72
33.06 36.47 13.96 13.59 1.37 6.25 3.92 .
109.89 130.10 98.41 66.87 65.37 43.19 29.26
142.94 166.57 112.37 80.46 66.74 49.45 33.18
58 78 -63 -60 -156 28 35 -20 -115 -109 -174 97 7 -3 -44 -46 -70 -62 -82 21 51 -39 -31 -90 -100 33
69 320 2300 1700 1100 180 270 340 2200 3700 5800 120 510 880 890 360 700 340 1600 410 170 700 730 1800 3100 190
=-----
20
31-Oct-00 ChI a, _!:i~:
~ ~_p__KL.[
EhNHE, ~
~m
Y:.
~_.~_. ~_:?_p__M.
Surface
RI-0 R2-0 R3-0 R4-0 R5-0 EI-0 E2-0 E3-0 E4-0 E5-0
126 135 140 129 166 174 150 142 149 154
1.2 0.73 2.7 13 13 11 30 110 12 30
111 115 85 71 56 -30 -30 -67 -14 -3
120 110 110 110 240 260
Profiles
R4-4 R5-4 R5-8 EI-4 EI-8 EI-12 E3-4 E3-8 E3-12 E3-16
210
260 120 32
_
21
30-Nov-00 c
."",
'