Segmentation of Façades from Urban 3D Point Clouds Using ... - MDPI
Recommend Documents
Mar 28, 2013 - Abstract: Segmentation and classification of urban range data into different object classes have several challenges due to certain properties of ...
Mar 28, 2013 - of sparse 3D data obtained from LiDAR sensors is presented. The 3D point cloud is first segmented into voxels, which are then characterized ...
Jun 16, 2015 - forest inventory at the individual tree level using LiDAR point cloud data. LiDAR data contain three-dimensional structure information that can ...
taining sequences filmed from a moving car in daylight and at dusk. The results confirm that .... and each ËW as fC( ËW) = mintËW â C(t). Note that the smallest ...
Abstract. We propose an algorithm for semantic segmentation based on. 3D point clouds derived from ego-motion. We motivate five simple cues designed to ...
KEY WORDS: Semantic Classification, Scene Understanding, Point Clouds, LIDAR, Features, .... nearby points form the basis for computing features at different.
The segmentation and modelling algorithm described in this paper has been .... Figure 2: Data is collected from the spinning laser mounted on the roof of a ... give the principal axes of the ellipsoid, and the square- root of the ..... (d) Shape Dist
subsequent tasks such as navigation or reconstruction [5, 6]. Consequently, the ... CV] 5 Feb 2018 ..... Figure 5: We train our network on synthetic point clouds.
Feb 14, 2017 - Clouds. Yizhak Ben-Shabat · Tamar Avraham · Michael Lindenbaum · ... Y. Ben-Shabat ...... Geiger A, Lenz P, Stiller C, Urtasun R (2013) Vi-.
Feb 7, 2014 - filtering methods, progressive TIN (triangular irregular network) .... ground points, and finally a TIN of the identified ground points was ...
KEY WORDS: Indoor Modelling, Semantic Segmentation, Mobile Laser, Point Cloud, Deep Learning, Convolutional Neural. Network. ABSTRACT: As Building ...
shopping and clothing industry [3], 3D sensing of the environment representations [5] etc. .... Windows, Linux, Mac OS, iOS and Android. Fig. 1. Microsoft Kinect ...
The objective of segmentation on point clouds is to spatially group points with similar ... Segmentation is a fundamental issue in processing point clouds data ...
... Faculty of Informatics, Universitá della Svizzera italiana, CH - 6904 Lugano, Switzerland ...... [PBP95] PARK F. C., BOBROW J. E., PLOEN S. R.: A Lie group.
scalar height fields, each of which is defined at uniform grid points on a square ... partitioning a point cloud into several patches and resampling points uniformly.
make it easy to acquire Billions of spatial data points. This ... We propose an efficient octree to store and compress 3D .... There is a second, easier way to reduce.
Jun 4, 2018 - State Key Laboratory of Information Engineering in Surveying, Mapping and ... a challenging issue especially for the freeform surfaces. ... planning, computer vision, geomatics, photogrammetry, to .... Extract free- ... segmentation app
Registration, data abstraction and ... neighbor search for ICP-based scan matching. Not discussed ..... corresponding domain, each with a different point density.
May 23, 2017 - capable of generating millions of points from images, there ex- .... directly on image or point cloud data. .... Instead of computing the geometric.
May 23, 2017 - We show that off-the-shelf machine learning techniques coupled ..... We implemented our software in C++ to ease its later integration into the ...
Jul 26, 2007 - acquired by a 3D laser scan from the surface of a geometric object. ...... Floater, and M.A. Sabin, editors, Advances in Multiresolution for Ge-.
ΔABC∈T. Vµ(A, B, C, f1,f2)/SConv(g),. (7). Summing in (7) takes place over all triangles in T. The proposed measure can be adapted for each particular ...
Oct 25, 2018 - When fb breaks into two parts fb1 and fb2, the distance from fb1 to fa is ..... Available online: http://pointclouds.org/ (accessed on 24 October ...
Segmentation of Façades from Urban 3D Point Clouds Using ... - MDPI
Jan 19, 2016 - Abstract: 3D building segmentation is an important research issue in the remote sensing community with relevant applications to urban ...
Article
Segmentation of Façades from Urban 3D Point Clouds Using Geometrical and Morphological Attribute-Based Operators Andrés Serna *, Beatriz Marcotegui and Jorge Hernández Received: 29 October 2015; Accepted: 14 December 2015; Published: 19 January 2016 Academic Editor: Wolfgang Kainz MINES ParisTech, CMM—Centre de Morphologie Mathématique, 35 rue St Honoré, Fontainebleau 77305, France; [email protected] (B.M); [email protected] (J.H.) * Correspondence: [email protected]; Tel.: +57-777-491-896
Abstract: 3D building segmentation is an important research issue in the remote sensing community with relevant applications to urban modeling, cloud-to-cloud and cloud-to-model registration, 3D cartography, virtual reality, cultural heritage documentation, among others. In this paper, we propose automatic, parametric and robust approaches to segment façades from 3D point clouds. Processing is carried out using elevation images and 3D decomposition, and the final result can be reprojected onto the 3D point cloud for visualization or evaluation purposes. Our methods are based on geometrical and geodesic constraints. Parameters are related to urban and architectural constraints. Thus, they can be set up to manage façades of any height, length and elongation. We propose two methods based on façade marker extraction and a third method without markers based on the maximal elongation image. This work is developed in the framework of TerraMobilita project. The performance of our methods is proved in our experiments on TerraMobilita databases using 2D and 3D ground truth annotations. Keywords: 3D urban analysis; laser scanning; segmentation; façades; mathematical morphology; attribute-based operators; geodesic elongation
1. Introduction Building segmentation can be defined as the process of separating buildings from other objects such as natural and artificial ground, vegetation and urban objects. The first researches on automatic building extraction began in the 1980s. They used aerial imagery and focused on the extraction of high-level 2D and 3D primitives from stereo images. One of the main drawbacks of these methods is that some false positives need to be filtered out since some linear primitives may not correspond to meaningful structures. In computer vision, elevation images were introduced as data structures allowing direct access to 3D geometric features. First elevation images were mostly acquired from small objects and scenes, using active systems. During the 1990s, aerial laser scanning (ALS) became widely available, so elevation images of huge scenes and cities became possible. Accuracy and point density of those systems are in constant progress. More recently, new acquisition systems such as terrestrial (TLS) and mobile laser scanning (MLS) have been developed, adding not only greater geometrical accuracy and extremely high density, but also façade scans, not visible from ALS [1]. Although the processing of 3D urban data has been underway for many years, façade segmentation is still an open problem. Several contributions on this domain are proposed in this paper. Our processing assumes that ground has been already segmented. In our works we have used the approach already published in [2,3]. Once the ground is segmented, all remaining structures are ISPRS Int. J. Geo-Inf. 2016, 5, 6; doi:10.3390/ijgi5010006
www.mdpi.com/journal/ijgi
ISPRS Int. J. Geo-Inf. 2016, 5, 6
2 of 29
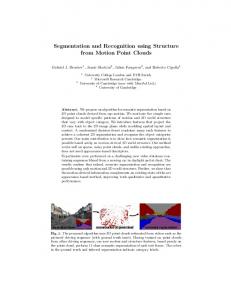
considered as façades and objects. Using TLS and MLS data, only building front parts are visible, as shown in Figure 1. It is noteworthy that façades constitute the highest and longest vertical entities in the urban scene.
(a)
(b)
(c)
(d)
c Figure 1. 3D point clouds from two test sites in rue d’Assas in Paris, France. Stereopolis II, IGN . Note that façades constitute the highest and longest vertical entities in the urban scene. (a) Point cloud colored by the Z coordinate; (b) Point cloud colored by the Intensity; (c) Point cloud colored by the Z coordinate; (d) Point cloud colored by the Intensity.
This work has been developed in the framework of TerraMobilita project [4] and is organized as follows. Section 2 reviews related works in the state of the art. Sections 4 and 5 introduce two different approaches to segment façades: with and without markers, respectively. Section 6 describes a method to segment city blocks taking advantage of the façade segmentation result. Finally, Section 8 concludes this work. 2. Related Work Goulette et al. [5] develop a MLS system, called LARA-3D, which acquires and segments in real-time ground, façades and objects. Ground and façades are detected fitting horizontal and vertical planes, then remaining points are considered as objects. In a similar way, Boulaassal et al. [6] segment building façades using the RANSAC algorithm on TLS data. In general, approaches based on plane extraction are proved to be simple, fast and useful as input for high-level approaches devoted to create accurate geometric models. However, their main drawback is that plane extraction may fail
ISPRS Int. J. Geo-Inf. 2016, 5, 6
3 of 29
when ground and façades are not flat enough. Moreover, façades may be over- and under-segmented due to architectural details such as balconies. Bab-Hadiashar and Gheissari [7] propose a method to segment planar and curved surfaces in range images. Their method consists of selecting the appropriate parametric model that minimizes strain energy of fitted surfaces. The authors applied their methodology to indoor range images of the University of South Florida (USF) database [8]. Several works on the parametric model fitting problem can be found in the literature [9–13]. Those works can be extended in order to segment surfaces such as ground and façades on elevation images. Their main drawbacks are that they require a model estimation which can be different for different images, are time consuming due to minimization procedures and may produce under- and over-segmentation. Demantke et al. [14] propose a method to adapt 3D spherical neighborhoods based on local features. Radius selection is carried out optimizing local entropy. Then, dimensionality features are calculated. These features can be useful to classify 1D structures such as pole-like objects, 2D structures such as ground or façades, and 3D volumetric structures such as trees and urban objects. Hernández and Marcotegui [2] assume that façades on the same street are aligned, which is verified in their Paris-rue-Soufflot database. They use the Hough transform to find façade directions. Then, they analyze the height of each profile in order to detect façades and city blocks. Hammoudi [15] presents a similar technique based on the Progressive Probabilistic Hough Transform in order to detect walls and windows. He assumes that building façades are mainly vertical, so it is possible to generate an accumulation image to compute the number of points projected on each pixel. Other works aiming at segmenting façades are available in the literature [16–21]. Additionally, color images can be used in order to enrich façade segmentations. For example, several works available in the literature use color images to segment façades keeping architectural details such as balconies and windows. Then, those results are used to colorize 3D point clouds providing a realistic rendering [22–26]. In general, methods based on planar extraction, Hough transform and model fitting are not generic enough since façades can have different shapes and contain different architectural details. Moreover, the problem of objects touching the façade, such as urban furniture or parked motorcycles, is rarely analyzed in the literature. In this paper, we address these problems proposing methods based on geometric and elongation features computed on projection images. These methods are robust to extract façades of several shapes and correctly separate objects touching the façade. 3. Projection Images Once a 3D point cloud is acquired, a suitable data structure is not only required to inspect and visualize the information quality, but also to process it conveniently. Point clouds are delivered as long lists of ( x, y, z) coordinates, possibly with attributes such as intensity and color. Points are usually listed in scan line order, which is not suitable for efficient processing. For example in a ( x, y, z) list, it is not possible to quickly determine the neighbors of a point within some radius. Data structures such as projection images, Delaunay triangulation, octrees and k-D trees allow this kind of processing. Choosing the proper data structure is application dependent, moreover it is possible to combine some of them to get better results in specific tasks such as visualization, filtering, segmentation and classification [1]. As aforementioned, our method is based on projection images. 3D point clouds are projected to elevation images because they are convenient structures to visualize and to process data. One can utilize all the large collection of existing image processing tools, in particular mathematical morphology [27,28]. Additionally, images can be processed quickly, implicitly define neighborhood relationships and require less memory than 3D data. In general, the idea of deriving elevation images from 3D point clouds is not new. Nevertheless, the development of accurate and fast urban analysis algorithms is still an open problem.
ISPRS Int. J. Geo-Inf. 2016, 5, 6
4 of 29
Elevation images are 2.5D structures that contain depth information at each pixel. They are generated by an orthographic projection to a virtual camera plane, i.e., the depth is the distance from each 3D point to the projection plane. The camera model P is a projective transformation from R3 → N2 , and it can be decomposed in three sequential transformations as follows: Definition 1. Let M = ( X, Y, Z ) be a 3D point in R3 and m = (u, v) a point in the image space N2 . The camera model P is defined as the successive transformations: T
where, (c x , cy ) is the intersection point between the optical axis and the image plane, (k x , k y ) are the number of pixels per unit of length, Rw is the real world coordinate system, Rc is the camera coordinate system with origin in the optical center, and Rr is the projection plane coordinate system. The virtual camera is chosen such that: • • •
→ It is located on the horizontal plane with normal vector − n = (0, 0, 1) and crossing the lowest point (0, 0, zmin ). Therefore, the Rotation matrix [ Rot] is equal to the identity. The point cloud and the projection plane are centered on the gravity center of the point cloud. Thus, the translation vector t is equal to the gravity center, and the intersection point (c x , cy ) = (0, 0). The projection is orthographic. Thus, the projection axis is orthogonal to the projection plane and the projection center is located at the infinity. It means, f oc = ∞, x = Xc and y = Yc .
According to these assumptions, the number of pixels per unit of length is the only free parameter. In order to simplify this selection, we assume k x = k y = k. It has to be carefully chosen. On the one hand, if k is too small, fine details are not preserved because too many points would be projected on the same pixel. On the other hand, too large k implies connectivity problems and large image sizes, which implies higher computational time that would no longer justify the use of elevation images instead of 3D point clouds. This parameter is the most critical in terms of quality versus processing time. In our experiments, we have chosen k = 5 pix/m thanks to a priori knowledge about point cloud density. During projection, several points can be projected to the same pixel. Thus, four elevation images are defined: • • •
Maximal elevation image ( f max ), or simply elevation image, stores the maximal depth among all projected points on the same pixel. Minimal elevation image ( f min ), stores the minimal depth among all projected points on the same pixel. Height image ( f height ), contains the difference between maximal and minimal elevation images.
ISPRS Int. J. Geo-Inf. 2016, 5, 6
•
5 of 29
Accumulation image ( f acc ), stores the number of points projected on each pixel.
In general, processing steps are performed combining these images and resulting image can be reprojected to the 3D point cloud. Figure 2 presents the 3D point clouds and the elevation images for our two Paris test sites.
(a)
(b)
Figure 2. 3D point clouds and elevation images for a test site in Paris, France. Data acquired by c Stereopolis II, IGN France. (a) Rue d’Assas: point cloud; (b) Rue d’Assas: elevation image.
Image projections imply a reduction in the amount of data to be processed. Therefore, processing 2.5D images using image processing techniques is much faster than process the 3D points directly. Moreover, neighborhood relationships are given in images without any additional computation. In order to avoid connectivity problems due to occlusions or low dense point clouds, an interpolation may be applied. This topic is out of the scope of this paper. For further details on interpolation of elevation images, the reader is encouraged to refer to Serna and Marcotegui [3], Hernández and Marcotegui [29]. 4. Façade Segmentation Using Markers In order to segment façades, we propose a marker-based method using geometrical constraints. After marker extraction, a reconstruction is applied in order to get the entire façade. Let us explain first the façade marker extraction and later in Section 4.2 the reconstruction process. 4.1. Façade Marker Extraction The height image f height is appropriate to compute façade markers since it contains information about high and vertical structures, as shown in Figure 3. Figure 3a,b show maximal f max and minimal f min elevation images, respectively. While Figure 3c presents the height image. From the work by Hernández and Marcotegui [29], we use the two following geometric constraints on f height in order to extract façade markers:
ISPRS Int. J. Geo-Inf. 2016, 5, 6
•
•
6 of 29
hmin , defining the minimal allowed façade height. In our experiments, this variable has been set to 3.5 m according to architectural characteristics of our databases. This threshold is illustrated in Figure 4a. Note that only the highest objects are preserved. Lmin , defining the minimal allowed façade length. In our experiments, this variable has been set to 5 m according to architectural characteristics of our databases. This threshold is illustrated in Figure 4b. Note that small objects such as lampposts and objects behind façades are not long enough and are then eliminated.
(a)
(b)
(c)
Figure 3. Elevation images from a test site in rue d’Assas in Paris, France. Stereopolis II, c (a) Maximal elevation image f max ; (b) Minimal elevation image f min ; (c) Height image IGN . f height = f max − f min .
In addition, we propose a third constraint in order to eliminate round objects such as trees: •
Cmin , defining the maximal allowed façade circularity (circularity of an object X is defined as the inverse of its elongation Circ( X ) = 1/E( X ). In this work, we focus on geodesic elongation, simply called henceforth elongation [30]. The elongation E( X ) of an object X is a shape descriptor useful to characterize long and thin structures. It is proportional to the ratio between the square geodesic diameter L2 ( X ) and the area of the object A( X ), as shown in Equation (2). The geodesic diameter L( X ) = supx∈X {lx ( X )} is the length of the longest geodesic arc of X, i.e., the longest internal segment lx ( X ) connecting the two end points of X [31]. The longer and narrower the object, the higher the elongation. The lowest bound is reached with the disk, where E( X ) = 1. An efficient implementation can be found in Morard et al. [32]. E( X ) =
π L2 ( X ) 4 A( X )
(2)
In our experiments, Cmin has been heuristically set to 1/3, which corresponds to the circularity of an ellipse whose major axis is 3 times longer than the minor one. This value is appropriate to filter tree-tops since circularity of a circle is equal to 1. This threshold is illustrated in Figure 4c. Note that non-elongated objects such as the two trees in the right street side have been eliminated. Using these constraints, we extract façade markers as the union of connected components (CC) higher than hmin , longer than Lmin and less circular than Cmin , as established in Definition 2: Definition 2. Let f height be a height image f height : D → V, with D ⊂ Z2 the image domain and V = [0, ..., H ] the set of gray levels mapping the pixel height. Let Th( f height ) be the binary image containing the pixels higher than hmin : Th( f height ) = { p ∈ D | f height ( p) > hmin } (3)
ISPRS Int. J. Geo-Inf. 2016, 5, 6
7 of 29
Let C1 , C2 ,..., Cn be the connected components of image Th( f height ): Th( f height ) =
n [
Ci , i 6= j ⇒ Ci ∩ Cj = ∅
(4)
i =1
Then, façade markers Fmark are the connected components Ci of image Th( f height ) which are longer than Lmin and less circular than Cmin : Fmark = {Cj | L(Cj ) > Lmin ∧ Circ(Cj ) < Cmin }
(5)
∀ j ∈ {1, ..., n}, where L(Cj ) and Circ(Cj ) are respectively the geodesic diameter and the circularity of connected component Cj . It is noteworthy that these three parameters (hmin , Lmin and Cmin ) are easy to tune since they have a physical meaning and depend on urban/architectural constraints. Figure 4 illustrates this marker selection process.
(a)
(b)
(c)
Figure 4. Façade marker extraction. Markers are represented with white pixels: (a) Points higher than hmin ; (b) Points higher than hmin and longer than Lmin ; (c) Façade markers Fmark : points higher than hmin , longer than Lmin and less circular than Cmin . Test site in rue d’Assas (Paris).
Due to specific requirements in our TerraMobilita datasets, several 3D point clouds have been acquired with the laser system oriented to the ground. Therefore, structures higher than 2.5 m are out of the laser field of view, as shown in Figure 5. This is challenging for methods using height constraints since high wall parts are not visible. To solve this problem, we propose a solution taking advantage of the acquisition cycle of the MLS sensor, as shown in Figure 6. In our configuration, the sensor spins scanning vertical lines starting from the top. Thus, the first and the last point of each spin correspond to the highest point on the right and on the left street side, respectively. These highest points are usually located on the façade and can be extracted by detecting sign changes in the angle of depression (computed using the sensor position) between consecutive points. Then, these markers are added to image Th( f height ) and isolated points are filtered out using the same process than before: only markers longer than Lmin and less circular than Cmin are considered as façade markers. Figure 7 illustrates façade marker extraction when the laser sensor is oriented to the ground. Figure 7b presents the façade markers reprojected onto the 3D point cloud. The test site corresponds to a street section in rue Vaugirard in Paris, France.
ISPRS Int. J. Geo-Inf. 2016, 5, 6
8 of 29
(a)
(b)
Figure 5. 3D point clouds when laser is oriented to the ground. 3D point clouds are colored by c elevation. (a) Bend and (b) straight street sections in rue Vaugirard (Paris). Stereopolis II, IGN .
Figure 6. Mobile laser scanning (MLS) acquisition cycle. The first and the last point are taken as façade c markers. Test site in rue Soufflot in Paris, France. LARA-3D, CAOR-MINES ParisTech .
(a)
(b)
Figure 7. Façade markers reprojected onto the 3D point cloud. During this acquisition, the laser sensor was oriented to the ground. Note that markers only represent partial façades, therefore a façade reconstruction process is required, as explained in Subsection 4.2. Test site in rue Vaugirard c (a) 3D point cloud colored by the Z coordinate; (b) Façade in Paris, France. Stereopolis II, IGN . markers (red), other (gray).
4.2. Façade Reconstruction from Markers As mentioned earlier, façade markers only contain partial façades. Therefore, a reconstruction should be applied from those markers in order to retrieve the whole façade. With this purpose, we use a reconstruction constrained by the ground residue. Ground G is assumed to be previously computed using either our ground segmentation method proposed in [3,29] or any other method reported in the literature [33–36].
ISPRS Int. J. Geo-Inf. 2016, 5, 6
9 of 29
Ground residue G c is computed as the difference between the elevation image and the ground image: G c = f max − G. Then, a first solution for the reconstruction process consists in a set of increasing geodesic dilations applied until idempotence. This transformation is called reconstruction by dilation [31] and is defined as follows: Definition 3. Reconstruction by dilation. The reconstruction by dilation of a mask image G c from a marker Fmark ≤ G c is defined as the geodesic dilation of Fmark within G c until idempotence and it is denoted by: (i )
RδGc ( Fmark ) = δGc ( Fmark )
(6) ( i +1)
where i is the geodesic dilation size for which idempotence is reached, i.e., δGc
(i )
( Fmark ) = δGc ( Fmark )
Figure 8 illustrates the façade segmentation based on reconstruction by dilation. Figure 8a an elevation image and Figure 8b its corresponding height image. Figure 8c shows the façade markers Fmark computed by the method explained above in Section 4.1. Figure 8d presents the ground segmentation result G, while Figure 8e presents the ground residue G c . Finally, Figure 8f shows the façade segmentation obtained by reconstruction by dilation of the ground residue from the façade markers. Note that pixels behind façades have been included in the segmentation result. This method is fast and easy to implement. However, the main drawback is that objects connected to the façade, e.g., motorcycles or pedestrians leaning on walls or objects behind façades, are reconstructed as well.
(a)
(b)
(c)
(d)
(e)
(f)
Figure 8. Façade segmentation using reconstruction by dilation on the ground residue image from c (a) Max. elevation façade markers. Test site in rue d’Assas in Paris, France. Stereopolis II, IGN . image f max ; (b) Height image f height ; (c) Façade markers Fmark ; (d) Ground segmentation G; (e) Ground residue G c = f max − G; (f) Façade segmentation using reconstruction by dilation: RδGc ( Fmark ).
Figures 9 and 10 present this segmentation result reprojected onto the 3D point cloud. Note that the reconstruction by dilation retrieves not only the entire façade but also other objects connected to it. For example in Figure 10, a store, a pedestrian and a traffic sign on the right sidewalk have been wrongly reconstructed.
ISPRS Int. J. Geo-Inf. 2016, 5, 6
10 of 29
In order to solve the problem of objects touching the façade, we propose an attribute controlled reconstruction from façade markers. This procedure has been previously published in Serna and Marcotegui [19]. It consists of appending nearby points with similar height. The propagation process stops when a given attribute reaches its maximum value. In our case, we use increasing propagations from façade markers over λ-flat zones, called also in the literature quasi-flat zones [37]. As façades are the longest and most elongated structures in the elevation image, we keep the propagation that maximizes the geodesic elongation. Let us introduce a formal definition for the façade segmentation process using attribute controlled reconstruction: Definition 4. Attribute controlled reconstruction. Let G c be a digital elevation image containing the ground residue G c : D → V, with D ⊂ Z2 the image domain and V = [0, ..., H ] the set of gray levels mapping the elevation values. Two neighboring pixels p, q belong to the same λ–flat zone of G c , if their absolute difference | G c ( p) − G c (q)| is smaller than or equal to a given λ value. For all x ∈ Fmark ⊆ D, let Λ be the set of increasing regions containing marker pixel x. For all λ ∈ V and j = [1, ..., n − 1], we define Aλ ( Fmark ) ∈ Λ as the λ–flat zone of image G c containing marker Fmark : Aλ ( Fmark ) = { x } ∪ {q|∃℘ = ( p1 = x, ..., pn = q) such that | G c ( p j ) − G c ( p j+1 )| ≤ λ}
(7)
Let E( Aλ ( Fmark )) be the geodesic elongation of λ–flat zone Aλ ( Fmark ). For all λi ∈ V and i = [0, ..., R], we define λ M as the value for which the elongation is maximum: λ M = argmaxλi ∈V | E( Aλi ( Fmark ))|
(8)
Then, we define Aλ M ( Fmark ) as the attribute controlled reconstruction of the façade from marker Fmark . Using this controlled reconstruction maximizing the geodesic elongation, it is possible to reconstruct the façade without merging adjacent objects. Figure 9 compares façade segmentation methods using reconstruction by dilation RδGc ( Fmark ) and attribute controlled reconstruction Aλ M ( Fmark ), both from marker Fmark . It is noteworthy that neither objects connected to the façade nor objects behind it have been reached by the attribute controlled reconstruction. Figure 10d presents the segmentation result using attribute controlled reconstruction reprojected onto the 3D point cloud. Compared to Figure 10b, note that the store, the pedestrians and the traffic sign have not been included in the façade. Additionally, several objects such as wall lamps and objects behind façades have been correctly separated.
(a)
(b)
(c)
Figure 9. Comparison of façade segmentation methods using reconstruction by dilation and attribute controlled reconstruction on the ground residue image. Test site in rue d’Assas in Paris, c (a) Façade markers Fmark ; (b) Reconstruction by dilation RδGc ( Fmark ); France. Stereopolis II, IGN . (c) Attribute controlled reconstruction Aλ M ( Fmark ).
ISPRS Int. J. Geo-Inf. 2016, 5, 6
11 of 29
(a)
(b)
(c)
(d)
Figure 10. Façade segmentation result reprojected onto the 3D point cloud. Images correspond to two c (a) Point different views of the same test site in rue d’Assas in Paris, France. Stereopolis II, IGN . cloud colored by the laser intensity; (b) Segmentation result: façade (blue), other (gray). Façade has been segmented using reconstruction by dilation on the ground residue image from façade markers; (c) Point cloud colored by the laser intensity; (d) Segmentation result: façade (blue), other (gray). Façade segmentation using attribute controlled reconstruction on the ground residue image.
4.3. Discussion Methods based on markers are robust to segment non-planar façades and façades with several architectural details and balconies, such it is the case in Parisian buildings. Moreover, these methods are simple and fast since they are based on geometric constraints, easily translated into threshold values. In the case of low façades or when the laser sensor is oriented to the ground, additional markers corresponding to the highest points of each laser cycle are added. Since markers only contain partial façades, a reconstruction is required in order to get the entire façade. In our case, reconstruction is constrained to the ground residue. In this section, we have proposed two reconstructions: (i) a classic reconstruction by dilation; (ii) a reconstruction based on attribute controlled propagation. The performance of these methods strongly depends on the markers selection. A wrong marker may produce errors since it will reconstruct the marked object, even if it is not a façade. In our experiments, our marker selection method has proved to be efficient in many cases. However, objects such as tree alignments may produce false markers, therefore wrong segmentations, as shown in Figure 11. The reason for this problem is that our circularity criterion fails filtering trees alignments since their footprints may be
ISPRS Int. J. Geo-Inf. 2016, 5, 6
12 of 29
elongated enough. Changing the value of circularity does not seem to be a good idea. On the one hand, reducing the circularity value would affect the recall of the method, i.e., less façades would be detected. On the other hand, increasing the circularity value would increase the number of false positives.
(a)
(b)
(c) Figure 11. Errors in façade segmentation due to tree alignments wrongly extracted as façade c (a) Elevation image; markers. Test site in St. Sulpice square in Paris, France. Stereopolis II, IGN . (b) Façade markers. Several incorrect markers have been detected due to tree alignments; (c) Façade segmentation using attribute controlled reconstruction.
This is our motivation to propose a third method, more robust than the two proposed previously, avoiding the use of façade markers. Our idea is analyzing the elongation and its evolution over the height decomposition of the 3D scene. Let us introduce such a method in the following section. 5. Façade Segmentation without Markers In order to segment façades avoiding the use of markers, we propose a method based on threshold decomposition and attribute profiles. In [38], we have introduced this method in order to segment elongated objects on gray-scale images. Let us remind its definition in the 2D case: Definition 5. 2D Attribute profile. Let I be a digital gray-scale image I : D → V, with D ⊂ Z2 the image domain and V = [0, ..., R] the set of gray levels. A decomposition of I can be obtained considering successive thresholds: Tt ( I ) = { p ∈ D | I ( p) > t} ∀t = [0, ..., R − 1] (9) Since this decomposition satisfies the inclusion property Tt ( I ) ⊆ Tt−1 ( I ), ∀t ∈ [1, ..., R − 1], it is possible to build a tree, called the component tree, with level sets Tt ( I ). Each branch of the tree represents the evolution
ISPRS Int. J. Geo-Inf. 2016, 5, 6
13 of 29
of a single connected component Xt . An attribute profile is the evolution of an attribute (e.g., area, perimeter, elongation, average gray-level, etc.) of a given CC along a branch of the tree. Figure 12 illustrates the threshold decomposition for a 1D function, its component tree and the attribute (width) profiles for the two function maxima (pA and pB ). Events on this attribute profile are useful to segment objects [39], extract features [40–42] and define adaptive structuring elements [19].
Now, let us extend this definition to the 3D case: Definition 6. 3D Attribute profile. Let P be a 3D point cloud containing a list of N points pi = ( xi , yi , zi ) ⊂