This article has been accepted for inclusion in a future issue of this journal. Content is final as presented, with the exception of pagination. IEEE JOURNAL OF SELECTED TOPICS IN APPLIED EARTH OBSERVATIONS AND REMOTE SENSING
1
Segmentation of Individual Trees From TLS and MLS Data Lishan Zhong, Liang Cheng, Hao Xu, Yang Wu, Yanming Chen, and Manchun Li
Abstract—Terrestrial laser scanning (TLS) and mobile laser scanning (MLS) data can be used to obtain abundant and precise side information of trees. Therefore, it can enable extracting individual tree parameters, such as the tree height, crown size, crown base height, and diameter at breast height, and it can provide basic data for forest research and management. This study proposes a technical framework for segmenting individual trees from TLS and MLS data. This framework contains six steps: 1) data preprocessing, 2) octree construction, 3) spatial clustering, 4) stem detection, 5) initial segmentation, and 6) overlapped canopy segmentation. This framework makes two main contributions: 1) a top-down hierarchical segmentation approach, including connectivity-based spatial clustering (regional scale), stem-based initial segmentation (individual tree scale), and fine segmentation of overlapped canopy (canopy scale), is proposed to reduce technical difficulties and improve process efficiency; and 2) a modified node similarity calculation for normalized cut method aiming at segmenting overlapped canopy, which can effectively separate neighboring trees even if their canopies are overlapped, is proposed. The proposed framework was tested on a leaves-off terrestrial LiDAR dataset and a leaves-on mobile LiDAR dataset. For terrestrial LiDAR data, our framework achieved completeness of 92.4%, correctness of 95.4%, and F-score of 0.94. For mobile LiDAR data, the corresponding values were 94.0%, 93.7%, and 0.94. Index Terms—Individual tree, LiDAR, normalized cut (Ncut), octree, segmentation.
I. INTRODUCTION NDIVIDUAL tree segmentation from small-footprint light detection and ranging (LiDAR) data finds various applications in forest research [1]–[5]. The tree height, crown size, and crown base height can be directly acquired from a 3-D point cloud [6]–[10], and the biomass and carbon storage can be estimated using empirical equations based on individual tree structures [9]–[13]. Small-footprint LiDAR can be categorized as airborne LiDAR, terrestrial LiDAR (also called TLS), and mobile LiDAR (also called MLS) depending on the platform on which the scanner is installed. Airborne LiDAR has relatively low point density (usually several to dozens of points per square
I
Manuscript received March 1, 2016; revised April 17, 2016; accepted May 4, 2016. This work was supported by the National Natural Science Foundation of China under Grant 41371017, Grant 41501456, and Grant 41001238. (Corresponding authors: Liang Cheng and Manchun Li.). The authors are with Jiangsu Provincial Key Laboratory of Geographic Information Science and Technology, Nanjing University, Nanjing 210046, China, also with Collaborative Innovation Center for the South Sea Studies, Nanjing University, Nanjing 210046, China, and also with Department of Geographic Information Science, Nanjing University, Nanjing 210046, China (e-mail:
[email protected];
[email protected]; xuhao_nju@ smail.nju.edu.cn;
[email protected];
[email protected];
[email protected]). Color versions of one or more of the figures in this paper are available online at http://ieeexplore.ieee.org. Digital Object Identifier 10.1109/JSTARS.2016.2565519
meter), and it acquires very few points for a single tree; furthermore, the top-down data acquiring mode makes it difficult to obtain the points of stems and branches, limiting its further research and application on individual tree scales. In contrast, TLS and MLS employ a side-looking scanning mode featuring high point density (usually hundreds to thousands of points per square meter); therefore, they can obtain abundant tree side information, such as stems, branches, and even inner canopy details, that is very useful for individual tree scales [14], [15]. Despite these advantages, thus far, few studies have focused on individual tree segmentation using TLS or MLS [16]. Furthermore, most such studies conducted experiments for street trees with large intervals, and they seldom considered the case of high canopy overlapping degree. Bienert et al. detected trees from terrestrial LiDAR data based on an analysis of horizontal slices [17]. Lin and Hyyppa used the commercial TerraScan software to interactively isolate tree-related point clusters for performing crown reconstruction [3]. Wu et al. presented a voxel-based Marked neighborhood searching method, which includes seed selecting and region growing, for identifying street trees and deriving their morphological parameters; this method achieved 98% accuracy for tree detection at a test site where trees rarely overlapped with each other [18]. Lin et al. introduced a canopy-surface-model-based three-level frame and RD-schematic algorithm (a searching schematic analogous to a revolving door) for segmenting individual trees from mobile LiDAR data; they achieved 83% accuracy and 89% precision [16]. Liang et al. presented a fully automatic stem-mapping algorithm based on the spatial distribution properties of laser points and achieved overall accuracy of 73%; however, their method did not handle canopy segmentation [19]. Current methods are not robust enough to deal with different canopy situations in overlapped canopy segmentation. Zhong et al. segmented an overlapped canopy by analyzing the ratio relationship between the distance from the uncertain point to bilateral stems and the distance from the uncertain point to bilateral tree tops; however, this method is unsuitable for dealing with canopies of various shapes as it only considers distance factors [20]. Reitberger et al. introduced normalized cut (Ncut), a quite effective technique for 2-D image segmentation, to isolate individual trees from airborne LiDAR data [21]. Yu et al. used Ncut to separate individual trees from nearby light poles [22]. However, the completeness of individual trees cannot be guaranteed when segmenting points with more than two trees using the traditional Ncut method. Current studies aiming at the segmentation of individual tree points based on airborne LiDAR data can be generally categorized into raster-based methods and point-based methods.
1939-1404 © 2016 IEEE. Personal use is permitted, but republication/redistribution requires IEEE permission. See http://www.ieee.org/publications standards/publications/rights/index.html for more information.
This article has been accepted for inclusion in a future issue of this journal. Content is final as presented, with the exception of pagination. 2
IEEE JOURNAL OF SELECTED TOPICS IN APPLIED EARTH OBSERVATIONS AND REMOTE SENSING
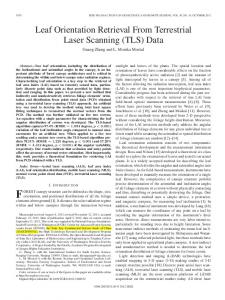
The former interpolate LiDAR points into a canopy height model (CHM) or canopy surface model and then use 2-D image processing algorithms, such as watershed segmentation and template matching to segment individual trees [7], [23], [24]. The latter generate an individual tree’s canopy by searching for seed points followed by spatial clustering or regional growing based on seed points [2], [25]. Li et al. proposed an algorithm based on the relative spacing of trees and region growing to segment individual tress in a mixed conifer forest and derived an overall F-score of 0.9 in a coniferous forest; however, their method worked less effectively when applied to a deciduous forest [26]. Lee et al. developed an adaptive clustering method with a minimum searching radius (sr) to detect all possible seed points and then merged partial tree detections to obtain individual trees in managed pine forests in North-Central Florida with overall accuracy of 95.1%; however, their method requires training using local ground truth data to achieve optimal results [8]. Jing et al. proposed a tree crown delineation method based on multiscale analysis and segmentation and tested it on natural forests in Ontario, Canada; they achieved 69%, 65%, and 73% accuracy for closed canopy coniferous, deciduous, and mixed wood forests, respectively [23]. Lu et al. developed a bottom-up method based on the intensity and 3-D structure to segment individual deciduous trees from a leave-off LiDAR point cloud; in an experiment in a forest at Shavers Creek Watershed in Pennsylvania, they achieved an overall F-score of 0.9 [2]. However, the demand of LiDAR intensity information and leave-off condition of trees limits the further application of this method. Although relatively mature methods are available for the segmentation of individual trees from airborne LiDAR data, owing to differences in the viewing geometry and information content, the algorithms and methods designed for airborne LiDAR data cannot be directly translated to TLS and MLS data [16], [18]. However, existing methods developed for TLS and MLS data cannot appropriately deal with highly overlapped canopies. This study proposes a technical framework for segmenting individual tree points from TLS and MLS data. The remainder of this paper is organized as follows. Section II describes the workflow and technique of the proposed framework in detail. Section III presents the experiments and evaluations of the proposed framework with two different LiDAR datasets. Section IV discusses several key parameters and certain shortcomings of the framework. Finally, Section V presents the conclusions of this study. II. METHODOLOGY Fig. 1 shows the flowchart of the proposed technical framework for individual tree point segmentation. It contains six main steps: 1) data preprocessing, 2 octree construction, 3) spatial clustering, 4) tree stem detection, 5) initial segmentation, and 6) fine segmentation. For the data preprocessing of the original LiDAR point cloud, the ground points and building fac¸ade points are removed. An octree structure for points spatial indexing is then constructed, and the preprocessed points are clustered into local blocks (point sets) according to their connectivity. For each clustered point set, an octree structure is built again, and all tree stems in the point
set are detected by analyzing the octree nodes’ horizontal histogram. Initial tree segmentation is then conducted based on the stem location, which generates the tree core region and overlapping region. Finally, Ncut method with modified node similarity calculation is adopted for overlapped canopy segmentation and deriving individual tree points. The ground points and building fac¸ade points tend to bridge points from different trees into one single point set; if they are not removed, they may influence the spatial clustering procedure. Moreover, building fac¸ade points will affect the stem detection result considerably if a tree stands too close to them. For removing ground points, the lasground tool in lastools shows good performance and could be used directly for this purpose. For detecting and eliminating building fac¸ade points, the density of projected points method [27], [28] is selected for its fast calculation speed and robustness. A. Octree Construction The objective of octree construction is to provide an efficient spatial index with high position accuracy. Compared with airborne LiDAR, TLS data and MLS data have much higher point density; therefore, they can describe a tree structure in more detail. However, the high point density (hundreds to thousands of points per square meter) requires a large amount of computer resources for spatial searching if the original LiDAR points are processed directly. Thus, it is essential to build a spatial index for original TLS and MLS data for realizing better point cloud management. Octree is an efficient spatial index structure. The spatial index for LiDAR points can generally be grouped into two categories: object-based spatial indexes and space-based spatial indexes. The former organizes a dataset based on the distribution of spatial objects, such as R-tree [29], [30], and the latter subdivides a dataset based on the subdivision of the underlying space, such as quad-tree [31] and its 3-D extension, the octree [32]–[34]. Among them, the octree can be directly applied to point geometries, as opposed to only the bounding boxes that an R-tree relies upon. In addition, the leaf nodes in R-tree often overlap with each other, and this drawback does not exist in octree. Therefore, the octree affords distinct advantages for spatial indexing relative to R-tree [32]. To build an octree structure for LiDAR points, a minimum bounding voxel is first derived as the root node. If the root node does not satisfy the split stopping rule, it will be split into eight isochoric child nodes. The above judgment and partition is repeated on each child node (considered a minimum bounding voxel) until it satisfies the stopping rule. The most commonly used octree contains many leaf nodes with low position accuracy, which is called fake-fat nodes in this paper. This spatial index takes minimal node size (mns, also called granularity) and minimal number of points (mnp) as the split stropping rule [34], i.e., if a derived child node is smaller than the mns or has a point number less than the mnp, it will be treated as a leaf node. However, considering only the mnp and mns as split stopping rule, leaf nodes with large size but few LiDAR points inside them are much more likely to occur in areas with low point density, such as boundaries of an object. Fake-fat nodes can be categorized as border type and sparse
This article has been accepted for inclusion in a future issue of this journal. Content is final as presented, with the exception of pagination. ZHONG et al.: SEGMENTATION OF INDIVIDUAL TREES FROM TLS AND MLS DATA
Fig. 1.
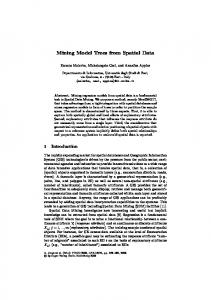
Fig. 2. nodes.
3
Flowchart of the proposed framework.
Example of border-type (green) and sparse-type (orange) fake-fat
type, as shown in Fig. 2. Border-type nodes are often found around the object boundary, where LiDAR points are strongly distributed on only one side or at a specific corner of the node. On the other hand, sparse-type nodes are usually found in an area with low point density, and inner points are considered to have a random distribution. Compared with normal leaf nodes, border-type fake-fat nodes have a few drawbacks: 1) the node position cannot represent the inner points’ average position because all points occupy less than half of the node’s space; and 2) pseudoneighbor nodes and LiDAR points are easily found during neighborhood searching because fake-fat nodes have large
size, and as it is easier to form a neighborhood relationship with other nodes, points with relatively far distance are likely to become neighbors for the pseudonode’s bridging. To reduce fake-fat nodes, this study modified the node splitting rule while constructing octree. In addition to the most commonly used mns and mnp [34], we add a point distribution schema (pds) for the new octree structure. When constructing the octree, if the current node’s size is larger than the mns and its inner points are less in number than the mnp, the pds judgment will be triggered to check the point distribution. If all points occupy less than half of the node space, the splitting continues; otherwise, the splitting procedure is stopped for this node and it is labeled as a leaf node. With the additional rule, border-type fake-fat nodes can be avoided in the derived octree structure, and, thus, the nodes’ average position accuracy, even in the object’s boundary region, will improve. In this study, the octree nodes are defined to possess a structure that includes the node position (x-, y-, and z-coordinates of the node’s geometric center), node size (the length of the sides), LiDAR points, father node’s and children nodes’ pointers, and a flag that shows the classification result. For ease of expression, the minimal node size in the stopping rule is set as mns, and the minimal number of LiDAR points is set as mnp; the octree is constructed by the following steps (see Fig. 3 shows the flowchart). Step 1: Input given LiDAR points cloud, get extent in three directions (MaxX, MinX, MaxY, MinY, MaxZ, MinZ). Step 2: Build root node according to points’ extents. The root node should begin with (MinX, MinY, MinZ) for the leftdown corner, and it should have a size of integer power of 2 for convenience of calculation, as shown in (1). All LiDAR points should then be added to the root node Sizero ot = 2N +1 ,
2N < MaxD ≤ 2N +1 .
(1)
This article has been accepted for inclusion in a future issue of this journal. Content is final as presented, with the exception of pagination. 4
IEEE JOURNAL OF SELECTED TOPICS IN APPLIED EARTH OBSERVATIONS AND REMOTE SENSING
distributed (on the other side). Otherwise, they are considered to have a random distribution. Step 8: Apply octree partition to node PN, update LiDAR points in each children node, and clear all points in PN to free computer resources. Push nonempty children nodes into WNQ, and then, jump to step 4. B. Spatial Clustering Using Octree Node Connectivity
Fig. 3.
Flowchart for constructing octree.
Fig. 4.
Example of horizontal histogram profile for a tree and a light pole.
Here, MaxD = Max((MaxX − MinX), (MaxY − MinY), (MaxZ − MinZ)). Step 3: Build work node queue (WNQ), push root node into WNQ. Step 4: If WNQ is empty, then the octree is built successfully, and the procedure is ended. Otherwise, the first element PN is popped from WNQ. Step 5: Label PN as a leaf node if its size is no larger than mns, and then jump to step 4. Otherwise, go to the next step. Step 6: Jump to step 8 if the number of points in PN is larger than mnp. Otherwise, go to the next step. Step 7: Analyze the points’ distribution schema in PN. If the points are strongly distributed on only one side or at a specific corner of PN, go to the next step. Otherwise, jump to step 4. To judge the PN’s points’ distribution schema, we first apply an octree partition to PN, which splits the PN into eight isochoric children nodes, and then, all empty children nodes are searched. If there exist four coplanar empty children nodes (any face of PN), the PN’s points are considered to be strongly
After data preprocessing, the ground points and building fac¸ade points are removed, and the remaining points are spatially clustered; however, points belonging to a specific object are still discrete and unorganized in the point cloud, and they need to be organized through certain strategies before tree extraction or segmentation. The basic purpose of spatial clustering is to group points from the same object (considered to be spatially adjacent), and differ with other groups based on gaps existing in the point cloud, so that individual tree points can be derived directly. However, gaps in the point cloud exist not only between different trees but also inside a single tree (caused by occlusion). Furthermore, tree canopies often overlap with each other in many cases; this decreases the gaps between trees and increases the difficulty of isolating points from different trees. Therefore, in this study, spatial clustering is practically applied to partition the entire point cloud into local blocks of point sets, as a win-win solution for correctness and completeness in direct single tree derivation is difficult to achieve. Most existing studies adopt the Euclidean Distance for points spatial clustering [8], [22], which labels points as the same class if their Euclidean distance from each other is less than a given threshold. The drawback of this method is that for a complicated environment, specifying a proper threshold is very challenging [8]. In this study, we cluster the points using the octree node adjacency, labeling spatially adjacent nodes, and inner LiDAR points as the same class. To judge whether nodes are spatially adjacent, 26 neighborhoods are searched, i.e., if nodes i and j satisfy the following formula: ⎧ X − Xj