consistent and reproducible second opinion to a radiologist. Currently, most CAD systems are designed to prompt suspicious regions. However, while there has.
SEGMENTATION OF MAMMOGRAMS IN TOPOGRAPHIC APPROACH Byung-Woo Hong and Michael Brady Medical Vision Laboratory, University of Oxford, U.K. Abstract. This paper presents a novel approach to finding a priori interesting regions in mammograms. We propose a topographic representation called the iso-level contour map consisting of iso-level contours at multiple intensity levels, in order to delineate those regions of interest (ROI’s) in mammograms which appear to be salient. Such salient areas form a dense quasi-concentric pattern of iso-level contours and these are made explicit in the topographic representation. The algorithm detects object boundaries by analysing geometrical and topological properties of iso-level contours. The “saliency” of a region is measured topologically as the minimum nesting depth of contours using an inclusion tree that is a hierarchical representation of the enclosure relationship between contours. The result is an analysis of the global structure of objects in mammograms. Experimental results are presented. 1.
INTRODUCTION
Image segmentation is a key early step in a large number of image analysis and image understanding applications. The aim is to delineate regions, each of which to a certain extent uniform in some appropriate measure. However, universally accepted measures of uniformity do not exist. This has the consequence that segmentation depends critically on the particular problem or application. In our case, the application is early detection of cancer in (x-ray) mammograms. Image segmentation aims to detect abnormalities and to obtain anatomical information about the breasts. Breast cancer is the leading cause of death from cancer among women in many countries, particularly in the West. Mammography is the most cost effective method to detect early signs of breast cancer. However, mammograms are highly complex images and the signs of disease are subtle. It has been found that a large number of lesions (approximately 25%) of cancers are missed at screening. For this reason, there has been considerable effort aimed at developing computer-aided diagnosis (CAD) systems that might provide a consistent and reproducible second opinion to a radiologist. Currently, most CAD systems are designed to prompt suspicious regions. However, while there has been substantial progress in the automatic detection of microcalcifications, progress has been considerably slower in the reliable detection of malignant masses. In this paper, we introduce a novel segmentation method for mammograms and investigate its application
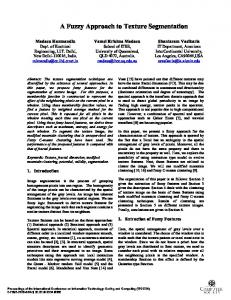
Fig. 1. (a) An original mammogram with a mass and a pectoral muscle. (b) Denoise Image using anisotropic diffusion filter. (c) Iso-level contour map based on the denoise image (b). to the detection of regions of interest (ROIs), which include both masses and (for mediolateral oblique MLO mammograms) the pectoral muscle. Karssemeijer and te Brake [2] proposed detecting stellate lesions using an orientation map formed from linear structures. Zhang et al. [7] used the Hough spectrum to detect spiculated lesions. Zwiggelar et al. [8] developed a statistical model to describe and detect abnormal patterns of linear structures of spiculated lesions. Although previous methods have shown some promise, statistical and local approaches currently generate too many false positives to be useful in clinical practice, and they are relatively slow and inaccurate. Our segmentation method makes explicit both structural and global information using a topographic representation that provides both geometrical and topological properties of objects in an image. 2.
TOPOGRAPHIC REPRESENTATION
A. Iso-level Contour Map The topographic representation is built from iso-level contours or isophotes: curves of constant intensity (or, more usefully, curves of constant hint [1]). An image is considered as a surface in which the intensity at each pixel represents height in three-dimensional space. An ordered set of connected pixels at the same height (intensity) forms an iso-level contour. That is, an isocontour C for a given grey level l from the image function I (i, j ) is given by: C ( I ) = {(i, j ) | I (i, j ) = l},
∀(i, j ) ∈ Ω
where Ω is a domain of the image I. An iso-level contour is constrained to be a simply closed curve satisfying the conditions of a Jordan curve. A digital image I(i,j) is generally modelled as a discrete function, the value of which represents intensity where an image domain Ω ⊂ Ν 2 . In practice, it is hardly possible to draw a continuous curve of a constant intensity in a discrete domain due to the nature of image acquisition such as intensity quantisation and noise intervention. For this reason, bilinear interpolation is used to obtain a continuous image surface on which isolevel contours are well defined. A topographic representation is obtained by an isolevel contour map consisting of a set of iso-level contours at multiple values over the intensity range of an image. The iso-level contour map CM(I) for an image I is given by: CM ( I ) = {C (li ) | li ∈ L,
i = 1,2, m , n},
li ≠ l j
L = [ I min , I max ],
if i ≠ j
where L is the intensity range of a given image I between minimum intensity I min and maximum intensity I max , and n denotes the quantisation needed to reliably detect features. A contrast invariant representation can be achieved by an iso-level contour map of iso-level contours at evenly spaced grey levels as shown in Figure 1 (c). B. Anisotropic Diffusion As noted above, contour extraction is sensitive to noise and this causes contours to be jagged. A noise reduction scheme is necessary to eliminate noise and to remove insignificant details so that smooth contours can be extracted. An anisotropic diffusion filter [5] is applied to remove noisy fluctuations and to enhance edges that contain semantically useful information. A denoise image is presented in Figure 1 (b) using Weickert’s edge enhancing filter. 3.
Fig. 2. (a) An example contour map. (b) Inclusion tree extracted from (a).
SEGMENTATION
A. Inclusion Tree The iso-level contours that represent distinctive regions with respect to the local background are detected by analysing the iso-level contours generated from the image. The pattern of contours on the iso-level contour map is formed depending on the topological and geometrical properties of objects in the image. A quasiconcentric pattern of contours is observed within a dense object, referred to as a salient region. In addition, an abrupt intensity change through a salient region forms a conspicuous dense contour pattern. The topological change of the contour pattern implies a transition from one object to another, or to the background.
The topological and geometrical configuration of the contours in an iso-level contour map can be described by the relationship of enclosure. The enclosure relationship between contours is guaranteed by the Jordan curve theorem. Any iso-level contour C divides an image domain Ω into two disjoint regions, an interior Int(C) and an exterior Ext(C) of the contour C. The enclosure relationship ⊏ between two iso-level contours, Ci and Cj, is given by: Ci ⊏ Cj if ∀( x, y ) ∈ Ci ,
( x, y ) ∈ Int (C j )
The enclosure relationship between all the extracted isolevel contours can be represented in the form of a tree structure, called the inclusion tree and shown in Figure 2. The inclusion tree provides a hierarchical
representation of the enclosure relationship between contours. In the inclusion tree, each node corresponds to an iso-level contour and the iso-level contour at an ancestral node encloses the iso-level contours at its descendents. In particular, the root node of the inclusion tree represents the boundary of a whole image. A path P in the inclusion tree is an ordered sequence of the nodes defined by: P = (C1 , C 2 , m , C n ),
Ci ⊏ Cj
if i < j.
where Ci’s are iso-level contours. The path represents a hierarchical sequence of the iso-level contours from the innermost contour to the outermost contour in a nesting structure. The hierarchical information in the inclusion tree provides an efficient way to examine the topological and geometrical structure of an image. B. Algorithm The proposed segmentation algorithm identifies salient regions by analysing the topological and geometrical structure of the contours on the iso-level contour map using the inclusion tree. To this end, it is assumed that the salient region forms a dense quasi-concentric pattern of iso-level contours within the region and that the transition from the salient region to the local background leads to the break up of the nested contour structure. The saliency of a region is measured by the nesting depth of the contours that draw boundaries of the regions. The nesting depth for a given contour C is given by the number of contours from the innermost contour within a nesting structure that is enclosed by the contour C. In the inclusion tree, the nesting depth for a contour C is equivalent to the distance from the node that represents the contour C to the terminal node in the subtree, the root node of which is the contour C. However, there may exist more than one terminal node in the subtree and the minimum nesting depth corresponding to the minimum among the values of the nesting depths is used as a measure of saliency for the iso-level contour. To identify iso-level contours of salient regions, the contours at branching nodes that have more than one immediate child node are initially selected. The number of children in the inclusion tree implies the topological and geometrical change of objects in the image. The contours at immediate child nodes of the branching nodes, called the base nodes, are chosen to be candidates for salient regions, since they support the inner nesting structures. Then, the minimum nesting depth for chosen base contours at the base nodes is measured. The iso-level contours that draw the boundary of salient regions are likely to produce higher scores of the minimum nesting depth. At the same time, the contours within distinctive regions are generally enclosed one nested structure of contours.
Fig. 3. Two most significant regions in terms of the minimum nesting depth from the example in Fig. 1. (a) A detected mass. (b) A detected pectoral muscle. 4.
APPLICATION
The segmentation algorithm is applied to the detection of regions of interest (ROI’s) in mammograms, including masses and the pectoral muscle. To evaluate the performance of the algorithm, the MIAS mammogram database [5] was used. In mammograms, masses are assumed to be distinctive regions that are relatively brighter than the surrounding background, while the pectoral muscle appears to be more uniformly bright and to appear in a predictable location (in a MLO image). Note, however, that bright regions do not necessarily correspond either to masses or to the pectoral muscle. For the preprocessing step, an anisotropic diffusion filter, specifically Weickert’s diffusion tensor, was applied to reduce noise and unnecessary small features. The diffusion process is controlled by the values of three parameters: the contrast k, the scale σ, and the number of iterations t [4]. After noise removal and edge enhancement, the isolevel contours were extracted at grey levels that evenly divide the entire range of intensity of an image according to the desired quantisation. This quantisation is related to the size of objects it is desired to segment: a finer quantisation is appropriate for more subtle features such as masses, while a coarser quantisation is appropriate for more distinctive features such as the pectoral muscle. The inclusion tree was built based on the extracted contours and the contours at base nodes in the inclusion tree were searched for candidates of masses and pectoral muscles. The minimum nesting depth was measured for the selected base contours at the base nodes and a threshold was set with respect to the minimum nesting depth to remove less significant regions. The minimum nesting depth is not directly related to the detection of the pectoral muscle and the mass. However, many of insignificant regions can be removed by taking a small
threshold with respect to the minimum nesting depth. The value of threshold may be related to the number of quantisation at generating the iso-level contour map. To assess the algorithm, 40 mammograms including masses and pectoral muscles are selected from the MIAS database. The algorithm detected salient regions that include pectoral muscles and masses concurrently. The identification of pectoral muscle can be achieved using a geometrical constraint that the pectoral muscle appears as a distinctive bright region with a triangular shape on the top corner (left or right) in the breast region. However, it is more difficult to identify mass due to the high variability of mass appearance. Thus, relevant features that may include density, shape, texture, location and size can be employed to identify masses even though the identification and classification of masses is not dealt with in this paper. Preliminary results are very encouraging: even without detailed consideration of known anatomical features of malignant masses, or the interesting tissue [1] of the pectoral muscle, the segmentation algorithm detected 37 out of 40 masses in the selected mammograms from the database. The missed ones include mass with a very low contrast against surrounding its background since it is included in a dense tissue region. The pectoral muscles are successfully identified from all test cases.
REFERENCES
5.
DISCUSSION AND CONCLUSION
We have developed a segmentation method to detect salient regions in mammograms. Salient regions correspond to distinctive areas and may include masses and the pectoral muscle. A topographic representation has been developed using iso-level contours and the topological relationship between contours is efficiently described by the inclusion tree. The segmentation algorithm is performed analysing the geometrical and topological properties of contours. The saliency of contours are measured by the minimum nesting depth, which is thresholded to remove less significant regions. It is necessary to choose an optimal threshold to reduce as far as possible the number of false positives. When the contours corresponding to salient regions are extracted, features that characterise them are calculated in order to remove false positives. Features currently used include shape, size, location and texture information. Preliminary results show that the topographic representation using iso-level contours is a robust and efficient representation for the characterisation of mammographic features. The segmentation algorithm is both simple yet efficient for delineating salient regions in mammograms. It appears that a global structural approach may give greater performance than a local statistical approach in the segmentation of mammograms. The rate of detection of mass indicates that this method may be used as an efficient prompt system to assist radiologist for detecting masses in the diagnosis of breast cancer.
1.
Highnam R, Brady M, 1999, “Mammographic Image Analysis”, Kluwer Academic Publisher
2.
Karssemeijer N and te Brake G, 1996, “Detection of stellate distortions in mammogram”, IEEE Trans. on Medical Imaging, 15, 611-619
3.
Linguraru M and Brady J, 2002, “A non-parametric approach to detecting microcalcifications”, International Workshop on Digital Mammography, Lecture Notes in Computer Science, Springer Verlag Berlin Heidelberg
4.
Shiffman S, Rubin G and Napel A, 2000, “Medical Image Segmentation Using Analysis of IsolableContour Maps”, IEEE Trans. on Medical Imaging, 19, 1064-1074
5.
Suckling J, Parker J, Dance D, Astley S, Hutt J, Doggis C, Ricketts I, Stamatakis E, Cerneaz N, Kok S, Taylor P, Betal D and Savage J, 1994, “The mammographic image analysis society digital mammogram database”, Proc. 2nd International Workshop on Digital Mammography
6.
Weickert J, 1997, “A Review of Nonlinear Diffusion Filtering”, Scale-Space Theory in Computer Vision, Lecture Notes in Computer Science, Vol. 1252, Springer, Berlin, 3-28
7.
Zhang M, Giger M, Doi K, 1996, “Mammographic texture analysis for the detection of spiculated lesions”, Proc. 3rd International Workshop on Digital Mammography
8.
Zwiggelaar R, Parr T, Schumm J, Hutt W, Taylor J, Astley S and Moggis C, 1999, “Model-based detection of speculated lesions in mammograms”, Medical Image Analysis, 3, 39-62.