Segmenting Microorganisms in Multi-modal Volumetric Datasets Using a Modified Watershed Transform Steven Bergner1, Regina Pohle1, Stephan Al-Zubi1, Klaus Tönnies1, Annett Eitner2, Thomas R. Neu2 Department of Computing Science, Otto-von-Guericke-University Magdeburg, Germany
[email protected], {regina,alzubi,klaus}@isg.cs.uni-magdeburg.de http://isgwww.cs.uni-magdeburg.de/bv 2 Department of Inland Water Research Magdeburg, UFZ Centre for Environmental Research, Leipzig-Halle, Germany {eitner,neu}@gm.ufz.de 1
Abstract. Aquatic interfaces in the environment are colonized by a large variety of pro- and eucaryotic microorganisms, which may be examined by confocal laser scanning microscopy. We describe an algorithm to identify and count the organisms in multi-channel volumetric datasets. Our approach is an intermediate-level segmentation combining a voxel-based classification with low-level shape characteristics (convexity). Local intensity maxima are used as seed points for a watershed transform. Subsequently, we solve the problem of oversegmentation by merging regions. The merge criterion is taking the depth of the ‘valley’ between adjacent segments into account. The method allows to make correct segmentation decisions without the use of additional shape information. Also this method provides a good basis for further analysis steps, e.g. to recognize organisms that consist of multiple parts.
1
Introduction
In nature microorganisms are mainly associated with interfaces. These interfacial communities are referred to as microbial biofilms consisting of procaryotic and eucaryotic microorganisms [1]. The organisms in these films are important for the sorption and/or degradation of a wide range of anorganic and organic contaminants. Biofilms have a cellular and a polymeric component and may be ideally examined fully hydrated by using confocal laser scanning microscopy [2]. The samples used for this study were lotic biofilms exposed to light. The distribution of bacteria was determined after staining with a nucleic acid specific fluorochrome (SYTO9). The emission signal of SYTO9 was recorded in the green channel. The lectin specific extra-cellular polymeric substances (EPS) were imaged after staining with Phaseolus vulgaris-TRITC lectin and recorded in the red channel. Green algae were visualized due to their chlorophyll autofluorescence recorded in the far-red channel. Cyanobacteria were distinguished due to their pigments (chlorophyll and
phycocyanin/phycoerythrin) resulting in a double signal recorded in the red and farred channel. In order to quantify the 4 signals recorded in the 3 channels it is necessary to find the border of the objects and split them correctly. Thresholding, which is usually employed in quantification procedures, is not suitable as it is not able to handle the large variation in signal intensity. For a satisfactory classification it would be necessary to take size and shape characteristics of the objects into account. But because of the immense diversity of shape in the world of microorganisms, it is difficult to include such information as a-priori knowledge. Additional problems for shape-based methods arise from different scaling and blurring along z-axis, which is due to the acquisition method. There are a number of algorithms for automatically detecting cells in images of laser-scanning microscopy. They usually rely on a multi-level approach. In the first stage a coarse, purely voxel-based segmentation is performed. For that task it is possible to utilize threshold methods [4, 5, 7] or trained neural networks [6]. As a result some objects are correctly segmented and others are still clustered. Those clusters can be divided using higher-level a-priory knowledge. The type of knowledge used in this second step can be categorized in two groups: 1. Shape Based Methods Approaches used here include the use of neural networks, trained to recognize convex shapes [6], or high-level Markov random-fields [8], or fitting hyperquadrics to previously extracted, polygonal shapes [5]. All methods assume that the cells that have to be divided have a similar shape, which is known in advance. 2. Intensity Based Methods This group includes the searching for an optimal path, which minimizes a cost function [9], and the watershed transform (WST), which is either used as morphological WST [7] or as marker based WST [3,4], to divide clustered nuclei. Problems for these methods are caused by noise and an inhomogeneous intensity distribution in the cells, which lead to over segmentation and result in higher number of cells than actually contained in the sample. Also, some of these approaches have only been investigated for 2D images. In our application we need to analyse the entire volume. Counting organisms in separate layers is only of limited use for the analysis. Hence, a 3D version of the algorithm is required or a way to connect results from 2D analyses. Due to the versatile structure of organisms or pollution, several local intensity maxima are found in each object. That makes the assumption of unique markers hard to fulfil. Thus, a method is required that makes use of the entire information and is robust against local disturbance. The remainder of this paper is organized as follows: We first describe the problem that we are going to solve. Then we present an algorithm based on the watershed transform. By introducing a new merge criterion the results are made more robust against misleading seed points and locally varying brightness and contrast. Tests on several data sets are presented and discussed. Finally, conclusions are given.
2
Segmentation of Microorganisms in Laser Scanning Microscopy
2.1
Problem Description
The images show a large diversity of shapes among the procaryotic and eucaryotic microorganisms. The autofluorescence signals and fluorochrome stains have been selected in order to record their emission signals in different channels. However, correlation between channels is possible and sometimes characteristic for some object classes. The concentration of the fluorochromes varies within the microorganisms and among different datasets. Furthermore, densely packed structures such as clusters of algae or bacteria lead to a signal increase due to the partial volume effect (see Fig. 1). Thus, intensity thresholding will not be applicable and using shape-based segmentation will be difficult because of the large variety of shapes. We developed a low-level method for segmentation that estimates object boundaries based on intensity and local contrast.
a Fig. 1:
b
A cluster of algae shown in two different layers a) Algae are not well separated b) Borders can be clearly distinguished. The gray cross indicates position of horizontal (bottom) and vertical slices (right)
The algorithm was developed based on the following assumptions. The type and concentration of fluorochromes indicate important structural constituents of the biofilms. The intensity is often highest inside of the organisms and decreasing to the outside. This holds for different kinds of organisms at different levels of contrast and brightness. Each of the three classes of organisms can be found in one of the three channels. In the case of cyanobacteria, the co-occurrence in two different channels (chlorophyll and polymer) is characteristic. Due to vertical blurring it can happen that organisms that have a clear shape in one channel are disturbed by other organisms that are visible at almost the same position in a different channel. To avoid the influence of other channels at this early stage of analysis the initial segmentation is carried out in each channel separately.
2.2
Segmentation
Organisms that give a signal in different channels are later classified by correlating segmentation results from the respective channels. In each channel, boundaries between organisms as well as between organism and background are found applying a modified watershed transform with markers [3,4]. The watershed transform (WST) [7] can separate segments based on local maxima thus avoiding segmentation errors due to intensity variations. Applied without markers, it will lead to over-segmentation, which can be overcome by applying a hierarchical WST [10]. However, the hierarchical WST does not use knowledge about possible locations of segments and may accidentally merge different organisms. We chose a marker-based WST with markers being placed into the segments in order to avoid this. Boundaries between organisms are characterised by local minima whereas those to the background are characterised by an intensity threshold. Thus, we applied a marker-based WST to the data with local intensity minima being the watersheds and included a threshold component to account for the boundary to the background. The main challenge is to find marker positions. We applied a strategy where almost every local maximum in regions above a given intensity threshold is treated as marker. We accept that an organism may have initially several markers set. The only assumption made is that the initial segments are covering at most one object. Regions are then merged based on their characteristics and features of their common boundary. The algorithm consists of three steps: 1. Initial marker placement. 2. Application of the marker based WST. 3. Merging of regions that belong to the same organism. Markers are placed at local maxima in a 3x3x3 neighbourhood. Markers in regions of constant value are placed only if the region is not adjacent to pixels of higher intensity value. In this case a distance transform is carried out in the region and the marker is placed at the point, which has the highest distance to the boundary. Markers are not placed if their absolute intensity is below a threshold torg that differentiates organism intensities from background. The threshold is chosen high enough as to securely exclude any background voxels for being selected as marker but lower than the lowest local maximum of the object voxels. It was found experimentally and was set to torg=70 (of 255) for all data sets. After having determined the markers, the watershed transform is carried out. A local threshold tseg is determined for each marker in order to pre-define a watershed, which prevents water flowing into the background. It was set to 30% of the local maximum value at the marker position. The advantage of using a ratio instead of a fixed threshold is that the cut-off will adapt to the differences in the partial volume effect at different brightness of segments. Due to local maxima from noise or varying fluorescence signals in the organisms, the initial result is massively over-segmented. In the original watershed transform this is reduced by thresholding gradient magnitudes. Since we are working in the intensity domain this is smoothing, which would just reduce, but not solve the problem of oversegmentation. Smoothing also blurs shape details, which might be necessary to distinguish objects.
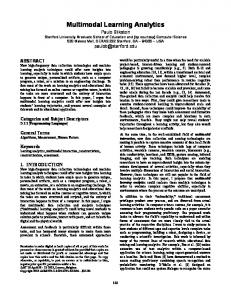
We decided against smoothing and merged segments based on characteristics of segments. After applying the WST to each channel independently, segments from corresponding channels are merged, if they overlap and belong to the same class of organism (this is the case, e.g. for cyanobacteria). Two segments in two channels are merged if their spatial overlap is greater than 33% of their volume. This does not necessarily merge segment of the same channel. It can happen, though, that a segment of another channel is working as a 'bridge'. The major work of removal of overm2 segmentations happens in the next part of this m1 step. Two segments are joined, if they have a ma common boundary and if for their two intensity maxima m1 and m2 with m1≤m2 and the highest intensity value ma of their boundary the following holds (see Fig. 2):
ma > t bnd w ⋅ m1 + (1 − w) ⋅ m2
Fig. 2: Adjacency maximum is used as merge criterion
(Eq. 1)
The parameter 0