International Journal of Bridge Engineering (IJBE), Special Issue 2017, pp. 1-24
SEISMIC PERFORMANCE OF HOLLOW-CORE COMPOSITE BRIDGE COLUMNS Omar I. Abdelkarim1 and Mohamed A. ElGawady2 1
2
University of Sherbrooke, Department of Civil Engineering, Canada Missouri University of Science and Technology, Department of Civil, Architectural & Environmental Engineering, USA e-mail:
[email protected],
[email protected]
ABSTRACT: This paper presents the behavior of hollow-core fiber reinforced polymer-concrete-steel (HC-FCS) bridge columns under seismic loading. The HC-FCS column consists of an outer fiber reinforced polymer (FRP) tube, an inner steel tube, and a concrete shell between them. Seven large-scale columns were tested under combined constant axial compressive and cyclic flexural loadings until failure. The investigated columns were one reinforced concrete (RC) column, four HC-FCS columns, and two repaired HC-FCS columns. The outer diameter of each column was 610 mm (24 inches) and the height was 2,413 mm (95 inches) with span-to-depth ratio of 4.0. The steel tube of each HC-FCS column was embedded 635 mm (25 inches) into its own footing while the FRP tube stopped at the top of the footing. The FRP confinement ratio, the steel tube diameter-to-thickness ratio, and the steel tube diameter were examined during this study. This research revealed that a well-designed HC-FCS column can achieve a high lateral drift of 15.2%. The moment capacity of HC-FCS columns was controlled mainly by the characteristics of the inner steel tube. The maximum lateral drift and displacement ductility were controlled mainly by the ratio of FRP confinement ratio-to- steel tube strength. The plastic hinge length of the HC-FCS columns was controlled by the FRP confinement ratio. The modes of failure of the columns were FRP rupture or steel tube tearing after severe local buckling. KEYWORDS: Accelerated Bridge Construction; Composites; FRP; Hollow Columns
1
INTRODUCTION
The usage of fiber reinforced polymer (FRP) composites in civil engineering structures continues to grow at an impressive rate due to their low weight-tostrength ratio and high durability under severe conditions [1-14]. Hollow-core FRP-concrete-steel (HC-FCS) column is one of the recent innovation in the
2
Seismic performance of innovative hollow composite bridge columns
field of bridge construction. This column consists of a concrete shell placed between an outer FRP tube and an inner hollow steel tube [8, 15]. HC-FCS column pieces together the benefits of the FRP, concrete, and steel in one structure. The FRP tube confines the concrete shell hence it increases the concrete ultimate strain. The steel tube provides the column with its flexural and shear strength. The concrete shell laterally supports the steel tube delaying its local buckling. The concrete shell also improves the flexural resistance of the columns. The concrete shell along with the FRP tube, also, protects the steel tube from corrosion effect unlike the exposed steel structures. Hollowing the steel tube reduces the freight costs should the column would be precast which places the HC-FCS column as a viable option for accelerating bridge construction. Many research groups investigated the behavior of the HC-FCS columns under axial compression loading [e.g., 16-18], flexural loading [e.g., 19, 20], combined flexural and axial compression loading [e.g., 21-24], and vehicle collision [25]. The HC-FCS columns showed high ductile performances under these different loading conditions. This paper introduces experimental testing of seven large-scale columns under combined axial-flexural loading. The columns were four HC-FCS columns, one RC columns, and two repaired HC-FCS columns. Controlling parameters were investigated in this study including the effects of the FRP confinement ratio, steel tube diameter-to-thickness ratio, and the steel tube diameter. Important terms of the HC-FCS columns including the strength, lateral drift, displacement ductility, failure modes, energy dissipation, and plastic hinge length are discussed as well.
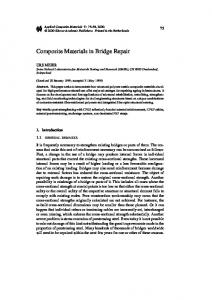
2 EXPERIMENTAL WORK 2.1 Description of specimens Four virgin and two repaired large-scale cantilever HC-FCS columns were tested under combined constant axial compressive loading and cyclic lateral loading (Table 1, Figs. 1 and 2). One more reinforced concrete (RC) column was tested as a reference specimen. All the tested columns had an outer diameter (Do) of 610 mm (24 inches) and shear span of 2,413 mm (95 inches) with a shear span-to-depth (H/Do) ratio of approximately 4.0. The F4-24-RC column had a longitudinal reinforcement of 8φ22 mm (8#7) corresponding to approximately 1.0% of the concrete cross-sectional area and it had a transverse spiral reinforcement of φ13@76 mm (#4 @ 3 inches) corresponding to volumetric reinforcement ratio of approximately 1.0%. The concrete cover beyond the spiral reinforcement was 12.7 mm (0.5 inch). The design and details of construction of the F4-24-RC were selected based on the current construction practice by the Missouri Department of Transportation (MoDOT).
Abdelkarim & ElGawady
3
The HC-FCS columns consist of an outer filament wound GFRP tube with thickness of either 3.2 mm (0.125 inch) or 9.5 mm (0.375 inch) (Table 1). The GFRP confinement ratio, calculated using Equation 1, ranged from 0.07 to 0.24. (1) where is the rupture stress of the GFRP tube in the hoop direction, is the GFRP tube thickness, Do is the column’s outer diameter, and is the characterized unconfined cylindrical concrete compressive strength. The steel tube diameter (Di) was either 406 mm (16 inches) or 356 mm (14 inches) and the thickness (ts) was either 6.4 mm (0.25 inch) or 12.7 mm (0.5 inch) which presents diameter-to-thickness ratios ranged from 32 to 64 (Table 1). The FRP tube in the HC-FCS column was truncated at the top face of its footing while the steel tube was embedded into its footing. Similar detail was used at the column head. The typical embedment depth of a steel tube into its footing and its column head was 635 mm (25 inches) representing 1.6Di to 1.8Di. All the HC-FCS columns did not include any shear or flexure rebar. The concrete shell thickness was either 102 mm (4.0 inches) or 127 mm (5.0 inches) representing 16.6% or 20.8% of the column diameter which produces a void ratio of either 44.4% or 34.0% of the column cross-sectional area, respectively. The expected moment capacity of each column was used to design the footing of each column following the ACI-318 [29] requirements. Each footing had a length, width, and depth of 1,524 mm (60 inches), 1,219 mm (48 inches), and 864 mm (34 inches), respectively. The footing of the F4-24-RC column had bottom reinforcements of 7 φ 22 mm (7 # 7), top reinforcements of 4 φ 22 mm (4 # 7), and a shear reinforcement of φ13 mm @ 64 mm (#4 @ 2.5 inches; Fig. 1a). The footing of each of columns F4-24-E324, F4-24-P124, and F4-24-E325 had bottom reinforcements of 7 φ 22 mm (7 # 7), top reinforcements of 6 φ 22 mm (6 # 7), and shear reinforcement of φ13 mm @ 64 mm (#4 @ 2.5 inches; Fig. 1b, 1c, and 1e). The footing of column F4-24- E344 had bottom reinforcements of 7 φ 25 (7 # 8), top reinforcements of 6 φ 25 (6 # 8), and a shear reinforcement of φ 13 @ 64 mm (#4 @ 2.5 inches; Fig. 1d).
4
Seismic performance of innovative hollow composite bridge columns
Table 1. Summary of the Columns’ Variables Column
F4-24-RC
F4-24-E324
F4-24-P124
F4-24-E344
F4-24-E325
Nominal outer diameter (Do, mm (inch))
610 (24)
610 (24)
610 (24)
610 (24)
610 (24)
Longitudinal reinforcement
8 φ 22 (#8)
N.A.
N.A.
N.A.
N.A.
Transversal reinforcement
spiral φ1376 mm (#4 3 inches)
N.A.
N.A.
N.A.
N.A.
Nominal inner diameter (Di, mm (inch))
N.A.
406 (16)
406 (16)
406 (16)
356 (14)
Steel tube thickness (ts, mm (inch))
N.A.
6.4 (0.25)
6.4 (0.25)
12.7 (0.50)
6.4 (0.25)
GFRP Thickness (tFRP, mm (inch))
N.A.
9.5 (0.375)
3.2 (0.125)
9.5 (0.375)
9.5 (0.375)
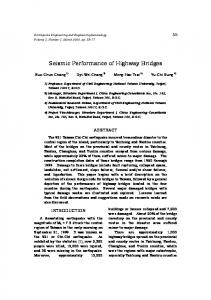
2.2 Rapid repair technique Quick repairing of damaged bridge columns after an earthquakes is crucial to allow the search, rescue, and recovery efforts to take place in the affected areas. The target of the quick repair is to partially restore the column’s strength and stiffness to permit using the column for a long or short-term as per the engineers’ examination recommends [26, 27]. During the course of this study, after testing the virgin columns F4-24-P124 and F4-24-E324 they were quickly repaired and tested as columns F4-24-P124-R and F4-24-E324-R, respectively (Fig. 2). The repair technique started with removing all big chunks of crushed concrete. Then, a vacuum was used to suck smashed concrete and dust. Three layers of unidirectional GFRP sheets (Tyfo SHE-51) were impregnated with two-component S-epoxy and were wrapped around each column in the bottommost regions where the GFRP tube ruptured. The height of the wrapped regions of the columns F4-24-P124-R and F4-24-E324-R were 1,140 mm (45 inches) and 635 mm (25 inches), respectively (Fig. 3a). This height included the ruptured regions of the GFRP plus an extra height of 127 mm (5 inches). The wrapping process took approximately 1 hour for each column. Heat chamber using Sonotube paperboard was installed around the wrapped FRP and the temperature was raised up to 50o C (122o F) using two heat guns for rapid curing of the GFRP wrapped layers (Fig. 3b). The temperature was measured
Abdelkarim & ElGawady
5
and kept constant for 4 hours to ensure the GFRP curing as per the manufacturer recommendations. Grout was injected using low-pressure pumping to replace the damaged concrete chunks (Fig. 3c). Grout injection took about 1 hour for each column. The total time of the rapid repair technique was approximately 6 hours; however, the column was tested 45 hours after starting the repair due to test preparation. Hence, the epoxy cured for 4 hours using high temperature and 41 hours in the laboratory temperature.
965 mm
Constant axial loading
Constant axial loading
965 mm
Lateral displacement Spiral 13 @ 76 mm
2,413 mm 8
1
4
22
7
22
2
type "E" thick. 9.5 mm
2,413 mm
2,032 mm
2
FRP tube
3
type "P" thick. 3.2 mm
2,413 mm
3
Concrete shell
1
8 13
864 mm
6
22
7
22
Concrete shell
10
13
10
13
635 mm
8 13
1,524 mm
Elevation
864 mm
6
22
7
22
10 13
635 mm 10 13
1,524 mm
1,524 mm
Elevation
Elevation
102 mm
Spiral 13 @ 76 mm
8 22
Steel tube thick. 6.4 mm
Steel tube thick. 6.4 mm
406
102 mm
Steel tube thick. 6.4 mm
FRP tube thick. 9.5 mm
406
FRP tube thick. 3.2 mm
610 mm
610 mm
610 mm
Sec. 1-1
Sec. 2-2
Sec. 3-3
(a)
(b)
(c)
Constant axial loading
965 mm
Constant axial loading
Lateral displacement
Hollow Tube
635 mm
Steel tube thick. 12.7 mm
2,032 mm
4
965 mm
Lateral displacement
635 mm
FRP tube type "E" thick. 9.5 mm
Steel tube thick. 6.4 mm
2,413 mm 2,032 mm
5
4
FRP tube
Hollow Tube
864 mm
2,032 mm
22
Lateral displacement
635 mm
FRP tube
Hollow Tube
Steel tube thick. 6.4 mm
2,032 mm
965 mm
Lateral displacement
635 mm
Hollow Tube
Constant axial loading
type "E" thick. 9.5 mm
2,413 mm
5 Concrete shell
Concrete shell
864 mm
6
25
7
25
10
13
635 mm 10 13
864 mm
6
22
7
22
10
635 mm
1,524 mm
1,524 mm
Elevation
Elevation 127 mm
102 mm
Steel tube thick. 12.7 mm
406
FRP tube thick. 9.5 mm
Steel tube thick. 6.4 mm
356
610 mm
610 mm
Sec. 4-4
Sec. 5-5
(d)
13
10 13
FRP tube thick. 9.5 mm
(e)
Figure 1. Details of the tested columns: (a) F4-24-RC, (b) F4-24-E324, (c) F4-24-P124, (d) F424-E344, and (e) F4-24-345
Seismic performance of innovative hollow composite bridge columns Constant axial loading
965 mm
Constant axial loading
Lateral displacement
635 mm
Steel tube 6 FRP tube thick. 3.2 mm
2,032 mm
2,413 mm
864 mm
25
7
25
7
2,032 mm
Concrete shell
10 13
635 mm 10 13
864 mm
Unidirectional thick. 3.8 mm
635 mm
6
25
10
7
25
635 mm
1,524 mm
1,524 mm
Elevation
Elevation
406
13
10 13
102 mm
Steel tube thick. 6.4 mm
2,413 mm
7
Wrapping FRP
1,140 mm
Unidirectional thick. 3.8 mm 6
Steel tube thick. 6.4 mm
FRP tube thick. 9.5 mm
Wrapping FRP
Lateral displacement
635 mm
Concrete shell 6
Hollow Tube
thick. 6.4 mm
965 mm
Hollow Tube
6
102 mm
FRP tube thick. 3.2 mm
Steel tube thick. 6.4 mm
406
FRP tube thick. 9.5 mm
610 mm
610 mm
Sec. 6-6
Sec. 7-7
(a)
(b)
Figure 2. Details of the tested repaired columns: (a) F4-24-P124-R and (b) F4-24-E324-R
2.3 Material properties The concrete compressive strengths of all the columns at 28 days and at the days of the tests are summarized in Table 2. The properties of the steel and GFRP tubes are summarized in Tables 3 and 4, respectively. The steel tube properties were based on test results of longitudinal coupons prepared according to ASTM A1067 [30]. Two types of GFRP tubes were used on the base of the resin; epoxy and Iso-polyester. This choice was because of the availability in the local market with the different thickness. Table 2. Concrete strength ( ) of the investigated columns Column
Column , MPa (psi) at
Footing , MPa (psi) at
F4-24-RC
F4-24-E324
F4-24-P124
F4-24-E344
F4-24-E325
28 days
32.6 (4,725)
32.6 (4,725)
39.8 (5,770)
39.8 (5,770)
35.6 (5,160)
day of test
36.0 (5,075)
36.0 (5,215)
43.0 (6,235)
53.7 (7,787)
36.8 (5,340)
28 days
36.6 (5,300)
36.6 (5,300)
56.0 (8,117)
56.0 (8,117)
52.9 (7,670)
day of test
37.8 (5,480)
38.9 (5,640)
61.4 (8,910)
59.3 (8,605)
56.8 (8,230)
The GFRP tubes properties were based on the manufacturer’s data sheets [31,
Abdelkarim & ElGawady
7
32]. Longitudinal coupons from each GFRP tube were prepared and tested according to the ASTM D3039 [33] and gave close results to those of the manufacturer. Although, the two GFRP tubes were made of different resins, the hoop FRP rupture strengths were almost the same. The material properties of the GFRP wrapping sheets used in the repair of the columns are summarized in Table 5.
(a)
(b)
(c) Figure 3. Rapid repair technique process: (a) wrapping GFRP layers, (b) applying heat chamber for rapid curing, and (c) injecting grout behind the GFRP tube
Table 3. Steel tube properties based on coupons’ tests Yield stress, MPa (psi)
Ultimate stress, MPa (psi)
Yield strain
Ultimate strain
324 (47,000)
483 (70,000)
0.16%
19.0%
8
Seismic performance of innovative hollow composite bridge columns
Table 4. FRP Tube Properties based on manufacturer’s data (FiberGlass systems [31, 32]) Axial compression
Hoop rupture
elastic
ultimate
elastic
tensile stress
modulus
stress
(far, MPa,
(Ea, GPa
(far, MPa,
(Eh, GPa,
(fhr, MPa,
(psi))
(ksi))
(psi))
(ksi))
(psi))
4.7 (677)
83.8 (12,510)
11.6 (1,680)
65.7 (9,530)
9.7 (1,400)
123.4 (17,900)
10.3 (1,500)
64.1 (9,300)
(ksi))
(F-Chem) [32]
Hoop
modulus
(Ea, GPa
Iso-polyester tube
Axial
stress
modulus
Epoxy tube (Green
Axial tension
compressive
elastic
Thread HP 16) [31]
Axial ultimate
20.8
276.9
(3,020)
(40,150)
15.2
275.9
(2,200)
(40,000)
Table 5. FRP wrapping Properties based on manufacturer’s data (Data from Fyfe Co. LLC. [34]) Total nominal thickness, mm (inch)
Elastic modulus, GPa (ksi)
Tensile strength, MPa (ksi)
Ultimate strain
3.8 (0.15)
26.0 (3,790)
575 (83.4)
2.2%
2.4 Test setup and loading protocol Each column was subjected to a constant axial compressive loading, using two external prestressed tendons, and cyclic lateral displacement loading (Fig. 4). The tendons were installed at the east and west sides to apply the axial load at the center of the column. The tendons were supported from the top by a rigid beam and from the bottom by the concrete footing. The axial load (P) was kept constant during the test at 490 kN (110 kips) representing 5% of the axial capacity ( of the RC column F4-24-RC. This level of applied load is a common value for the axial loads on bridge columns [35]. The was calculated using Equation 2 [29]. (2) where is the cross-sectional area of the longitudinal steel reinforcements, is the cross-sectional area of the concrete column, is the yield stress of the longitudinal steel reinforcements, and is the characterized unconfined cylindrical concrete compressive strength. The cyclic lateral displacement loading was applied using two hydraulic actuators connected to the column’s loading stub in one end and to the strong wall at the other end (Fig. 4). The lateral loading regime followed FEMA-461 [36] (Fig. 5). The displacement amplitude (ai+1) of the step (i+1) is 1.4 times the proceeding displacement amplitude (ai) of the step (i) with two executed cycles per each displacement amplitude. Each loading cycle was applied in 100
Abdelkarim & ElGawady
9
seconds corresponding to loading rate ranged from 0.25 mm/second (0.01 inch/second) to 1.27 mm/second (0.05 inch/second). The load was applied until failure of the test columns which was defined as when the column lost about 20% of its moment capacity or rupture of the GFRP tube. Automatic hydraulic jacks Rigid beam
Prestressing collets Load cells
Rigid beams Hydraulic actuator
Adapter
Dywidag bars
For cyclic lateral
Column
Strong wall
Prestressing strands For axial load
top webcam
Source of light
Prestressing strands
Source of light
bottom webcam
Concrete footing
Concrete pedestal Prestressing collets
Elevation
Side-view
Figure 4. Column test setup
Figure 5. Cyclic lateral displacement loading regime
2.5 Test instrumentations Linear variable displacement transducers (LVDTs), string potentiometers (SPs), and strain gauges were used to measure the global and local deformations of the tested columns (Fig. 6). Four vertical LVDTs were used at each north and south faces of the column to measure the vertical displacement at four cross-section levels to determine the column’s curvature at each level. However, each footing was fixed to the strong floor by dywidag bars and steel beams, a horizontal and vertical LVDTs were attached to each footing to measure if there was any
10
Seismic performance of innovative hollow composite bridge columns
sliding or uplifting. For the HC-FCS columns, four vertical and four horizontal strain gauges (SGs) were attached inside each steel tube at north, west, south, and east directions at 9 levels with 127 mm (5 inches) intervals with total SGs of 72. Four vertical and four horizontal strain gauges (SGs) were attached on each GFRP tube at north, west, south, and east directions at 6 levels with 127 mm (5 inches) intervals with total SGs of 48. Total of fourteen electrical strain gauges (SGs) were symmetrically installed, on the two north and south longitudinal steel rebars of the column F4-24-RC at seven levels, at the top of footing level and 3 above and below that level, with 101.6 mm (4 inches) intervals. Two webcams were installed inside the steel tube of the F4-24-P124 column to monitor the deformations of the steel tube (Fig. 4). H
V
H
H
V
V H
V
SGs in cross section 1-1 of steel tube Where H: horizontal strain gauge, V: vertical strain gauge H V
965 mm H
H
V
V
254 mm
191 mm 127 mm 127 mm 76 mm
H
1 9 x 127 mm
254 mm
1
25 mm
V
FRP SGs in cross section 1-1 of HC-FCS-column Where H: horizontal strain gauge, V: vertical strain gauge Vertical LVDT
152 mm
Horizontal LVDT Horizontal String Pot. SG
Figure 6. Layout of the instrumentations (1 mm = 0.04 inch)
3
RESULTS AND DISCUSSIONS
Figure 7 illustrates the hysteretic lateral drift vs. moment of the seven investigated columns. The lateral drift of each column was obtained by dividing the lateral displacement measured from the actuators and corrected for any footing sliding or uplifting, by the column’s height of 2,413 mm (95 inches). All the footing displayed negligible values of sliding and uplifting. The moment at the base of each column was obtained by multiplying the force collected from the actuators’ loading cells by the column’s height of 2,413 mm (95 inches).
Abdelkarim & ElGawady
11
3.1 Column F4-24-RC As shown in the Fig. 7a, the column F4-24-RC behaved linearly up to a lateral drift of 0.5% followed by yielding of the flexural rebar at drift of 1.1% and gradual stiffness degradation up to a lateral drift of 2.0%. The average moment capacity of the column was 594 kN.m (438 kip.ft) which occurred at a lateral drift of approximately 5.1%. The failure of the column occurred at the first cycle of the lateral drift of 10.9% due to fracture of one rebar at each of the north and south sides of the column. During the second cycle of the same drift, other two rebars fractured at each of the north and south sides with a total of six rebars fractured out of eight rebars (Fig. 8a). The severe damage zone of the column was within the bottommost 229 mm (9 inches) of the column. The readings of the strain gauge showed that the maximum axial tensile strain of the farthest flexural steel rebars was 18,000 με. The farthest steel rebars buckled in compression at a lateral drift of 7.5%. By the end of the test, the column displayed a displacement ductility of 9.9.
3.2 Columns F4-24-E324 and F4-24-P124 Both columns were identical but the GFRP thickness and resins. Both columns behaved linearly up to a lateral drift of 0.9% followed by yielding of the steel tube in tension at a lateral drift of 1.0% and 1.3% in the case of F4-24-E324 and of F4-24-P124, respectively. Both columns displayed gradual stiffness degradation up to a lateral drift of 2.8% and 2.6% in the case of F4-24-E324 and of F4-24-P124, respectively (Figs. 7b and 7c). Both columns reached approximately to the same average moment capacity being 732 kN.m (540 kip.ft) and 748 kN.m (552 kip.ft) which occurred at a lateral drift of 2.8% and 2.6% in the case of F4-24-E324 and of F4-24-P124, respectively. However, beyond the peak moment capacity the columns behaved differently. In the case of F4-24-E324, the moment was almost constant up to a lateral drift of approximately 6.0%. After that, the moment reduced gradually until failure occurred at a lateral drift of 15.2% when the GFRP tube ruptured at an ultimate hoop strain of 13,130 με (Fig. 8b). In the case of F4-24-P124, the column suffered stiffness softening until the failure of the column at a lateral drift of 5.8% when the GFRP tube ruptured at an ultimate hoop strain of 6,150 με (Fig. 8c). The strain readings showed that the maximum axial tensile strains of the steel tubes were 11,000 με and 14,000 με in the case of F4-24-E324 and of F4-24-P124, respectively. Furthermore, the steel tube locally buckled at a lateral drift of 3.0% in the case of F4-24-E324 while it did not buckle in the case of F4-24-P124 due to the low confinement ratio. The steel tube local buckling of the F4-24-E324 was the reason of the lower axial tensile strain than that of the F4-24-P124 as the steel tube could not gain more strains with cycling the column. The no buckling behavior was confirmed through axial strain measurement as well as the video cameras
12
Seismic performance of innovative hollow composite bridge columns
inserted inside the steel tube. The investigation after the test completion showed that the concrete shell within the bottommost 152 mm (6 inches) of the F4-24E324 was powder indicating good confinement from the GFRP and steel tubes. The concrete shell of the F4-24-P124 displayed moderate cracking but not reach to the same conditions of that of the F4-24-E324 due to the low confinement ratio. The difference in the confinement ratio also affected the displacement ductility. The columns displayed displacement ductility of 15.2, and 4.5 in the case of F4-24-E324 and of F4-24-P124, respectively.
3.3 Column F4-24-E344 The column F4-24-E344 behaved linearly up to a lateral drift of 0.5% followed by the appearance of a fine vertical crack at the midway of the footing length at a lateral drift of 1.4%. Further cycling led to yielding of the steel tube in tension at a lateral drift of 1.8% and propagation of cracks into the footing shaping the common cone-shape of the pullout failure due to the insufficient steel tube embedment length. Gradual stiffness degradation initiated at 0.5% and continued up to a lateral drift of 7.7% (Fig. 7d). The hysteretic curve of the column displayed significant pinching during the reloading cycles (Fig. 7d). The average moment capacity of the column was 1,186 kN.m (875 kip.ft) which occurred at a lateral drift of 7.7%. Severe damage of the footing occurred at a lateral drift of 8.0% and continued until the test was ended at a drift of 11.6% when the column strength dropped by 15% (Fig. 8d). The maximum hoop tensile strain of the GFRP tube was 11,800 με. The maximum axial tensile strain of the steel tube was 15,200 με while no steel tube buckling was recorded. The column displayed a displacement ductility of 6.4.
3.4 Column F4-24-E325 The column F4-24-E345 behaved linearly up to a lateral drift of 0.4% followed by tensile yielding of the steel tube at a lateral drift of 1.9% and gradual stiffness degradation up to a lateral drift of 3.0% when the column reached its moment strength of 677 kN.m (499 kip.ft) (Fig. 7e). Beyond drift 3%, the moment gradually decreased until a drift of 11.4% when the column strength dropped by 20% of the moment capacity which was considered as the failure of the column. However, cycling the column continued until a lateral drift of 15.6% when the actuators reached its maximum stroke. No damage occurred to the GFRP tube by the end of the test with the maximum recoded hoop tensile strain of 10,000 με. The maximum axial tensile strain of the steel tube was 10,600 με while the steel tube locally buckled at a lateral drift of 3.2%. Once the test was concluded, the steel tube was exposed and investigated by removing part of the GFRP tube. It was found that the steel tube suffered severe local buckling along with steel rupture within the bottommost 127 mm (5 inches) of the column (Fig.
Abdelkarim & ElGawady
13
8e). The column displayed a displacement ductility of 6.0.
3.5 Columns F4-24-E325 versus F4-24-RC The columns F4-24-E325 and F4-24-RC had approximately an equivalent steel weight of 113 kg per column in the form of steel tube or rebars and spiral reinforcement, respectively. As shown in Fig. 9, both columns displayed similar behavior up to lateral drift of 10.9% when the column F4-24-RC failed while column F4-24-E325 failed at drift of 15.2%. Both columns ultimately displayed steel fracture. The column F4-24-E325 could achieve a higher moment capacity than that of the column F4-24-RC by approximately 14%. The residual flexural strength of the column F4-24-E325 at a lateral of 15.6% was 311 kN.m (230 kip.ft) representing 46% of its moment capacity. The residual flexural strength of the column F4-24-RC at a lateral of 10.9% was 196.5 kN.m (145 kip.ft) representing 33% of its moment capacity. In addition, the construction of the F4-24-E325 column with the construction details of the HC-FCS columns took approximately 10% of the time required in constructing the column F4-24-RC at the High-bay Structures Lab at the Missouri University of Science and Technology.
3.6 Columns F4-24-P124-R versus F4-24-P124 The F4-24-P124-R was the repaired column of the F4-24-P124 using GFRP wrapping. Figure 7f illustrates the hysteretic lateral drift-moment relation of the column F4-24-P124-R. Figure 10 illustrates the hysteretic lateral drift-moment relation of the column F4-24-P124-R versus that of the column F4-24-P124. As shown in both figures the repaired column displayed higher deformation capacity due to the higher confinement ratio of the repair, i.e., the column F424-P124 and F4-24-P124-R had confinement ratios of 0.07 and 0.17, respectively. The confinement ratio of the repaired column was approximately 71% of that used for column F4-24-E324 who displayed deformation capacity of 15.2%. The average moment capacity of the column F4-24-P124-R was 693 kN.m (512 kip.ft) at a lateral drift of 8.0% while the average moment capacity of the virgin column F4-24-P124 was 748 kN.m (552 kip.ft) at a lateral drift of 2.6%. The column F4-24-P124-R failed by rupture of GFRP wrapping layers at a lateral drift of 13.2% (Fig. 8f). Figure 10 showed that the repaired column F424-P124-R could successfully retrieve 95% of the moment capacity and 61% of the initial stiffness of the virgin column. This reduction in the initial stiffness of the repair column is attributed to the residual strains in the steel tube before the repair process. However, such residual strains did not affect the moment capacity of the column F4-24-P124-R.
14
Seismic performance of innovative hollow composite bridge columns
(a)
(b)
(c)
(d)
(e)
(f)
(g) Figure 7. Lateral drift-moment relation of the columns: (a) F4-24-RC, (b) F4-24-E324, (c) F424-P124, (d) F4-24-E344, (e) F4-24-E325, (f) F4-24-P124-R, and (g) F4-24-E324-R
Abdelkarim & ElGawady
15
F4-24-RC: rebar fracture
F4-24-E324: rupture of FRP tube
F4-24-P124: rupture of FRP tube
F4-24-E344: footing cone failure
F4-24-E325: steel tube tearing
F4-24-P124-R: rupture of FRP wrapped layers
F4-24-E324-R: steel tube tearing Figure 8. Failure modes of the investigated columns
16
Seismic performance of innovative hollow composite bridge columns
Figure 9. Lateral drift-moment relation of the columns F4-24-RC and the F4-24-E325
Figure 10. Lateral drift-moment relation of the columns F4-24-P124-R and F4-24-P124
3.7 Columns F4-24-E324-R versus F4-24-E324 The F4-24-E324-R was the repaired column of the F4-24-E324 using GFRP wrapping. Figure 7g illustrates the hysteretic lateral drift-moment relation of the column F4-24-E324-R. Figure 11 illustrates the hysteretic lateral drift-moment relation of the column F4-24-E324-R versus that of the column F4-24-E324. The average moment capacity of the column F4-24-E324-R was 318 kN.m (235 kip.ft) at a lateral drift of 6.0% while the average moment capacity of the virgin column F4-24-E324 was 732 kN.m (540 kip.ft) at a lateral drift of 2.8%. The column F4-24-E324-R failed by the steel tube tearing due to the low cyclic fatigue (Fig. 8g). Figure 11 showed that the repaired column neither able to retrieve the strength nor the stiffness of the virgin column F4-24-E324 as the steel tube of the virgin column suffered severe inelastic local buckling along with reaching to a very high lateral drift of 15.2% before the GFRP tube ruptured. This behavior indicated that when an HC-FCS column suffers high
Abdelkarim & ElGawady
17
damage during an earthquake it cannot be repaired using the proposed simple technique and further measures need to be taken.
Figure 11. Lateral drift-moment relation of the columns F4-24-E324-R and F4-24-E324
3.8 FRP confinement and steel tube strength effects This section discusses the effects of the FRP confinement, the thickness, and diameter of the steel tube on design parameters of the virgin HC-FCS columns.
3.8.1 Moment capacity The moment capacity of a HC-FCS column was mainly controlled by the steel tube properties and dimensions. Columns F4-24-E324 and F4-24-P124 had similar steel tube; however, the FRP tube thickness of the column F4-24-E324 was 3 times that of the column F4-24-P124. Both columns displayed the same moment capacity. Figure 12 and Equations 3 to 5 illustrate the relation between the steel tube strength ( ) and the moment capacity of the investigated columns. The equations were developed based on simplification of the regression analyses results. The moment capacity increased linearly with increasing the steel tube strength. However, few columns investigated during this study and it is anticipated that there is a threshold of steel tube strength beyond which the relationship will be nonlinear due to the change in the mode of failure. Furthermore, the investigated columns were subjected to low level of axial load which is common in a bridge column. Therefore, the contribution of the axial load did not appear in the Equations. SI units (3) Mc = Mc =
Custom units
(4) (5)
18
Seismic performance of innovative hollow composite bridge columns
Where Mc is the moment capacity in kN.m (kip.ft.), is the steel tube strength, Di is the steel tube outer diameter in mm (inch), ts is the steel tube thickness in mm (inch), and Fu is the ultimate stress of the steel tube in GPa (ksi).
Figure 12. Steel tube strength versus the moment capacity of the HC-FCS columns
3.8.2 Maximum lateral drift and displacement ductility The relation between the FRP confinement ratio (CR) and the steel tube strength ( is very important for understanding the behavior of the HC-FCS columns. There is an interaction between the confinement ratio, steel tube strength, and lateral pressure due to concrete dilation under compressive stresses. When the CR increases with constant , the concrete lateral pressure increases on the inner steel tube and vise versa. The maximum lateral drift and displacement ductility of the HC-FCS column are controlled by the ratio between the CR and . Figure 13a and Equations 6 and 7 illustrate the relation between the CR/ ratio and the maximum lateral drift. Regression analysis showed that the best fit for the available data is a second-degree equation with R2 values of 0.909 and 0.936 in the case of drift and displacement ductility, respectively. The equations were developed based on simplification of the regression analyses results. More data is required to improve the proposed relationships. Based on the available date, the peak drift, 21%, occurred at CR/ ratio of 1.42 (6.3 ). When the CR/
ratio is higher than 1.42
(6.3
), the FRP tube stiffness is high enough compared to that of the inner steel tube and hence the concrete dilation demand is much higher on the inner steel tube. In this case, the steel tube is subjected to very high demand and displays severe local buckling similar to columns F4-24-E324 and F4-24-E325.
Abdelkarim & ElGawady
19
Furthermore, when the CR/
ratio is lower than 1.42
(6.3
), the FRP tube is subjected to more lateral pressure demand due to concrete dilation. In this case, the steel tube does not suffer much damage similar to columns F4-24-E344 and F4-24-P124 where their steel tubes did not suffer any local buckling. Figure 13b and Equations 8 and 9 illustrate the relation between the CR/ ratio and the displacement ductility. The peak displacement ductility of 21.5 was found at CR/ ratio of 1.39 (6.2 ). The relation between the CR/ ratio and the displacement ductility was very similar to the relation between the CR/ ratio and the maximum lateral drift.
(a)
(b)
Figure 13. Confinement ratio/steel tube strength versus: (a) the maximum lateral drift and (b) the displacement ductility
=
- SI units
(6)
=
- Custom units
(7)
Where
is the maximum lateral drift, STs is the steel tube strength in
custom units and (9.6
for SI units, 5.2
(2.3
)