mechanisms such as firewalls and software updates can provide a ... A Feature Relevance Analysis on KDD 99 Intrusion Detection Datasets ..... list; 0 otherwise.
Selecting Features for Intrusion Detection: A Feature Relevance Analysis on KDD 99 Intrusion Detection Datasets H. Güneş Kayacık, A. Nur Zincir-Heywood, Malcolm I. Heywood Dalhousie University, Faculty of Computer Science, 6050 University Avenue, Halifax, Nova Scotia. B3H 1W5 {kayacik, zincir, mheywood}@cs.dal.ca
Abstract KDD 99 intrusion detection datasets, which are based on DARPA 98 dataset, provides labeled data for researchers working in the field of intrusion detection and is the only labeled dataset publicly available. Numerous researchers employed the datasets in KDD 99 intrusion detection competition to study the utilization of machine learning for intrusion detection and reported detection rates up to 91% with false positive rates less than 1%. To substantiate the performance of machine learning based detectors that are trained on KDD 99 training data; we investigate the relevance of each feature in KDD 99 intrusion detection datasets. To this end, information gain is employed to determine the most discriminating features for each class.
Keywords Intrusion detection, KDD 99 intrusion detection datasets, feature relevance, information gain
1
Introduction
Along with the benefits, the Internet also created numerous ways to compromise the stability and security of the systems connected to it. Although static defense mechanisms such as firewalls and software updates can provide a reasonable level of security, more dynamic mechanisms such as intrusion detection systems (IDSs) should also be utilized. Intrusion detection systems are typically classified as host based or network based. A host based IDS will monitor resources such as system logs, file systems and disk resources; whereas a network based intrusion detection system monitors the data passing through the network. Different detection techniques can be employed to search for attack patterns in the data monitored. Misuse detection systems try to find attack signatures in the monitored resource. Anomaly detection systems typically rely on knowledge of normal behavior and flag any deviation from this. Intrusion detection systems currently in use typically require human input to create attack signatures or to determine effective models for normal behavior. Support for learning algorithms provides a potential alternative to expensive human input. The main task of such a learning algorithm is to discover appropriate models from the training data for characterizing normal and attack behavior. The ensuing model is then used to make predictions regarding unseen data. One of the biggest challenges in network-based
intrusion detection is the extensive amount of data collected from the network. Therefore, before feeding the data to a machine learning algorithm, raw network traffic should be summarized into higher-level events such as connection records. Each higher-level event is described with a set of features. Selecting good features is a crucial activity and requires extensive domain knowledge. Given the significance of the intrusion detection problem, there have been various initiatives that attempt to quantify the current state of the art. In particular, MIT Lincoln Lab’s DARPA intrusion detection evaluation datasets have been employed to design and test intrusion detection systems. In 1999, recorded network traffic from the DARPA 98 Lincoln Lab dataset [1] was summarized into network connections with 41-features per connection. This formed the KDD 99 intrusion detection benchmark in the International Knowledge Discovery and Data Mining Tools Competition [2]. Although not without its drawbacks [3, 12], KDD 99 benchmark provides the only publicly available labeled datasets for comparing IDS systems, which the authors are aware of. The detection results reported by the research that employed machine learning algorithms (such as decision trees [4, 5], neural network algorithms [6], clustering and support vector machine approaches [11]) on KDD 99 intrusion detection datasets indicate that denial of service attacks and probes are detected accurately whereas attacks involving content have substantially lower detection rates. Sabhnani et al. [10] investigated the deficiencies of KDD 99 intrusion detection datasets and concluded that it is not possible to achieve a high level of detection rate on attacks involving content (user to root and remote to local attacks). Given the detection rate of recent research, our objective is to perform a feature relevance analysis to substantiate the performance of machine learning IDSs. Therefore, we aim to investigate the relevance of the 41 features with respect to dataset labels. That is, for normal behavior and each type of attack (i.e. class labels), we determine the most relevant feature, which best discriminates the given class from the others. To do so, information gain, which is the underlying feature selection measure for constructing decision trees, is employed. For a given class, the feature with the highest information gain is considered the most discriminative feature. Although information gain is indirectly employed on KDD 99 intrusion detection dataset by the use of decision trees, our objective is to perform a relevance analysis rather than training a detector.
The remainder of the paper is organized as follows. Section 2 provides the methodology of the work. Results are reported in Section 3 and Conclusions are drawn in Section 4.
2
Methodology
As indicated in the introduction, the basic objective of this work is to determine the contribution of the 41 features in KDD 99 intrusion detection datasets to attack detection (or discrimination of normal behavior from attacks). To this end, an approach based on information gain is employed. Based on the entropy of a feature, information gain measures the relevance of a given feature, in other words its role in determining the class label. If the feature is relevant, in other words highly useful for an accurate determination, calculated entropies will be close to 0 and the information gain will be close to 1. Since information gain is calculated for discrete features, continuous features are discretized with the emphasis of providing sufficient discrete values for detection.
2.1
KDD dataset
The KDD 99 intrusion detection datasets are based on the 1998 DARPA initiative, which provides designers of intrusion detection systems (IDS) with a benchmark on which to evaluate different methodologies [1]. To do so, a simulation is made of a factitious military network consisting of three ‘target’ machines running various operating systems and services. Additional three machines are then used to spoof different IP addresses to generate traffic. Finally, there is a sniffer that records all network traffic using the TCP dump format. The total simulated period is seven weeks. Normal connections are created to profile that expected in a military network and attacks fall into one of four categories: User to Root; Remote to Local; Denial of Service; and Probe. • Denial of Service (dos): Attacker tries to prevent legitimate users from using a service. • Remote to Local (r2l): Attacker does not have an account on the victim machine, hence tries to gain access. • User to Root (u2r): Attacker has local access to the victim machine and tries to gain super user privileges. • Probe: Attacker tries to gain information about the target host. In 1999, the original TCP dump files were preprocessed for utilization in the Intrusion Detection System benchmark of the International Knowledge Discovery and Data Mining Tools Competition [2]. To do so, packet information in the TCP dump file is summarized into connections. Specifically, “a connection is a sequence of TCP packets starting and ending at some well defined times, between which data flows from a
source IP address to a target IP address under some well defined protocol” [2]. This process is completed using the Bro IDS [7], resulting in 41 features for each connection, which are detailed in Appendix 1. Features are grouped into four categories: Basic Features: Basic features can be derived from packet headers without inspecting the payload. Basic features are the first six features listed in Appendix 1. Content Features: Domain knowledge is used to assess the payload of the original TCP packets. This includes features such as the number of failed login attempts; Time-based Traffic Features: These features are designed to capture properties that mature over a 2 second temporal window. One example of such a feature would be the number of connections to the same host over the 2 second interval; Host-based Traffic Features: Utilize a historical window estimated over the number of connections – in this case 100 – instead of time. Host based features are therefore designed to assess attacks, which span intervals longer than 2 seconds. The KDD 99 intrusion detection benchmark consists of three components, which are detailed in Table 1. In the International Knowledge Discovery and Data Mining Tools Competition, only “10% KDD” dataset is employed for the purpose of training [8]. This dataset contains 22 attack types and is a more concise version of the “Whole KDD” dataset. It contains more examples of attacks than normal connections and the attack types are not represented equally. Because of their nature, denial of service attacks account for the majority of the dataset. On the other hand the “Corrected KDD” dataset provides a dataset with different statistical distributions than either “10% KDD” or “Whole KDD” and contains 14 additional attacks. The list of class labels and their corresponding categories for “10% KDD” are detailed in Table 2. Since “10% KDD” is employed as the training set in the original competition, we performed our analysis on the “10% KDD” dataset. Table 1. Basic characteristics of the KDD 99 intrusion detection datasets in terms of number of samples Dataset DoS Probe u2r r2l Normal “10% 391458 4107 52 1126 97277 KDD” “Corrected 229853 4166 70 16347 60593 KDD” “Whole 3883370 41102 52 1126 972780 KDD”
Table 2. Class labels that appears in “10% KDD” dataset Attack # Samples Category smurf. 280790 dos neptune. 107201 dos back. 2203 dos teardrop. 979 dos pod. 264 dos land. 21 dos normal. 97277 normal satan. 1589 probe ipsweep. 1247 probe portsweep. 1040 probe nmap. 231 probe warezclient. 1020 r2l guess_passwd. 53 r2l warezmaster. 20 r2l imap. 12 r2l ftp_write. 8 r2l multihop. 7 r2l phf. 4 r2l spy 2 r2l buffer_overflow. 30 u2r rootkit. 10 u2r loadmodule. 9 u2r perl. 3 u2r
2.2
Information Gain
Let S be a set of training set samples with their corresponding labels. Suppose there are m classes and the training set contains si samples of class I and s is the total number of samples in the training set. Expected information needed to classify a given sample is calculated by: m s s I(s1,s2 ,...,sm ) = "# i log 2 ( i ) s i=1 s
!
(1)
A feature F with values { f1, f2, …, fv } can divide the training set into v subsets { S1, S2, …, Sv } where Sj is the subset which has the value fj for feature F. Furthermore let Sj contain sij samples of class i. Entropy of the feature F is v
s1 j + ...+ smj # I(s1 j ,...,smj ) s j=1
E(F) = "
(2)
Information gain for F can be calculated as:
Gain(F) = I(s1,...,sm ) " E(F)
! !
(3)
In our experiments, information gain is calculated for class labels by employing a binary discrimination for each class. That is, for each class, a dataset instance is considered in-class, if it has the same label; out-class, if it has a different label. Consequently, as opposed to calculating one information gain as a general measure on the relevance of the feature for all classes, we calculate an information gain for each class. Thus, this signifies how well the feature can discriminate the given class (i.e. normal or an attack type) from other classes.
2.3
Preprocessing
Since information gain is calculated for discrete features, continuous features should be discretized. To this end, continuous features are partitioned into equalsized partitions by utilizing equal frequency intervals [13]. In equal frequency intervals method, the feature space is partitioned into arbitrary number of partitions where each partition contains the same number of data points. That is to say, the range of each partition is adjusted to contain N dataset instances. If a value occurs more than N times in a feature space, it is assigned a partition of its own. In “10% KDD” dataset, certain classes such as denial of service attacks and normal connections occur in the magnitude of hundreds of thousands whereas other classes such as R2L and U2R attacks occur in the magnitude of tens or hundreds. Therefore, to provide sufficient resolution for the minor classes N is set to 10, (i.e. maximum 50,000 partitions).
3
Results
Results are presented in terms of the classes that achieved good levels of discrimination from others in the training set and the analysis of feature relevancy in the training set. Table 3 details the most relevant features for each class and provides the corresponding information gain measures. Three classes (namely normal, neptune and smurf) stand out from others with high information gain, hence high degree of discrimination. As indicated before, recent literature based on machine learning algorithms [4, 5, 6, 11] achieved approximately 90% detection rate with low false alarm rates (~2%). Given that normal, neptune and smurf classes correspond to 98% of the training data, the majority of the training set can be easily classified therefore high detection and low false positive rates of IDSs trained on “10% KDD” dataset are questionable because the dataset is unrealistically simple. Moreover, for 14 of the 23 classes, amount of data exchange (i.e. source and destination bytes) is the most discriminating feature. This is expected for denial of service and probe category attacks where the nature of the attack involves very short or very long connections. However for content based attacks (such as ftp_write back and phf) basing the
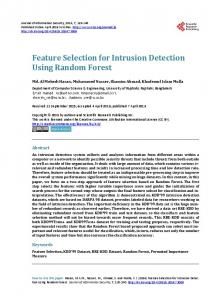
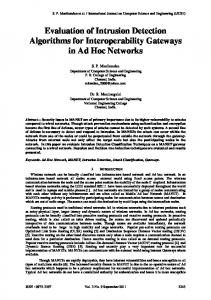
decision on a feature that is unrelated with content will lead to unjustified detection of an attack. Furthermore, as expected, feature 7, which is related to land attack, is selected as the most discriminating feature for land class. Table 3. Most relevant features for each class label and information gain measures Class Label Info. Feature Feature Name Gain # smurf 0.9859 5 source bytes neptune 0.7429 30 diff srv rate normal 0.6439 5 source bytes back 0.0411 6 destination bytes satan 0.0257 27 rerror rate ipsweep 0.0222 37 dst host srv diff host rate teardrop 0.0206 5 source bytes warezclient 0.0176 5 source bytes portsweep 0.0163 4 status Flag pod 0.0065 5 source bytes nmap 0.0024 4 flag guess_passwd 0.0015 5 source bytes buffer_overflow 0.0007 6 destination bytes land 0.0007 7 land warezmaster 0.0006 6 destination bytes imap 0.0003 3 service loadmodule 0.0002 6 destination bytes rootkit 0.0002 5 source bytes perl 0.0001 16 # root ftp_write 0.0001 5 source bytes phf 0.0001 6 destination bytes multihop 0.0001 6 destination bytes spy 0.0001 39 dst host srv serror rate Figure 1 shows the maximum information gain for each feature. In addition, Table 4 details the most discriminative class label for each feature. For majority of the features (31 over 41), normal, smurf and neptune are the most discriminative classes. That is to say, there are many features that can discriminate these classes accurately. There are 9 features with very small maximum information gain (e.g. smaller than 0.001), which contribute very little to intrusion detection. Moreover features 20 and 21 (outbound command count for FTP sessions and hot login, respectively) do not show any variations in the training set therefore they have no relevance to intrusion detection.
Figure 1. Information gain of each feature Table 4. List of features for which the class is selected most relevant Class Label Relevant Features normal 1, 6, 12, 15, 16, 17, 18, 19, 31, 32, 37 smurf 2, 3, 5, 23, 24, 27, 28, 36, 40, 41 neptune 4, 25, 26, 29, 30, 33, 34, 35, 38, 39 land 7 teardrop 8 ftp_write 9 back 10, 13 guess_pwd 11 buffer_overflow 14 warezclient 22
4
Conclusion
In this paper, a feature relevance analysis is performed on KDD 99 training set, which is widely used by machine learning researchers. Feature relevance is expressed in terms of information gain, which gets higher as the feature gets more discriminative. In order to get feature relevance measure for all classes in training set, information gain is calculated on binary classification, for each feature resulting in a separate information gain per class. Recent research employed decision trees, artificial neural networks and a probabilistic classifier and reported, in terms of detection and false alarm rates, that user to root and remote to local attacks are very difficult to classify. The contribution of this work is that it analyzes the involvement of each feature to classification. Our results indicate that normal, neptune and smurf classes are highly related to certain features that make their classification easier. Since these three classes make up 98% of the training data, it is very easy for a machine learning algorithm to achieve good results. Moreover, the amount of data exchange in a connection seems to be a discriminating feature for majority of the classes. On the
other hand, certain features have no contribution to intrusion detection, which indicates that not all features are useful. Although test data shows different characteristics than the training data, since “10% KDD” is the training data in the competition, our analysis on training data shed light on the performance of machine learning based intrusion detection systems trained on KDD 99 intrusion detection datasets in general. Future work will include additional measures for feature relevance and extend the analysis to other KDD 99 intrusion detection datasets.
Acknowledgments This work was supported in part by NSERC and CFI. All research was conducted at the NIMS Laboratory, http://www.cs.dal.ca/projectx/.
References [1]
[2] [3]
[4] [5] [6]
[7] [8] [9] [10] [11]
[12]
[13]
The 1998 intrusion detection off-line evaluation plan. MIT Lincoln Lab., Information Systems Technology Group. http://www.11.mit.edu/IST/ideval/docs/1998/id98-eval-11.txt, 25 March 1998. Knowledge discovery in databases DARPA archive. Task Description. http://www.kdd.ics.uci.edu/databases/kddcup99/task.html J. McHugh, “Testing intrusion detection systems: A critique of the 1998 and 1999 DARPA intrusion detection system evaluations as performed by Lincoln Laboratory,” ACM Transactions on Information and System Security, 3(4), pp. 262-294, 2001. Pfahringer B. Winning the KDD99 Classification Cup: Bagged Boosting. SIGKDD Explorations, 1(2):65–66, 2000. Levin I. KDD-99 Classifier Learning Contest: LLSoft’s Results Overview. SIGKDD Explorations, 1(2):67–75, 2000. Kayacik G., Zincir-Heywood N., and Heywood M. On the Capability of an SOM based Intrusion Detection System. In Proceedings of International Joint Conference on Neural Networks, 2003. Paxson V., “Bro: A System for Detecting Network Intruders in Real-Time”, Computer Networks, 31(23-24), pp. 2435-2463, 14 Dec. 1999. S. Hettich, S.D. Bay, The UCI KDD Archive. Irvine, CA: University of California, Department of Information and Computer Science, http://kdd.ics.uci.edu, 1999. Han J., Kamber M., “Data Mining: Concepts and Techniques”, Morgan Kaufmann, 2000, ISBN 7-04-010041, Ch. 5. Sabhnani M., Serpen G., “Why Machine Learning Algorithms Fail in Misuse Detection on KDD Intrusion Detection Data Set”, In Journal of Intelligent Data Analysis, 2004 E. Eskin, A. Arnold, M. Prerau, L. Portnoy, S. Stolfo, “A geometric framework for unsupervised anomaly detection: Detecting intrusions in unlabeled data,” in Applications of Data Mining in Computer Security, Chapter 4, D. Barbara and S. Jajodia (editors), Kluwer, ISBN 1-4020-7054-3, 2002. Kayacik, G. H., Zincir-Heywood, A. N., "Analysis of Three Intrusion Detection System Benchmark Datasets Using Machine Learning Algorithms", Proceedings of the IEEE ISI 2005 Atlanta, USA, May 2005. Wong, A. K. C., and Chiu, D. K. Y., “Synthesizing statistical knowledge from incomplete mixed-mode data”, IEEE Transactions on Pattern Analysis and Machine Intelligence, vPAMI-9, no. 6, pp.796-805, November 1987.
Appendix 1. Description of KDD 99 Intrusion Detection Dataset Features Table A.1. List of features with their descriptions and data types (summarized from [2]) Feature
Description
Type
Feature
1. duration
Duration of the connection.
Cont.
22. is guest login
Description
Type
2. protocol type Connection protocol (e.g. tcp, udp)
Disc.
3. service
Destination service (e.g. telnet, ftp)
Disc.
4. flag
Status flag of the connection
Disc.
5. source bytes
Bytes sent from source to destination Bytes sent from destination to source 1 if connection is from/to the same host/port; 0 otherwise number of wrong fragments
Cont.
Cont.
1 if the login is a "guest'' login; 0 otherwise 23. Count number of connections to the same host as the current connection in the past two seconds 24. srv count number of connections to the same service as the current connection in the past two seconds 25. serror rate % of connections that have “SYN'' errors 26. srv serror rate % of connections that have “SYN'' errors 27. rerror rate % of connections that have “REJ'' errors 28. srv rerror rate % of connections that have “REJ'' errors 29. same srv rate % of connections to the same service
number of urgent packets
Cont.
30. diff srv rate
% of connections to different services
Cont.
number of "hot" indicators
Cont.
31. srv diff host rate 32. dst host count
% of connections to different hosts
Cont.
6. destination bytes 7. land 8. wrong fragment 9. urgent 10. hot
Cont. Disc.
11. failed logins number of failed logins
Cont.
12. logged in
1 if successfully logged in; 0 otherwise
Disc.
13. # compromised
number conditions
"compromised''
Cont.
1 if root shell is obtained; 0 otherwise 15. su attempted 1 if "su root'' command attempted; 0 otherwise
Cont.
16. # root
number of "root'' accesses
17. # file creations 18. # shells
Disc. Cont.
Cont.
Cont. Cont. Cont. Cont. Cont.
count of connections having the same destination host 33. dst host srv count of connections having the same count destination host and using the same service 34. dst host same % of connections having the same srv rate destination host and using the same service 35. dst host diff srv % of different services on the current rate host 36. dst host same % of connections to the current host src port rate having the same src port
Cont.
Cont.
37. dst host srv diff % of connections to the same service host rate coming from different hosts
Cont.
number of file creation operations
Cont.
38. dst host serror % of connections to the current host rate that have an S0 error
Cont.
number of shell prompts
Cont.
39. dst host srv serror rate
% of connections to the current host and specified service that have an S0 error 40. dst host rerror % of connections to the current host rate that have an RST error
Cont.
41. dst host srv rerror rate
Cont.
of
14. root shell
Cont.
19. # access files number of operations on access control files
Cont.
20. # outbound cmds
number of outbound commands in an ftp session
Cont.
21. is hot login
1 if the login belongs to the "hot'' list; 0 otherwise
Disc.
% of connections to the current host and specified service that have an RST error
Cont.
Cont.
Cont. Cont.
Cont.