Selection of the Operating Parameters in Sugar Crystallization Control Lajos Rózsa, Jakab Rózsa ZUTORA Ltd., Hungary Seppo Kilpinen, Eero Mielonen K-PATENTS Oy, Finland Contact:
[email protected]
ABSTRACT Selection of the operating parameters (setpoints for the variables governing the process of crystallization) is a complex task. In the past it was the pan men’s responsibility to determine the value of and control (usually by manually operated valves) vacuum, feed syrup and steam flows based on a very minimum of instruments and experience gained over the years. One part of the technical literature of the industry has been quite cautious in providing well defined instructions and data regarding the operating conditions to be used during the industrial scale crystallization of sugar; in most cases the views of the “artist” pan-men are reflected in the publications. The other part of the literature (termed: academic) relies on high level models of the process of crystallization. These are based on material, energy and crystal population balance equations with inevitable simplifications and sometimes questionable results. Their use in actual practice on the pan floor is rather limited. It is well known that the most important driving force of crystallization is supersaturation. Despite some false claims, there is no single instrument able to measure it directly, because it is a multivariable function of several parameters. With the introduction of the SeedMaster Instruments online calculation of supersaturation plus other important massecuite parameters became reality. Based on the effective use of these instruments a complex equation describing the rate of linear crystal growth was formulated and validated in several sugar mills in pans operating according to normal local practice (L. Rozsa et al.: Crystal growth and crystallization control tactics in industrial sugar crystallizers. Part 1. Crystal growth. ISJ, Oct. 2016). The equation reflects the effects of supersaturation, temperature, non-sugar concentration and crystal content on the rate of crystal growth. The equation provides an excellent tool for the simulation of complete strikes with different operating parameter selections. In this paper simulated data are used to compare the effect of different operating parameter selections. It is shown that proper setpoint selection (and control) of the important variables, like supersaturation, temperature and level of the massecuite during a strike can result in considerable savings in the use of energy (due to absolutely no use of water, for example), reduction of the time of crystallization and the amount of recycled sugar, mean crystal size (MA) close to target and improved product yield and crystal size distribution (CV). Proper selection of the setpoints for the important parameters naturally must be followed by a well selected control strategy to be effective. In this paper a control configuration consisting of 5 PID controllers is introduced. They are used to implement supersaturation-based control of steam flow and vacuum combined with massecuite level control based on its solids content. Some results obtained by their use in mills in different parts of the world are also presented. Keywords: operating parameters, supersaturation, SeedMaster Instruments, crystal growth rate, advanced control of crystallization.
INTRODUCTION “To make sugar is one of the most difficult things in the world. And to make it right is next to impossible.” [1] Mark Twain was certainly not an authority in sugar manufacturing and quite a lot of water has left the Mississippi since his time. However, research on how “to make it right”, or with the fashionable word of our times: how to “optimize” sugar manufacturing is still on the list of researchers and plant managers as well. Sugar crystallization is a very important part of sugar manufacturing. Papers and handbooks on the subject still refer quite often to the expertise of the pan-men to rely on even today, when it is common to find advanced devices of process automation (instruments, PLC-s, DCS-s) in operation in mills and refineries all over the world. It is still not uncommon to find the same old ideas practiced several decades ago now frozen in the software of these devices. The authors of this presentation have been active since a long time not only in the development of new and unique instruments (process refractometers and SeedMaster Instruments) to be used in sugar crystallization, but in “on the spot” commissioning of these devices in different countries. Introduction of the SeedMaster Instruments [2], [3], [4] made the use of reliable online data (not available before) on supersaturation (SS for short), the most important parameter of crystallization possible. With the availability of online data on SS the need to provide not only an advice, but a complete and tested control solution on the direct use of these data for the advanced control of crystallization in batch pans was a natural requirement. The proposed control solution proved its worth in thousands of strikes in quite a few countries.
1
The wealth of acquired online data from pans in normal operation and experience gained during the last few years coupled with the (sometimes contradicting and not validated results) of other published research on the subject provided the basis of a thorough study of crystal growth. The aim was to provide a complex equation capable to describe the effect of the parameters governing the rate of crystal growth.
1. PARAMETERS GOVERNING THE PROCESS OF CRYSTAL GROWTH IN INDUSTRIAL SUGAR CRYSTALLIZERS Crystal growth has been studied in the laboratories and in vacuum pans in operation since a long time. Due to the complexity of the problem and to the different approaches (from the very basic pan-floor practical to the academic) the findings are many and often contradictory. In [5] a crystal growth rate (linear) model was formulated and validated by using process data from vacuum pans located in two different countries operating according to local practice. This was made possible due to the development and use of a SeedMaster Instrument able to provide reliable online data on supersaturation (SS) and on some other important massecuite parameters as well. The general form of the equation: 𝑑𝑎 𝑑𝑡
= 𝑓0(𝐾) ∗ 𝑓1(𝑆𝑆) ∗ 𝑓2(𝑇) ∗ 𝑓3(𝑁𝑆) ∗ 𝑓4(𝑦)
Eq. 1
or with its validated individual components: 𝒅𝒂 𝒅𝒕
𝑵𝑺
= 𝑲 ∗ (𝑺𝑺 − 𝟏. 𝟎𝟑𝟓) ∗ 𝟎. 𝟐𝟕𝟕 ∗ 𝒆(𝟎.𝟎𝟏𝟖𝟔∗𝑻) ∗ 𝒆(−𝟏.𝟕𝟓∗𝟏𝟎𝟎) ∗ (𝟏 − 𝒚)𝟐 a: da/dt: K: SS: T: NS: y:
Eq. 2
crystal size (µm) crystal growth (linear) rate (µm/min) overall crystallization growth rate supersaturation (--) temperature (⁰C) non-sugar concentration (g/100 g water) crystal content (by volume, abs.)
The components of Eq. 1 will be briefly discussed one by one as follows.
1.1 K: Overall crystallization growth rate (f0(K)) Crystal growth depends on quite many parameters, like liquid velocity (v) and width (δ) of the stagnant layer on the crystal surface, crystal size (a), liquid density (ρ) and viscosity (η), coefficient of diffusion (D), temperature (T) and purity (P). Non-sugar composition (Nc) has also a strong effect on crystal growth and shape as well. Some of these parameters (v, δ, ρ, η, D) are functions of temperature T, which makes the numerical evaluation of K difficult. 𝑓0(𝐾) = 𝐾 = f(v, δ, a, ρ, η, D, T, P, Nc)
Eq. 3
1.2 Supersaturation (f1(SS)) It is generally accepted since a long time that supersaturation (SS) is the most important parameter of crystallization. Its definition: 𝑆𝑆 =
𝑠𝑢𝑔𝑎𝑟 𝑖𝑛 𝑠𝑜𝑙𝑢𝑡𝑖𝑜𝑛 𝑠𝑢𝑔𝑎𝑟 𝑛𝑒𝑒𝑑𝑒𝑑 𝑓𝑜𝑟 𝑠𝑎𝑡𝑢𝑟𝑎𝑡𝑖𝑜𝑛
(𝑏𝑜𝑡ℎ 𝑎𝑡 𝑡ℎ𝑒 𝑠𝑎𝑚𝑒 𝑡𝑒𝑚𝑝𝑒𝑟𝑎𝑡𝑢𝑟𝑒)
Eq. 4
SS is a function of several variables [6], namely: • syrup / mother liquor concentration (C) • syrup / mother liquor purity (P) • temperature (T) • liquid (feed syrup) quality parameters (m, b, c), which are different for feed syrups of beet or cane origin and should be determined locally SS is a multiparameter function of several variables of the feed syrup or mother liquor (Eq. 5) and there is no single measurement device able to provide reliable data on it; it can only be calculated by taking into account all of its governing parameters [6]: 𝑆𝑆 = 𝑓(𝐶, 𝑃, 𝑇, 𝑚, 𝑏, 𝑐)
Eq. 5
The effect of SS on crystal growth is expressed by: 𝑓1(𝑆𝑆) = ( 𝑆𝑆 − 1.035) Eq. 6
2
1.3 Temperature (f2(T)) The direct effect of temperature on the crystal growth rate is represented by Eq. 7: 𝑓2(𝑇) = 0.277 ∗ 𝑒 (0.0186∗𝑇)
Eq. 7
Temperature has considerable indirect effect on quite a few process parameters, like liquid velocity (v) and width (δ) of the stagnant layer on the crystal surface, liquid density (ρ), viscosity (η), coefficient of diffusion (D), non-sugar concentration (at higher temperature higher liquid concentration is needed to have the same SS) etc.
1.4 Non-sugar concentration (f3(NS)) 𝑁𝑆
𝑓3(𝑁𝑆) = 𝑒 (−1.75∗100)
Eq. 8
Non-sugar concentration is changing during a strike and its effect is increasing considerably with low purity feed syrups.
1.5 Crystal content by volume (abs.) (f4(y)) 𝑓4(𝑦) = (1 − 𝑦)2
Eq. 9
Crystal content, though often neglected, has a very considerable effect on crystal growth. The value of f4(y) can change in the f4(y) = 1.00 to 0.20 (y = 0.0 to 0.55) range. Notes: Equations 6 to 9 provide information on the direct effect of the operating parameters one by one. Some of these (temperature, crystal content) and additional parameters, like feed syrup / mother liquor concentration have an indirect effect too, on some important massecuite parameters, like viscosity and consistency (see Eq. 3). These have a major effect on massecuite circulation and heat transfer from the calandria. Exact formulation of these indirect effects is very difficult since they depend on vacuum pan construction (presence, or absence of a stirrer, feed input etc.) and product data (like crystal size and size dispersion) as well. Some of the operating parameters have opposing direct and indirect effects on the process of crystallization: increased operating temperature for example can result in better circulation and heat transfer due to reduced viscosity / consistency and in increased growth rate (if SS is kept constant), but can degrade crystal color, if excessive, and results in a sharp drop of SS (if it is not controlled properly) reducing the crystal growth rate.
2. CONSTRAINTS When selecting the operating parameters, we are faced with some constraints which must be considered. These constraints are closely correlated • to the operating parameters, and • to local equipment and practice (vacuum pan, machinery and instruments used, seeding practice etc.).
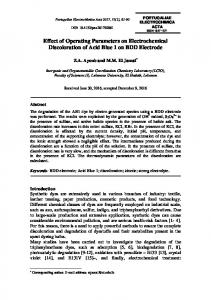
2.1 Operating parameters 2.1.1 Supersaturation There are quite different data on the nucleation limit (SS) in the relevant literature ranging from SS = 1.20 to 1.60. The most common and accepted data are trended in Fig. 1. [7]. The nucleation limits depend on syrup / mother liquor purity and temperature as well. These limits should not be exceeded (unless shock seeding is practiced) all over the strike to avoid unwanted nucleation.
3
Fig. 1. Critical supersaturation limits to start nucleation [7]
2.1.2 Temperature Sugar crystallization in vacuum pans is typically carried out in the 62-82 ⁰C temperature range.
2.1.3 Crystal content Crystal content is strongly correlated to the total solids content of the massecuite. It should be as high as possible when the charge is dropped.
2.2 Constraints posed by local equipment and practice in use 2.2.1 Stirrer motor power rating There are two parameters which are usually used to signal and start the completion of a strike: • total solids content or density of the massecuite measured by appropriate instruments (microwave or density probes) • stirrer motor power or current (power is advised) consumption Measurement and use of motor consumption data is preferred due to calibration, repeatability and accuracy problems of the microwave and nuclear density probes. Stirrer motors are an important part of the machinery, so they must be protected against overload. However, it happens quite often that the maximum permissible power rating of the motor does not allow continuing the strikes to have higher crystal content at the end of the strikes, though it could be done without any major problem of discharge or centrifuging. The power rating of the stirrer motor can be a strong limiting constraint on the amount of crystals produced per strike all over the lifetime of the motor (and even longer if the new one used to replace the old will have the same power rating). On the other hand: oversized motors are run well below their specified maximum power rating with higher power consumption (reduced efficiency) all over their lifetime.
2.2.2 Instruments It follows from Eq. 1 that reliable online data on the parameters having a direct effect on the crystal growth rate (SS, temperature, syrup / mother liquor concentration and non-sugar content, plus crystal content) should be made available for the advanced control of crystallization. The most critical of these is data on SS, which is a must when implementing advanced supersaturation-based control of crystallization. Reliable information on SS is needed not only to implement repeatable seeding, but all over the strike. Lack of reliable online data on SS is a strong constraint when designing crystallization control.
2.2.3 Control valves Automatic control of sugar crystallization is based on the use of (among others) control valves to control syrup and steam flows to the vacuum pans, plus whenever possible, to make individual control of vacuum in the pans possible. A few years ago, in a large plant in the Far East, manual control of crystallization was still in use with huge pans of 120 m3 nominal capacity, partly due to the high cost of the missing large control valves.
2.2.4 Seeding practice Current seeding practice has two versions: • full seeding with slurry or footing magma • shock seeding with slurry When practicing full seeding, supersaturated (SS ~ 1.08) syrup in the pan is seeded by feeding the correct amount of crystals present in the slurry or in the footing magma into the pan. Full seeding is the advised way of seeding. Shock seeding needs higher supersaturation (above the nucleation limit) in the metastable zone to initiate nucleation by the addition of seed crystals in the slurry (see Fig. 1.). Lack of reliable online data on SS is a strong constraint in both cases of seeding.
3. INSTRUMENT SELECTION The set of data needed for the advanced control of crystallization are: 1. Supersaturation 2. Syrup / mother liquor concentration (%) 3. Temperature (⁰C, ⁰F) 4. Massecuite solids content (%) 5. Syrup / massecuite level (%) 6. Vacuum / absolute pressure (Bar)
4
3.1 Supersaturation Feeling the need for data on SS during the process of crystallization, it was the late J.G. Ziegler, pioneer of process automation and its use in sugar crystallization, who had developed a device capable to provide approximate data on SS during a complete strike. Its operation was based on measuring the boiling point elevation (BPE) of the syrup or mother liquor (correlated to its concentration) within the pans under changing temperature conditions [8]. However, BPE of impure sugar solutions is a complex function of liquid concentration, temperature and purity [9]. As it is well known, purity (which is not measured in real time) undertakes a considerable change during crystallization. With the introduction of the SeedMaster Instruments (developed by Proficon Ltd., ZUTORA Ltd. and K-PATENTS), reliable online data on SS to serve the needs of advanced control of crystallization became reality [2], [3]. In Fig. 2 the third generation of the family (SM-3) is shown.
Fig. 2. SM-3 device on the right and the optional I/O unit on the left Operation of the SM-3 instrument is based on the following information: • Inputs: o Online (real time) data: ▪ liquid concentration and temperature measured by a K-PATENTS process refractometer ▪ total solids content or density measured by well calibrated third-party microwave (or nuclear) instrument ▪ massecuite level measured by a third-party instrument o Laboratory data: ▪ feed syrup or liquor purity ▪ beet / cane syrup quality parameters m, b, c (typical data are available for use in the device) Based on these data, SS (see. Eq. 5.) and other important parameters are online calculated and trended by the SM-3. • Calculated data: o supersaturation o crystal content by volume o mother liquor purity • Other measured, calculated and trended data: o massecuite solids content o mother liquor concentration o temperature o level o massecuite density o mean crystal size, if there was no nucleation during the strike Important features: 1. A single SM-3 device can serve two vacuum pans simultaneously. 2. Input /output data communication can be implemented via fieldbus communication with a PLC or DCS (use of the hardware I/O unit is optional). 3. Automatic seeding (opening the seed valve for a selected time interval) by the SM-3 is possible (this is the only control action provided by the device). 4. All of the trended data are stored for up to 100 strikes per pan as part of the so-called Strike History Archive.
3.2 Syrup / mother liquor concentration and temperature Reliable and accurate online data on liquid concentration are needed for the calculation of SS (required accuracy is at least +/- 0.1 %). The K-PATENTS process refractometer can meet this requirement and provides temperature data as well (Fig. 3.). No local calibration is required.
5
Fig. 3. Process refractometer manufactured by K-PATENTS Oy.
3.3 Massecuite solids content (%) Data on massecuite solids content is provided nowadays by microwave instruments. Their typical accuracy is about +/- 0.2 to 0.5 %. They need local calibration, which is not an easy task. Nuclear density probes, used earlier have lost ground due to several reasons.
3.4 Massecuite level (%) and vacuum / absolute pressure (bar) Massecuite level measurement by differential pressure transmitters is common practice as well as measurement of vacuum or absolute pressure by pressure transmitters.
4. OPERATING PARAMETERS: A BRIEF OVERVIEW 4.1 Supersaturation Supersaturation has multiple effects on several important parameters of the massecuite.
4.1.1 Formation of fines and conglomerates due to high SS Fines and conglomerates provide the basis for recycling already crystallized sugar. Fines can escape through the centrifuge screens, while conglomerates need extensive washing in the centrifuge to improve product color. This operation will dissolve some part of the crystal volume. The recycled dissolved sugar solution will be concentrated and crystallized again, effectively reducing real product yield.
4.1.2 Operational areas of SS during crystallization The operating range of supersaturation is really small: from SS=1.035 to SS=1.135 (using the nucleation limit SS.lim=1.135 for fairly high purity feed syrups, see Fig. 1.), that is the full range is: ΔSS=0.1 (Fig. 4.). There is absolutely no crystal growth when SS 95 %
Rec. Ratio (%) Yield
SS = 1,22 8,4 μm / min 62 min Yield: 42 %
900 800
700 600
SS = 1,12 4 μm / min 130 min
500
400
40
30
20
300
RECYCLE RATIO, da / dt, PRODUCT YIELD
1600
10
200
100 0
0
1,00
1,02
1,04
1,06
1,08
1,10 1,12 1,14 SUPERSATURATION
1,16
1,18
1,20
1,22
Fig. 8. Supersaturation and its approximate effect on some important parameters Fig. 8. shows the approximate effect of SS on different strike parameters (time to reach target crystal size, recycle ratio, crystal growth rate and product yield) with feed syrup purities in the P > 95 to 100 % range.
4.2. Operating temperature Temperature has a profound effect on the process of crystallization. The operating temperature in vacuum pans during evaporative sugar crystallization typically varies in the 62 to 82 ⁰C range. The direct effect of temperature is expressed by Eq. 7. According to this equation increasing temperature promotes the rate of crystallization. Some proponents however, argue: it is better to operate crystallization in the low range of temperature, because • lower pressure steam can be used for evaporation, • steam consumption is somewhat reduced, • the danger of color formation is also reduced, and • mother liquor and non-sugar concentration is smaller. Use of lower pressure steam: this is not necessarily true since at lower operating temperatures heat transfer from the calandria to the massecuite is decreasing fast. Color formation: One of the arguments favoring crystallization at low temperatures is lower color formation, which depends on temperature and residence time (time spent at elevated temperature). “White Sugar Boiling: Adequate feed-liquor purity is primary: avoidance of agglomeration, and use of minimum boiling times and temperatures is necessary to avoid (…) invert-color formation” [11]. However, it is clear from Eq. 7. that “minimum temperatures” result in increased boiling times, so these are conflicting requirements (see: Table 1.). The combined effect of temperature and residence time on sugar color was studied [12] and it was found that the increase of color formation begins somewhere above T=73-75 ⁰C. Smejkal et al. [13] discuss the results of experiments conducted in the laboratory with a small crystallizer operated under isothermal conditions. It was found that the “decrease of temperature from 70 ⁰C to 60 ⁰C with SS=1.09 resulted in approximately 30 % decrease of the rate of crystal growth”, which agrees with the findings of other researchers.
8
To help the decision on the selection of the operating temperature during crystallization, calculations were carried out to investigate the role of temperature on some important parameters [14], [15]. The main massecuite data selected for the calculations (same for all operating temperature versions): Supersaturation: 1.125 Mother liquor purity: 99 % Syrup m, b, c parameters: valid for cane syrup in a refinery in Louisiana, USA Crystal content (y, final): 0.55 vol. abs. (55 % by vol.) Crystal size (a, final): 0.65 mm Equations used in the calculations: Viscosity [16]: 𝑉𝐼𝑆𝐶 = (
0.1∗(0.99∗(14+0.2∗𝐶−0.05∗𝑇)) 97−6∗(0.2∗𝐶−0.05∗𝑇)
VISC: C: T:
4
) (𝑃𝑎. 𝑠)
Eq. 11
viscosity of the liquid phase (Pa.s) liquid concentration (%) temperature (⁰C)
Consistency (massecuite) / viscosity (liquid) ratio: R [17] 1 𝑅= Eq. 12 −0.0525 −0.0965 (−) 1−𝑦∗(3.04∗𝑎
−3.01∗𝑦∗𝑎
)
TEMP. ⁰C CONSIST.rel (%) f2(T).rel (%) TIME rel. (%) 72 100 100 100 70 102.0 96.3 103.8 68 104.1 92.8 107.8 66 106.2 89.4 111.9 64 108.4 86.1 116.1 62 110.6 82.9 120.6 Table 1.: Relative change of parameters versus temperature (reference temperature: 72 ⁰C) The main results are shown in Table 1. Massecuite consistency (relative), f2(T) (Eq. 7) and time of crystallization (from seeding to the end) data belonging to temperatures decreasing from 72 ⁰C (reference temperature) to 62 ⁰C are listed. Appropriate data calculated at 72 ⁰C are used as reference (100 %) data. According to these data, running a strike at 62 ⁰C instead of 72 ⁰C results in 10.6 % larger massecuite consistency (degrading massecuite circulation), and 20.6 % longer time of crystallization. This result is smaller than the one reported by Smejkal (30 %). The difference can be attributed to the decrease of the overall crystallization rate (K), which becomes smaller with decreasing temperature.
4.3 Non-sugar concentration As already discussed, to have the same value of supersaturation while decreasing operating temperature, mother liquor concentration must be decreased too, and this consequently results in decreasing non-sugar concentration as well. This means that when reducing the operating temperature, the reduced non-sugar concentration has some compensating effect regarding the rate of crystal growth (Eq. 8). This effect becomes stronger with decreasing feed syrup purity.
4.4 Crystal content Crystal content has a profound effect on the rate of crystallization (Table 2.). y (by vol., abs) f4(y) 0.00 1.00 0.25 0.56 0.35 0.42 0.55 0.20 Table 2.: The effect of crystal content on crystal growth rate Crystal content is determined by the volume (number and size) of the crystals in a unit volume (1 cm3) of massecuite. Assuming no nucleation all over the strike, the number of crystals in a unit volume will be decreasing due to increasing massecuite volume in the pan. This means that the way massecuite volume (level) is being controlled has a direct effect of on crystal content and on the rate of crystal growth as well.
9
5. SIMULATION STUDIES It was proved that crystal content has a strong effect on the crystal growth rate (see Table 2). Based on the validated Eq. 2 a series of strike simulations have been carried out to calculate crystal growth from seeding till the end of the strikes by using two crystallization control tactics (Version No.1, Version No.2) with four different setting parameters. The overall crystal growth rate (K in Eq. 1 and Eq. 2) was selected to equal the one (K=0.0182, sampling rate=10 s) determined during the validation of the growth rate equation Eq. 2. [5]. The main parameters of the simulations: Feed syrup concentration: Feed syrup purity: Temperature: Syrup m, b, c parameters: Pan seeding volume: Pan maximum volume: Supersaturation:
70 % 98 % 70 ⁰C (constant) valid for cane syrup in a refinery in Louisiana, USA 18 m3 45 m3 1.125 (constant)
Target data: Crystal size: Crystal content by volume: Massecuite solids content:
0.65 (mm) 53 % 90 %
Besides having the same parameters, the two control versions had something in common too: • After having seeding (full seeding with slurry) completed, massecuite level (volume) was kept constant for t.wait=10 minutes. During this time crystal size has increased to about 80 to 100 μm, so the danger of dissolving crystals when the level started to increase was negligible. • Massecuite volume (level) was controlled according to its solids content, but with 4 different setting parameters (b=0.5; b=0.7; b=1.0; b=1.5). Calculation of the setpoint of level was based on massecuite total solids content according to the equations below: 𝑥=
𝑆.𝑚𝑎(𝑡)−𝑆.𝑚𝑎(𝑡.𝑤𝑎𝑖𝑡)
Eq. 13
𝑆.𝑚𝑎(𝑡.𝑒𝑛𝑑)−𝑆.𝑚𝑎(𝑡.𝑤𝑎𝑖𝑡)
S.ma(t): S.ma(t.wait): S.ma(t.end):
massecuite solids content at time t massecuite solids content at the end of time t.wait massecuite solids content at the end of crystallization
𝑧 = 𝑥𝑏
Eq. 14 b:
level control parameter
With these data the massecuite level or volume setpoint can be calculated: 𝐿(𝑡) = 𝐿(𝑡. 𝑤𝑎𝑖𝑡) + 𝑧 ∗ (𝐿(𝑡. 𝑒𝑛𝑑)– 𝐿(𝑡. 𝑤𝑎𝑖𝑡)) or 𝑉(𝑡) = 𝑉(𝑡. 𝑤𝑎𝑖𝑡) + 𝑧 ∗ (𝑉(𝑡. 𝑒𝑛𝑑)– 𝑉(𝑡. 𝑤𝑎𝑖𝑡))
Eq. 15 Eq. 16
5.1 Control Version No.1 Characteristic feature: Target massecuite volume (45 m3) and solids content (90 %) were reached at the same time (at the end of crystallization, when dropping of the charge begins). For clarity, the first four figures (Figures 9 through 12) show only trends belonging to the two b parameter extremes: b = 0.50 and b = 1.50.
10
Fig. 9. “Loose” massecuite: volume versus solids content
Fig. 10. “Tight” massecuite: volume versus solids content
5.2 Control Version No.2 Characteristic feature: Target massecuite volume (45 m3) was reached when solids content was 89 % (1 % less than the target 90 %), then crystallization was continued with constant volume (level) until massecuite solids content reached its target value.
Fig. 11. “Loose” massecuite: volume versus solids content
Fig. 12. “Tight” massecuite: volume versus solids content
5.3 Comparison Comparison of the two control versions is based on some important tabulated data acquired during the simulations. Symbols used: b: parameter used for volume (level) control a.pr: product crystal size (mm) S.ma.end: massecuite solids content at the end of the strike (%) V: massecuite volume (m3) V.sug: total volume of crystals at the end of the strike (m3) Time: time of crystallization from seeding to end of crystallization (min) Time diff.: increase of Time (reference: Time with b = 0.50), (min) Y: crystal content (by vol., %) INT. CONSIST.: time integral of consistency INT. CONS.rel: time integral of relative consistency (%) (ref.: b = 0.50) M. CONS.: stirrer motor energy consumption (kWh) M. CONS.rel: relative motor consumption (%) (ref.: b = 0.50)
b
a.pr (mm)
S.ma.end (%)
0.50 0.70 1.00
0.6513 0.6515 0.6516
90.01 90.01 90.02
1.5
V (m3)
V.sug (m3)
Time (min)
44.99 45.01 45.01
23.98 24.00 24.01
125:30 128:40 132:40
Time diff. INT. INT. (min) Y (%) CONSIST. CONS.rel 0:00 + 3:10 + 7:10
53.30 53.34 53.34
2.14 2.30 2.52
100.0 107.5 117.5
M. CONS. (kWh)
M. CONS.rel
61.38 63.71 66.74
100.00 103.80 108.73
0.6514 90.01 45.00 23.98 138:00 + 12:30 53.30 2.84 132.3 71.00 115.67 Table 3.: Version No.1: Summary of the effect of massecuite volume (level) control on some important parameters of crystallization.
As the data in Table 3 show, using “tight” massecuite control instead of “loose” one in the case of Control Version No. 1 results in
11
• • •
12.5 minutes longer strikes, 32.3 % larger time integral of consistency meaning considerably poorer massecuite circulation and 15.67 % larger stirrer motor energy consumption.
b
a.pr (mm)
S.ma.end (%)
0.50 0.70 1.00
0.6512 0.6512 0.6513
90.00 90.00 90.00
1.5
V (m3)
V.sug (m3)
Time (min)
45.00 45.00 45.00
23.97 23.96 23.98
123:30 125:50 129.00
Time diff. (min) Y (%) 0:00 + 2:20 + 5:30
53.26 53.25 53.28
INT. CONSIST INT. . CONS.rel 1.97 2.05 2.18
100.00 104.29 110.89
M. CONS. (kWh)
M. CONS.rel
55.89 57.19 59.04
100.00 102.33 105.64
0.6513 90.01 45.00 23.98 133:10 + 9:40 53.30 2.37 120.33 61.56 110.14 Table 4.: Version No.2: Summary of the effect of massecuite volume (level) control on some important parameters of crystallization
In Control Version No. 2 using “tight” massecuite control instead of “loose” one (Table 4) results in • 9.7 minutes longer strikes, • 20.33 % larger time integral of consistency meaning considerably poorer massecuite circulation and • 10.14 % larger stirrer motor energy consumption. As the data show, with Version No.2 and with all variants of parameter b there is an improvement of the important parameters when compared with the similar ones of Version No.1. Finally: Data in Table 5 and Table 6 help to show even more the differences in two parameters between the two control versions.
b
INT. CONSIST. Ver.2
INT. CONSIST. Ver.1
Ver.1/Ver.2 (%)
Ver.1/Ver2.min (%)
0.50 0.70 1.00
1.97 2.05 2.18
2.14 2.30 2.52
108.87 112.18 115.41
108.87 116.99 127.97
1.50 2.37 2.84 119.72 144.05 Table 5.: Comparing time integrals of massecuite consistencies (Version No.1 and Version No.2)
b
MOT. CONS. Ver.2 (kWh)
MOT. CONS. Ver.1 (kWh)
Ver.1/Ver.2 (%)
Ver.1/Ver2.min (%)
0.50 0.70
55.89 57.19
61.38 63.71
109.82 111.40
109.82 113.99
1.00
59.04
66.74
113.04
119.41
1.50 61.56 71.00 115.33 127.04 Table 6.: Comparing time integrals of motor energy consumptions (Version No.1 and Version No.2)
6. SELECTING THE OPERATING PARAMETERS (SETPOINTS AND SETPOINT PROFILES) Contribution of the individual components to the rate of crystal growth (see Eq. 1 and Eq. 2) depends on their actual values during the process of crystallization. Some of them are freely selectable for control, like supersaturation (SS) and temperature (T). Others like the overall crystallization growth rate (K), non-sugar concentration (NS) and crystal content (y, abs. by volume) are determined as functions of some other parameters. Opinions on the optimal values of the operating parameters are many and often contradictory. Some people advise to rely on the expertise and advice of the pan operators. The trajectories of the controlled variables (vacuum, temperature, syrup feed and steam input) are based on experience and on quite many human factors. The way a strike is being controlled might be different even with the same pan operator depending on the time of the day (morning, or night shift). Handbooks of the industry usually cover this topic briefly and cautiously. Papers on the subject of crystallization are many, and they are mostly based on material, energy and population balance equations used for modeling the process of crystallization. The model data on the different process parameters (SS, crystal content, mother liquor purity, “optimal” steam and feed flow, vacuum and level setpoint profile etc.) are meant to be used for the control of crystallization. While a set of convincing equations are being used to provide the above data, they are all based on quite many simplifications. Calculation of material and energy balances needs much more instruments, including the measurement of feed syrup and steam (plus water, if used) flows and it is general
12
practice to neglect the problem of instrument accuracy, energy lost to the surroundings, dead-times, time lags and control error. All of this quite often results in surprising (to a trained eye) “optimal” setpoint profiles for example on steam consumption. In one case crystals are growing happily and crystal content is increasing fast with the calculated “optimal” (and assumed as fully accurate) steam flow control even when the calculated SS profile drops well below SS=1.00 for quite a long time. Based on Eq. 1 and on the discussion presented on the effect of its parameters sugar crystallization in batch vacuum pans should be based on the following operating parameters:
6.1 Operating temperature (T) Temperature of the massecuite is closely correlated to the absolute pressure (or vacuum) in the pan. It was proved that operating temperature in the 72 to 75 ⁰C range • has no detrimental effect on crystal color, • results in shorter strikes compared with those run at lower temperatures, • has very positive direct (see: f2(T) in Eq, 7), and indirect effects on quite a few parameters (overall crystallization growth rate K, massecuite circulation, heat transfer, stirrer motor power consumption). Advised operating temperature: T = 72 to 75 ⁰C
6.2 Supersaturation (SS) As discussed before, SS is the most important parameter of crystallization. As a general rule, it should be kept safely below, but close to the nucleation limit all over the strike. The actual value of the nucleation limit depends on syrup / mother liquor purity and temperature. The long-time lack of an instrument providing reliable online data on SS in pans in operation and the quite large range of nucleation limits published in the relevant literature make the selection difficult. Based on experience gained using the SeedMaster Instruments in supersaturation-based control of crystallization in quite a few countries: Advised SS setpoint for seeding: SS=1.08 to 1.10 (full seeding with well-prepared slurry or with footing magma) Advised SS setpoint after seeding: SS=1.11 to 1.13 all over the strike (feed syrup purity P > 90 %) These data are in close harmony with the nucleation limit trend data belonging to T = 75 ⁰C in Fig. 1.
6.3 Level (L) It was proved that fairly “loose” massecuite in contrast to the “tight” one has definite advantages regarding the time of crystallization, massecuite circulation, stirrer motor power consumption, heat transfer from the calandria etc. Having seeded the pan (full seeding with slurry or footing magma): • Level should be kept constant safely covering the calandria for 8-10 minutes (t.wait). • After time t.wait level should be controlled based on online data provided by a well calibrated microwave (preferred) or nuclear instrument (see Equations 13, 14, 15). • The selected level control should provide the same type of benefits as those tabulated in Table 3. (Version 1) or Table 4. (Version 2) with parameter b = 0.5 or b = 0.7. Smaller value of b results in faster syrup feed just after time t.wait, which might result (depending on the type of feed input) in the dissolution of already crystallized sugar. • “Tightening” (continuing evaporation without feed input) of the massecuite towards the end of the strike should be avoided, because it quite often results in excessive supersaturation provoking nucleation, while losing effective product volume. Advised value of parameter b = 0.5 or 0.7 Advised control version: Version No. 2.
7. IMPLEMENTING ADVANCED CONTROL BASED ON SUPERSATURATION One way to implement SS-based control of crystallization is shown in Fig. 13. Instruments: 1. K-PATENTS process refractometer (provided online data: liquid concentration and temperature) 2. K-PATENTS SM-3 device (provided data: SS, mother liquor purity, crystal content) 3. Third-party microwave or nuclear instrument 4. Third-party level transmitter 5. Third-party vacuum or absolute pressure transmitter Controllers:
13
1. 2. 3. 4. 5.
PID1: steam input (slave1) controller PID2: SS1 (master1) supersaturation controller PID3: absolute pressure (slave2) controller PID4: SS2 (master2) supersaturation controller PID5: level controller
Operation in brief: Steam input to the calandria is controlled by the PID1 (slave1) controller operating the steam valve. It has an approximate concentration (liquid) setpoint, which is modified, if needed by the output of its master PID2 (SS1) controller. The two controllers operate in cascade configuration (CASCADE 1). Absolute pressure (vacuum) in the pan is controlled by the PID3 (slave2) controller operating the vacuum valve. It has its approximate (absolute pressure) setpoint, which is modified, if needed by the output of its master PID4 (SS2) controller. The two controllers operate in cascade configuration (CASCADE 2). The two master SS controllers have the same SS setpoints. Level is controlled by the PID5 controller operating the feed valve. Its setpoint is calculated online, as already discussed.
Fig. 13. Configuration of supersaturation-based control of sugar crystallization The configuration of control shown in Fig. 13. is in operation in several countries of the world.
Fig. 14. Process refractometer and SM-3 configuration capable to serve 2 vacuum pans (with 2 sensor heads) simultaneously The use of the SM-3 I/O Unit shown in Fig. 14. is optional. All input and output data needed for the operation can be transmitted by digital communication between the SM-3 and a PLC or DCS.
14
8. EXAMPLES AND EXPERIENCE GAINED WITH SUPERSATURATIONBASED CRYSTALLIZATION CONTROL Data and trends on the important parameters acquired during SS-based control provide a wealth of information which can be used to improve the current practice of crystallization.
8.1 Example No.1 Location: Refinery in West Africa
Fig. 15. Trends on the major parameters of a strike Comments: 1. Supersaturation is fairly well controlled: SS.max=1.125; SS.min=1.075; SS.av=1.102 2. Massecuite level control: Time of wait=10 min; parameter b=1.0 3. Massecuite temperature: Temp.max=69.4; Temp.min=66.4; Temp.av=67.4 (⁰C) 4. Product crystal content: 57 (% by vol.) 5. Product crystal size: 0.52 (mm) 6. Massecuite solids content: 90 (%) 7. Due to the calibration error of the microwave probe there is a (false) step increase of crystal content and crystal size just after seeding. 8. Running the strike with 5-6 ⁰C higher temperature, a little bit higher supersaturation and smaller b parameter of level control could reduce the time of crystallization effectively. Notes on local constrains: 1. The actual time of crystallization (from seeding to dropping the charge) is only 57 % of the total time of the strike. This is partly because too much time (32 min) was needed to feed the pan when starting the strike to begin concentration. 2. Syrup concentration to reach seeding takes 77 minutes due to the very low feed syrup concentration (61.5 %). This is the major cause of the small efficiency regarding the use of time defined as time of crystallization over total time of the strike (in this case: 57 %). 3. Due to the very low feed syrup concentration (61.5 %) steam demand during the strike is very high. When two or more strikes are started in similar vacuum pans close in time, serious problems with steam supply may arise and cause difficulties.
8.2 Example No.2 Location: Sugar mill in the Far East As already mentioned, shock seeding combined with the use of water is practiced in many mills and refineries. A series of tests have been conducted in this plant with the new control method and full seeding with slurry in one of the product pans without using any water during the strikes. The new way of control resulted in considerable improvements regarding the two product
15
crystal parameters, MA and CV (Fig. 16 and Fig. 17). It is well known that use of water after shock seeding dissolves some of the fine crystals and therefore improves the value of CV. Despite this fact, when full seeding with slurry without any use of water all over the strike and the new way of control was introduced, better CV data were achieved.
Fig. 16. MA with and without the use of water
Fig. 17. CV with and without the use of water
If implemented with all of the pans in this plant savings on the use of water and energy could reach about 400.000 USD / year.
8.3 Example No.3 Location: Sugar mill No. 1. in Central America SUMMARY SEASON 2015/16 SEASON 2016/17 Crystal Content by Mass 47,8% 52,9% (Vacuum Pans) Crystal Content by Mass 37,9% 44,6% (Centrifugals) Dissolution of Sugar by mass 20,8% 15,7% (%) Sugar Color IU 21,38 24,3 Sugar MA 0,46 0,61 Sugar CV 29,43 38,00 Strike Time (min) 168 136 Strike Time best average of 7 145 115 days (min) No. of strikes per day 16,0 19,2 Max. No. of strikes per day 20 25 Down Time (cleaning included) average per strike 10,6 13,8 (min) Average Ton per Day of 433 613 Refined Sugar Max. Ton per Day of Refined 536 730 Sugar
RESULTS 11% 18% 25% 13,7% 33% 29% 19% 21% 20% 25% 30% 42% 36%
Table 7.: Change of the important production parameters Table 7. shows comparative data on the most important production parameters collected during two seasons (2015/16 and 2016/17) respectively. The improvements in the second season were partly due to the considerably increased operating temperature and by the introduction of full seeding with slurry. Data with green background reflect improvement, while those with yellow background show degraded data. Notes: • Data in the table reflect a massive increase of production in the second season (for example: average ton of refined sugar produced per day was increased by 42 %). • Sugar color was slightly (+ 13.7 %) increased to 24.3 IU. This was probably due to the reduced dissolution by washing in the centrifugals. It is still much better than the ICUMSA technical specification for white sugar (45 IU max.). • Sugar MA was increased by 33 % due to changing seeding practice from shock to well-prepared full seeding. • Sugar CV was increased by 29 %, probably due to the reduced washing in the centrifuges. • Down time (including discharge and cleaning) was increased probably due to higher crystal content and consistency of the massecuite.
8.4 Example No.4 Location: Sugar mill No. 2. in Central America
16
In this mill it was common practice to discharge the massecuite when its solids content was 90 % measured by a microwave probe. At that time the stirrer motor load was still below its specified maximum. When the practice was changed to drop the charge a few minutes later when motor load reached its specified maximum, total solids content of the massecuite was 91.7 % and there were no problems encountered due to this change, but the crystal yield per strike was increased accordingly. Lesson to learn: even small things matter.
9. CONCLUSIONS Selection of the best values for the major operating parameters has been an important subject of industrial scale sugar crystallization since a long time. Empirical trajectories, products of long-lasting (often never ending) experiments based on the method of trial and error have been commonly used in the industry. Introduction of the SeedMaster Instruments made the use of reliable online data on supersaturation, never available before, reality. Experience acquired by their use in a large number of strikes in different countries provided the base for the introduction of a crystal growth (linear) rate equation validated with pans in normal operation in two countries [5]. The growth rate equation provided an excellent tool to study the effect of its governing parameters on the process of crystallization. The importance of supersaturation in crystallization control has long been acknowledged in the industry. Similarly, the quite many effects of temperature and level of the massecuite on the process have been recognized, but due to the complexity of the relationships, opinions on their “optimal” values during a strike are many and sometimes conflicting. In this paper simulated data are used to compare the effect of different operating parameter selections. It is shown that proper setpoint selection (and control) of the important variables, like supersaturation, temperature and level of the massecuite during a strike can result in considerable savings in the use of energy (due to absolutely no use of water, reduced stirrer motor power consumption and improved circulation), reduction of the time of crystallization and the amount of recycled sugar, mean crystal size (MA) close to target and improved product yield and crystal size distribution (CV). Proper selection of the setpoints for the important parameters naturally must be followed by a well selected control strategy to be effective. In this paper a control configuration consisting of 5 PID controllers is introduced. They are used to implement supersaturation-based control of steam flow and vacuum combined with massecuite level control based on its solids content. Some results obtained by their use in mills in different parts of the world are also presented.
References: 1.
M. Twain: Life on the Mississippi (1883)
2.
L. Rozsa: The SeedMaster device for on-line supersaturation measurement and automatic crystallizer seeding International Sugar Journal, Vol. C Issue No. 1200, Dec. 1998, pp. 601-607
3.
L. Rozsa: SeedMaster 2: A universal crystallization transmitter and automatic seeding device International Sugar Journal, Vol. CVIII Issue No.1296, Dec. 2006, pp.683-695
4.
L. Rozsa: On-line monitoring and control of supersaturation and other massecuite parameters in vacuum pans: A control engineering approach International Sugar Journal, Vol. CXIII Issue No. 1356, Dec. 2011, pp. 853-862
5.
L. Rozsa, J. Rozsa, S. Kilpinen: Crystal growth and crystallization control tactics in industrial sugar crystallizers Part 1. Crystal growth International Sugar Journal, Oct. 2016
6.
L. Rozsa: On-line monitoring of supersaturation in sugar crystallization International Sugar Journal, 1996, 98, pp. 660-675
7.
R. Broadfoot, P.G. Wright: Nucleation studies Proc. 39th Conf. QSSCT, 1972, pp. 353-362
8.
J. Ziegler: Sugar Boiling – The Syrups in the Vacuum Pans Company Communication
9.
M. Saska: Boling point elevation of technical sugar cane solutions and its use in automatic pan boiling International Sugar Journal 2002, 104, 1247, pp. 500-507
17
10. K.E. Austmeyer, T. Frankenfeld: Die radiometrisch erfasste Dichte als Messgröße für den Kochprozess Zuckerindustrie 110 (1985) Nr. 2. 11. R.A. McGinnis: Beet-sugar technology, Third Edition, 1982 12. F. van Noord, E. Poiesz, A. Wittenberg, M. Ooms: Investigation of cane sugar colour under beet sugar co process conditions Proc. Sugar Industry Technologists Conference, Auckland, New Zealand, 2012 13. Q. Smejkal, R. Schick, A. Bagherzadeh, L.G. Fleischer: Auswirkungen verringerter Temperaturen bei Eindampfung und Kristallisation auf die Zuckerqualität und den Energiebedarf bei der Zuckergewinnung - Influence of reduced temperatures in evaporation and crystallization on the sugar quality and energy consumption in sugar production Zuckerindustrie 131 (5/2008) 14. L. Rozsa, J. Rozsa, S. Kilpinen: Crystal growth and crystallization control tactics in industrial sugar crystallizers, Part 2. Control tactics International Sugar Journal, Sept. 2017 15. L. Rozsa, J. Rozsa, S. Kilpinen: Crystal growth and crystallization control tactics in industrial sugar crystallizers, Part 3. Control tactics (continued) International Sugar Journal, Oct. 2017 16. S.F. Azevedo, J. Chorao, M.J. Goncalves, L.S. Bento: Monitoring Crystallization Part I, Part II International Sugar Journal, 1993, 95., (1140): pp. 483-488 International Sugar Journal, 1994, 96., (1141): pp. 18-26 17. A.I. Gromkovskij, V.M. Fursov: Influence of crystal size on massecuiterheology Izvest. V.U.Z. Pischch. Teknol., 1977, 4, pp. 157-162
18