TII-14-1069
1
Selection of Network Parameters in Wireless Control of Bilateral Teleoperated Manipulators Yaser Maddahi, Member, IEEE, Stephen Liao, Wai-keung Fung, Senior Member, IEEE, Ekram Hossain, Fellow, IEEE, and Nariman Sepehri, Senior Member, IEEE Abstract—This paper describes how to establish performance charts for selection of network parameters for effective utilization of a bilateral teleoperated manipulator working under a wireless communication channel. The goal is to construct a set of charts that help researchers and engineers to select appropriate parameters of wireless network setup for a known configuration of environment obstruction. To achieve this goal, a teleoperated setup comprising a master haptic device, a slave manipulator dynamic simulator, and a communication channel emulated using the NS2 simulator, is first developed. Next, performance indices are defined to evaluate the quality of position tracking of the slave manipulator end-effector and force tracking of the master haptic. Three indices, chosen in this paper, are: the integral of squared position and force errors, the integral of absolute position and force error, and the amplitude of position and force overshoot. Extensive experiments on the developed setup are then conducted to study effects of timevarying packet loss on the performance of the teleoperated system. The largest mean packet loss, at which the system exhibits satisfactory tracking, is then quantified. This packet loss is used as an indicator to define regions representing the quality of tracking. The effectiveness of the proposed technique is validated by testing a fully-instrumented hydraulically-actuated system under various real wireless channel scenarios. Index Terms—Wireless network, teleoperation, performance chart, NS2 simulator, hydraulic manipulator.
I. INTRODUCTION
F
OR effective teleoperation, stability and transparency are two main issues, especially when the system is controlled through a wireless communication channel exhibiting rapidly time-varying delay and packet loss. In general, the overall system should be stable irrespective of input commands or type of environment [1], and at the same time provide a faithful perception of the remote environment to the operator. Technically, this is achieved if the performance, i.e., position and force tracking, is good [2]; however, there is always a tradeoff between high performance and sufficient stability Y. Maddahi and N. Sepehri are with the Department of Mechanical Engineering, University of Manitoba, MB, Canada, R3T 5N5 (e-mail:
[email protected],
[email protected]). S. Liao and E. Hossain are with the Department of Electrical and Computer Engineering, University of Manitoba, MB, Canada, R3T 5N5 (e-mail:
[email protected],
[email protected]). W. K. Fung is presently with Department of Electrical and Electronic Engineering, Robert Gordon University, Aberdeen, Scotland, UK, AB10 7QB (e-mail:
[email protected]).
margins [3]. Many studies have addressed this tradeoff for electrically-actuated manipulators with controllable torques, which led to the development of various control schemes for stable and transparent bilateral systems [1]. The schemes included scattering transformation, wave variable, H∞ robust control, shared compliant control and wave variable with prediction. Later on, the effectiveness of various control schemes was investigated towards bilateral control of teleoperated systems [4]. Few studies focused on the performance evaluation of delayed and lossy teleoperated systems in bilateral mode [5, 6]. Network delay is the amount of time taken for a packet to be transmitted from the source to the destination. Packet loss occurs when data do not reach their intended destination. Prior to this work, Maddahi et al. [6] examined the effects of constant time delay and packet loss on performance of a bilaterally-controlled hydraulic actuator. Four control schemes were examined, namely force reflection (FR), position error (PE), hybrid FR-PE, and four channels (FC). Zarei-nia et al. [7] also evaluated the performance of this hydraulic actuator under five control schemes including FR, PE and FC. For outdoor applications, teleoperated manipulators are preferred to be controlled wirelessly. In wireless channels, information is transmitted by radiating a modulated electromagnetic wave at a certain carrier frequency by means of a transmitter antenna and picking up energy of the radiated wave by means of a receiver antenna [8]. Time-varying packet losses are the most dominant phenomena in wireless networks that seriously affect the performance and stability of the system [9]. Although there are limited studies that present the control of haptic communication through a wireless network [10], to the best of the authors’ knowledge, no published work has reported a technique that selects network parameters for effective operation of bilaterally-controlled manipulators operated through wireless communication channels. In this paper, we investigate performance of a telemanipulator operating under a wireless communication channel. An approach described that generates a set of performance charts helping us to choose parameters of a wireless network setup, and allowing the teleoperated system to work within an acceptable range of quality. Validations are performed on a teleoperated hydraulic actuator as a typical manipulator with application in live-line maintenance in which the power transmission needs to be always functional [11]. Since maintenance of power distribution systems is a
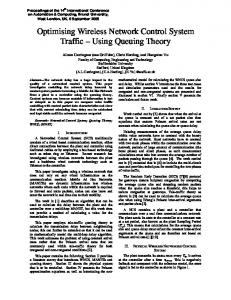
TII-14-1069 hazardous task to conduct, the use of tele-robotic systems for maintenance of power live distribution networks is an alternative [12]. The tele-robotic system, used to validate results of this study, includes a master site consisting of a PHANToM Omni haptic device and a slave site, which is a fully-instrumented valve-controlled hydraulic manipulator. Both master and slave sites are connected using a PC executing the NS2 software. A computer runs the Network Simulator Version 2 (NS2) [13] in emulation mode to act as the communication channel between the master and the slave sites. The performance of the entire teleoperated system is evaluated by a set of performance indices: the integral of squared position and force errors, the integral of absolute position and force error, and the amplitude of position and force oscillations. The performance indices quantify the quality of position tracking of the slave manipulator endeffector and force tracking of the master haptic device. Two desirable thresholds are predefined for each index according to the intended application and required quality of position/force tracking. The lower threshold indicates the safe (acceptable) region to operate and the upper threshold shows the marginal zone, above which the system does not reflect desirable performance. To construct the performance charts, a variety of tests are conducted under different mean packet losses using a simulation of the slave manipulator. For each defined threshold, the maximum mean packet loss, at which performance indices are lower than the predefined indices, is identified. These two packet losses allow us to define three regions representing three levels of acceptable, marginal and unacceptable qualities. A set of performance charts is then constructed that allows the combined parameters of a wireless network to be selected for good performance. Validity of the proposed charts is also investigated by performing experiments on a real test rig in which the simulator is replaced by the real hydraulic manipulator. The rest of this paper is organized as follows. Section II describes how the performance charts are developed. The NS2 software running in emulation mode for wireless communication channels is also described in Section II. The experimental setup and test procedure are explained in Section III. A set of performance charts are constructed for a typical manipulator whereby the slave manipulator is a single degree of freedom (DOF) hydraulic actuator. Experimental results are presented in Section V, followed by future work and significance of the work in Section VI. Concluding remarks are outlined in Section VII. II. CONSTRUCTING PERFORMANCE CHARTS FOR WIRELESS CHANNELS A. System overview A teleoperated robotic system is composed of a master site in which an operator utilizes a hand-controller, a slave site where a manipulator follows the behavior of the master device and, a communication channel connecting both the slave and master sites. Figure 1 shows the general architecture of
2 teleoperated manipulator. The hand-controller generates position/velocity commands for the slave manipulator at the remote site. Typically, operators rely on visual information, directly or through cameras, to perform teleoperated tasks. In order to render the interaction forces between the slave manipulator and the environment, haptic capability is added to the hand-controller, which potentially increases task quality, productivity and human safety [14]. Note that when the system operates under a wireless channel, the master and slave sites communicate through a channel in which the packet loss plays a significant role in the deterioration of signal quality transferred [15]. Master haptic device xm F
* s
Slave manipulator x*m
Communication channel
Fs
Fig. 1. General architecture of a teleoperated system working under a delayed and/or lossy network. Dashed arrows indicate flow of data from master to slave, and solid arrows shows the flow from slave to master. Fs and xm show scaled slave force and master position, respectively. F*s and x*m are delayed versions of Fs and xm, respectively. Delays in the master-to-slave and slave-tomaster paths are different and time-varying.
B. Master/slave equations of motion The evaluation stage of the proposed procedure needs a simulation model of the manipulator at the slave site. The use of simulation, at this stage, avoids jeopardizing the experimental platform when the charts are constructed. Equation of the slave manipulator motion is expressed, in general form, as follows: ( ) ̈ ( ( ) (1) ̇ ) where ̇ , and ̈ are the vector of joint displacements and its first and second derivatives with respect to time, respectively. is the vector of actuator torques, and ( ) represents the gravitational terms. ( ) and ( ̇ ) are the manipulator inertia and Coriolis matrices, respectively. Equation (1) will be later extended for the 1-DOF tested hydraulic slave manipulator. The following equation simply describes the dynamics of the haptic device at the master site [16]: ̈ ̇ (2) where represents the position of the master haptic device. is the force applied by the operator’s hand, and denotes the master force generated by the haptic device. and are the inertia and damping coefficients of combined operator’s arm and haptic device, respectively. is the stiffness of the human arm. denotes the backdrive friction force and, is less than 0.26 N for the PHANToM Omni device [6]. C. Communication channel Traditionally, performance of teleoperated systems is measured through uncontrollable network (e.g. the Internet), or over-simplified emulated network (e.g. constant delay channel). These methods have some limitations such as unrepeatable experiments, and unrealistic and uncontrollable network environments for experiments. To overcome these
TII-14-1069
3
limitations, a computer running NS2 in the emulation mode is used to emulate the communication channel. NS2 is a packetlevel simulation tool, and is used to study the behavior of networks [13]. The NS2 provides functions to generate simulation scenarios and protocols for both wired and wireless networks. In this study, NS2 is chosen for its availability, widespread use, and ability to be extended [17]. With respect to the experiments conducted in this paper, three computers run master, slave and network emulator individually. The PCs are connected in a local area network through an Ethernet hub. Both the master and slave computers are set to send packets to the emulator. The emulator changes the source and destination IP addresses of any incoming packets such that packets sent from the master site are forwarded to the slave site and vice versa. The NS2 is also employed to investigate how stably and transparently the teleoperated system operates when the master and slave are wirelessly connected in an outdoor environment. A study, conducted by Ivanov et al. [17], has shown that the NS2 wireless simulation can accurately reflect a real WiFi connection with a static environment and a simple obstruction model. Some inaccuracies in modeling may occur due to automatic data rate selection of wireless cards and processing delays of the operating system that are not considered in NS2 [18]. In NS2, the wireless experiments focus on investigating the effect of changes in parameters of the radio propagation model on the performance of the teleoperated system. One of the common radio propagation models is the shadowing model [19]. The NS2 shadowing model computes the power received as a random variable in which the average received power is assumed to decrease logarithmically with distance. The shadowing model consists of two parts. The first part predicts the mean received model and the second part reflects variations of this power. The power received by a receiver antenna ( ), at a distance of from a transmitter antenna, is expressed by the Friis free space equation [19], ( )
(
)
random variable with zero mean value, and standard (shadowing) deviation (in dB). In practice, and are computed from the measured data. Empirical measurements of coefficients, and , for a number of wave propagation cases, are provided in [19]. In wireless communication, a target minimum received power level ( ) is defined, below which the performance of the teleoperated system becomes unacceptable, i.e. the system exhibits instability and/or poor transparency. is also called carrier sense threshold that is the minimum power of the carrier wave that the receiver accepts which is specified according to router used. The probability that the received signal level will fall below this threshold is calculated from cumulative distribution function (cdf) using (5) as follows: [ ( ) ] (5) [
( )
[ (
)]
[
] ].
[ ( ) ] indicates the probability of Specifically, dropping a packet. Figure 2 shows the probability of dropping a packet in typical scenarios. In this figure, the system loss constant, , is equal to 1, and is set to 1 m, which is a typical value for low-gain antennas for the frequency of interest [19]. As shown in Fig. 2, by increasing the distance, the probability for dropping a packet increases quickly for low-gain antennas. Moreover, at a certain distance, the packet loss increases when a router with lower antenna power is chosen. For example, given a known obstruction (e.g. = 2.7 dB and = 4 dB) and an antenna transmission power (e.g. = 90 mW), an average packet loss of 40% corresponds to a distance ( ) of 95.2 m. This implies that a distance more than 95.2 m is probable to generate average packet losses of more than 40%, or in other words, the probability of receiving a packet is less than 60%. Results shown in Fig. 2 are in accordance with the results obtained from the NS2 (see Section IV).
(3)
where and are the transmitter antenna power and gain, respectively. The receiver antenna gain and the wavelength are denoted by and , respectively. is the system loss factor, which is not related to propagation ( ≥1). Note that in this work represents the distance between the master and slave sites. Equation (3) is only applicable for distances that are shorter than what is used in practice, and within the far-field (Fraunhofer region) of the transmitter antenna [19]. In practice, the surrounding environment clutter may vastly be different given the same distance between the master and slave sites. Therefore, the received power is represented as a random and distributed log-normal function (normal in dB), at any distance , and expressed as follows [19]: [ ( )] [ ( )] ( ) (4) where and are the path loss exponent and reference distance, respectively. ( ) denotes the received power for a given , and is calculated using (3). represents a Gaussian
Fig. 2. Probability of dropping a packet when = 4 dB, = 2.7 dB and varies from 30 mW to 90 mW. is set to -70 dBm, and values of and are set to 2.
D. Constructing the charts The first step to construct performance charts is to define appropriate indices by which the performance of the entire system can be evaluated. Using performance indices, acceptable behavior criteria are defined to evaluate the quality of position/force tracking. For each criterion, two thresholds are set that reflect the acceptable (lower value) zone and the marginal (upper threshold) zone to operate the system. Afterwards, a set of tests are performed using the platform
TII-14-1069
4
shown in Fig. 1. Since packet loss is the main phenomenon in the wireless communication channels, performance of the teleoperated system is investigated under different profiles of time-varying packet losses determined by different network parameters such as path loss exponent and transmission power of the router. Although the profiles, in simulation mode, may not accurately reflect the network conditions encountered in practice, they are used to observe how response of the system changes while packet loss is varying over time. These tests identify two mean packet losses that correspond to lower and upper thresholds. Each packet loss should guarantee that all performance indices remain lower than predefined value. Therefore, it should assure that the quality of position (at the slave site) and force (at the master site) tracking signals remain within acceptable (for lower threshold) or marginal (for upper threshold) region. We then construct a set of performance charts based on the identified packet loss thresholds. Three regions are defined: acceptable (where the average packet loss rate is less than the threshold ), marginal (where the average packet loss rate is between limits and ), and unacceptable (where the average packet loss rate is above the threshold ). Figure 3 depicts how the three regions are related to the packet loss rate. Construction of a new set of performance charts is needed when different application, control scheme, packet loss handling schemes, change in control law parameters, and/or teleoperation setup is considered. The performance charts are constructed to be used as an indication for future setting of the teleoperated system.
Packet loss (%)
100
Unacceptable
𝐹𝑈 𝑃𝑡
𝐹𝑀
Marginal 𝑑𝑀
0
0
𝑑𝑈
Acceptable
Distance (m)
Fig. 3. Three regions defined to show the level of position and force tracking accuracy. Graph was plotted based on Fig. 2.
Using the graph as in Fig. 2, a lookup table is constructed (Table I). In this table, given a pair of and , the distances at which the network has average packet losses of and , are found. For example, consider the shaded row in Table I, the values of and for = ( ) and = mW are obtained (m) and (m), respectively. TABLE I LOOKUP TABLE OF NETWORK PARAMETERS. SIMILAR TABLES CAN BE CONSTRUCTED FOR OTHER VALUES OF AND . = ,
⁞
⁞
⁞
Figure 4 depicts the flowchart of constructing the lookup table/performance charts. As observed, the table/chart is generated using simulation program of the master-slave setup as well as emulation of the wireless network using NS2. In the case study, presented for experimental validations, a set of performance indices are defined (to be described in Section IV): integral of squared position error/force error, integral of absolute position error/ force error, and maximum magnitude of position/force signal overshoot. Moreover, three network parameters are used to construct the lookup table: distance between the master and the slave sites, path loss exponent, and transmission power of the router. Simulate the master-slave setup (Section B) Simulate wireless channel (connecting master and slave sites) using NS2 (Section C) Define performance indices Determine upper/lower threshold Test teleoperated system under different profiles of network variables§ Identify three acceptable, marginal and unacceptable regions (Fig. 3)
Construct lookup table/performance chart (Table I)
Define parameters of the wireless setup such as path loss exponent and transmission power of the router
§
In this study, packet loss is assumed as the dominant phenomenon in wireless channels. Thus, simulated setup is tested under different profiles of time-varying packet loss.
Fig. 4. Flowchart of constructing the lookup table or performance charts.
III. EXPERIMENTAL SETUP A. Test rig overview Figure 5 depicts the teleoperated hydraulic benchmark test rig consisting of a PHANToM Omni haptic device, a network emulator and a double-rod valve-controlled hydraulic actuator. In preliminary tests, simulation of the hydraulic actuator, interacting with a virtual spring, as an environment, is employed at the slave site. The interaction force between the hydraulic actuator and the environment is measured by a force sensor attached to the end-effector. Two PCs control the haptic device and the hydraulic actuator. Information between the master and the slave is transferred through a wireless communication channel emulated by the NS2 simulator. The modules (master, slave and NS2 simulator) in the test rig interface with each other through UDP (User Datagram Protocol) connections. B. Dynamic model of slave hydraulic manipulator At the slave site, a simulation program emulates the dynamic behavior of a valve-controlled hydraulic actuator consisting of a servovalve, and a double-rod hydraulic actuator that is in contact with a stiffness dominant environment (see Fig. 6). The control input, , causes a valve spool displacement, , which in turn controls flows, and , into and out of the actuator [20]. Assuming the actuator is activated by an ideal critical centre servovalve, with matched and symmetrical orifices, the nonlinear governing equations of the flows and are written in the following compact form [21]:
TII-14-1069
5
√ √
√
( )(
√
( )(
–
)
(6)
)
(7)
where is the orifice coefficient of discharge, and is the hydraulic fluid density. denotes the width of the port cut into the valve bushing through which the fluid flows. The supply and tank pressures are denoted by and , respectively. Variables and are the hydraulic pressures in each of the actuator chamber. The sign function is defined as follows: ( )
{
(8)
The continuity equations describing the pressure changes in each actuator chamber as a function of flows in and out of the actuator, and , can be written as follows [20]: ̇ ( ̇ ) (9) ̅ ̇
(
)
̅
(–
̇ )
(10)
where is the annulus area of the piston. The volumes of fluid contained in the connecting lines between the servovalve and the actuator are denoted by ̅ and ̅ . The actuator stroke is denoted by . The fluid bulk modulus is given by . and ̇ are the displacement and velocity of the actuator, respectively. Since the manipulator has single DOF, in this model, the term in (1) is replaced by which is mapped version of the haptic device positional component along . Therefore, motions of the haptic device along the two other axes ( and ) are not considered in determining the slave manipulator motion. Equation (1) can be extended for the tested manipulator as follows [22]: ̈ ̇ (11) ( ) is the inertia of Comparing (1) and (11) gives: the moving part of the actuator. ̈ ̈ is the acceleration of
Operator
In (14),
and
are servovalve input voltage and the spool
Communication channel
Master site
Fh
( the piston. ̇ ̇ ), where denotes the equivalent viscous damping coefficient describing the combined effects of viscous friction. External force applied to the manipulator is that is equivalent with in (1). The differential or load pressure is defined by ( ), and (12) where is the stiffness of the environment. Note that, when the hydraulic actuator moves in free motion, the stiffness of the environment is zero, i.e., , therefore, . When the hydraulic actuator interacts with the environment, . A more general form for the environment, i.e., mass-springdamper system, can also be considered; but, the effects of the mass and damper of the load are already incorporated in and , respectively in our formulation. Since the manipulator has no vertical movement, the term ( ) does not appear in (11). The dry friction acting between the piston and cylinder walls, , is given in the following relation [23]: ̇ ̇ ̇ ̇ ̇ ̇ (13) ̇ ̇ ̇ ̇ ̇ { ̇ where ( ) . is the threshold velocity and is set to 0.005 m/s for the simulated hydraulic actuator [37]. In (13), the friction force ( ) is given in Newton, and the velocity of the hydraulic actuator ( ̇ ) is given in m/s. Dynamics of the servovalve is described by the secondorder model [22]: ̈ ̇ (14)
Fm , xm
Fm* , xm*
Master Network Fe* , xs* channel PC
Fe , xs
xm
x m Haptic device Fm
Slave site
xs
u Slave PC
Slave
Fe , xs manipulator Fe Environment
Force sensor
Pressure sensor
Flowmeter
Hydraulic actuator
Spring
Fig. 5. Teleoperated hydraulic actuator setup. Subscripts “s” and “m” represent variables at slave and master sites, respectively. Superscript “*” denotes a delayed/lossy variable. Haptic device is able to move in three-dimensional space, but only component along direction is used.
TII-14-1069
6
along
Servovalve Flapper Spool Environment 𝑥𝑠 𝑘𝑠 Piston D
Linear spring
Hydraulic actuator Fig. 6. Schematics of hydraulic actuator interacting with a stiffness dominant environment.
displacement, respectively. represents the valve spool position gain. and denote the natural frequency and damping ratio, respectively; they characterize magnitude and phase responses of transient behavior of the servovalve. In order to model the fluid pressure behavior inside the cylindrical chambers of the hydraulic actuator, the temperature and the density of the fluid are assumed to be constant and the effect of both internal and external leakages are neglected. The numerical simulation of the above model is generated using the 4th-order Runge-Kutta method. Parameters used in simulation are given in Table II. Values of these parameters were directly obtained from manufacturer’s data sheet or by experimental measurement/verification [24]. The accuracy of the simulation model of the slave hydraulic manipulator, which is denoted by Eqs. (6) to (14), has been verified thoroughly in [24]. TABLE II PARAMETERS OF HYDRAULIC SYSTEM AT SLAVE SITE. Parameter Symbol Value Supply pressure ( Tank pressure Combined mass of piston and rod Viscous damping coefficient Actuator stroke Piston area ̅ ̅ Volume of connecting lines Valve orifice area gradient ⁄ Valve spool position gain Valve natural frequency Valve damping ratio Fluid bulk modulus Orifice coefficient of discharge Hydraulic fluid density
)
The model of the haptic device at the master site is given in (2). In preliminary experiments, a real haptic device is used; therefore, there is no need to use a simulation model for the master site. The control signal, provided by the hybrid bilateral control scheme, is proportional to the position error between master haptic device, , and slave actuator, , and is defined as follows [6]: ( ) (15) where is a gain. The master force ( ), generated by the haptic device, is
direction, and is defined as: ( ) (16) where and are the control gains, and is the interaction force between the hydraulic actuator and the environment. The hybrid control scheme, presented by (15) and (16), was previously shown to perform well in terms of position tracking, force tracking, and perceived stiffness [6]. IV. GENERATION OF PERFORMANCE CHARTS FOR HYDRAULIC MANIPULATOR In this section, the process of generation of performance charts for teleoperation of hydraulic manipulator via wireless communication network is described. A. Performance indices The experimental results are quantitatively analyzed by calculating six performance indices related to position and force tracking signals at the slave and master sites. The indices used are [25]: the integral of squared position error ( ), the integral of the squared force error ( ), the integral of absolute position error ( ), the integral of absolute force error ( ), maximum magnitude of position response overshoot ( ), and maximum magnitude of force signal overshoot ( ). Using these six indices, two average packet loss rates ( ) are identified. Each packet loss relates to a threshold that is determined by the end-user given the above performance indices. In other words, the values of and depend on the accuracy that we need in force and/or position tracking signals in an application requirements. The thresholds for the performance indices are listed in Table III. Note that when at least one of the six performance indices exceeds its upper threshold, the operator will not be recommended to go beyond the packet loss identified according to the upper threshold ( ). Thus, in order to locate the system within the acceptable (safe) region, for a particular environment (given ), the operator is advised to decrease the distance between the master and the slave site, or increase the power of the transmitter router. In addition to measuring the proposed indices, the experimental results are also qualitatively analyzed by observing how well position and force signals at the slave and master sites are tracked. TABLE III PERFORMANCE INDICES USED TO DETERMINE THE MAXIMUM ALLOWABLE MEAN PACKET LOSSES ( AND ). Performance Lower threshold Upper threshold index 2 60 mm 80 mm2 16000 N2 26000 N2 8 mm 10 mm 140 N 180 N 1 mm 4 mm 10 N 100 N
B. Test procedure In all tests, the hydraulic actuator is guided by the haptic device through a delayed or lossy channel. In each test, the
TII-14-1069
7
operator is asked to follow the trajectory depicted in Fig. 7. The task is to move the actuator back and forth in both free and constrained environments. The actuator interacts with the environment emulated by a linear spring of 45 kN/m stiffness during the constrained motion. The total time of each motion cycle depends on the operator’s hand speed, and varied from 1 to 4 seconds. The tests do not cause saturation in the control signal. The controller gains are tuned under a communication channel configured at 0 ms of time delay and 0% of packet loss. They are then kept constant for all trials in construction of performance charts.
Position (m)
Free motion
Constrained motion
0.13 Environment
0.1
0.08 Time (s)
Fig. 7. Trajectory of hydraulic actuator coordinated by haptic device.
C. Establishing maximum allowable mean packet loss The profiles for the delay and packet loss in communication channel are generated using the NS2 simulator. A typical scenario is shown in Fig. 8. In total, 10 trials are conducted. In this scenario, the NS2 emulates a communication channel with a time delay of 0 ms, while the packet loss increased from 0 (at start time of each 10-second interval) to about 50% (at end time of each 10-second interval). Packet loss is generated by NS2 by randomly withholding the packets sent between the master and slave. In the experiments, NS2 was set to drop a percentage of the received packets based on the typical
Fig. 8. Typical window of packet loss over 10 seconds of emulation using NS2 to identify maximum allowable packet loss. Packet error of zero means lost and one means successfully received. Average packet loss of 40%, for example, occurred at 7.7 s (see vertical red lines).
window of the packet error indicated by 0 (lost) and 1 (successfully received). As shown in Fig. 8, intermittent bursts of packets are received at the corresponding destinations (master or slave) indefinitely. Figure 8 shows the plot assuming that around 1000 packets are sent in every 200 ms. The decision to drop a packet is determined by a random number generator following uniform distribution, i.e., a number in the range of [0, 1) is chosen. Next, the number is compared to the packet loss ratio. For example, given the desired packet loss is 5%, if the random number is below the threshold (0.05) corresponding to the target minimum received power level ( ), the packet is dropped; otherwise, the packet is forwarded to its destination. Note that it is possible that the packets are re-ordered due to random delay. However, in the network scenario with constant delay or piecewise constant delay, the packets are not re-ordered. Table IV lists the important parameters used for test scenarios. In this table, the contention window determines how long the transmitter must wait before trying a retransmission. For instance, if there is packet loss, the transmitter will wait 1 slot before retransmitting. Next time, it waits 2 slots and then 4 slots afterwards. The contention window will start at the minimum value and keep doubling until the maximum value is reached. The short and long retry limits control the number transmissions that are allowed. One of the two limits is used depending on the size of the packet and the RTS (Request-to-Send) Threshold parameter. The short retry limit is used when a control frame or a short frame is retransmitted. The IEEE 802.11 standard includes an optional feature of the RTS/CTS (request to send or clear to send) function to control station access to the medium when collisions occur due to the hidden node. The RTS/CTS mechanism, which is not used for short packets, is disabled for all the simulations. As shown in Table IV, in the simulation, is set to -83 dBm. This means if a signal is received with power lower than -83 dBm, the signal is then ignored by the receiver. The tested teleoperated system exhibited realistic transmission of contact force from the slave site to the master site (Fig. 9b). The operator was able to feel the scaled environment interaction at the actuator end-effector (which is in range of 0 N and 2100 N) in high fidelity (see Fig. 9). In order to facilitate visual comparison, in Fig. 9b, the master force was scaled by the scaling factor of 1000. As observed in TABLE IV PARAMETERS USED TO EMULATE WIRELESS CHANNEL USING NS2. Parameter Value 1m Reference distance, 2 dbi Transmitting antenna gain, 2 dbi Receiving antenna gain, Channel bandwidth 11 Mbit/s Contention window size 1-31 Short retry limit 2 long retry limit 1 Packet size 50 bits Packet interval 0.2 ms RTS Threshold 10000 (RTS/CTS disabled) -83 dBm Carrier sense threshold,
Displacement (mm)
TII-14-1069
8
150
100
50
Force (N)
(a) Displacements: dashed line: haptic implement, xm; solid line: hydraulic actuator end-effector, xs.
3
2500 2000 1500 1000
500
4
0 0
4
6 1
2
5
3
Time (s)
6
4
8 5
Time (s)
6
77
8
9
8
10
(b) Scaled forces produced by haptic device: Fm (dashed line), and forces applied to the environment: Fs (solid line). Fig. 9. Experimental results pertaining second network scenario.
Fig. 8, the force signal exhibited oscillations as the packet loss increased. In conclusion, according to the experiments, the position and force signals of the teleoperated hydraulic actuator had good tracking for the average round trip delays and average packet losses up to 1000 ms and 40%, respectively. Note that, although the operator was asked to repeat the same movement of free and constrained motions in each trial, deviations from trajectories were unavoidable. By comparing the performance indices at each time (which corresponds to a specific packet loss), it was found that the position signal had the largest fluctuation that exceeded the threshold value of 4 mm. This happened at t ≈ 7.7 s when the packet loss reached 40% (see Fig. 8a). As observed in Figs. 9a and 9b, both position and force signals become more oscillatory for packet losses more than 40%, which was in line with our findings for this typical experiment.
4
Time (s)
marginal (average packet loss is between 20% and 40%), and unacceptable (average packet loss is more than 40%). Note that the acceptable 20% packet loss is assumed conservatively.
slave site
master site
6
D. Constructing charts for hydraulic manipulator The application, for which the performance charts were to be constructed, is robot-assisted live-line maintenance. A set of preliminary studies were performed, in a field trial (see Fig. 10), to study how the physical wireless channel affects the transfer of data in outdoor near energized lines [15]. In this set of tests, the master site was installed inside a van, and a PC was located on top of the bucket of a crane close to a 230kV live line. By moving the van around and blocking the PC, various scenarios of communication channels were generated in terms of distance and obstruction. The distance between the master and slave sites changed from 40 m to 120 m. Results of this study showed that communication delay was below 1000 ms at all time, which does not affect the performance of the tested teleoperated system in practice [6]. However, by increasing the distance or changing the environment obstruction, the packet losses of more than 40% were noticed. We have already established that networks having average packet loss of more than 40% do not guarantee good performance for this system. Thus, three regions are defined: acceptable (average packet loss is less than 20%),
bucket
(a)
master PC
operator
8
slave PC
haptic device
(b) (c) Fig. 10. (a) Experimental field test setup; (b) master site: operator, haptic device, master PC, and wireless router; (c) slave PC.
Using the graphs as in Fig. 2, a lookup table was therefore constructed (Table V). In this table, given a pair of and , the distances at which the network has average packet losses of 20% and 40%, are indicated. For example, consider the middle column of Table II, in which the values of and for =2.7 and =90 mW are obtained as 84.0 m and 95.2 m, respectively (see the shaded area in Table V). The lookup table can also be presented in the form of a set of performance charts shown in Fig. 11. Either Table V or Fig.
9
TII-14-1069
9
11 can be used to select the wireless router antenna transmission power and/or to choose a proper distance between the master and slave sites. For instance, in live-line maintenance tasks, when the slave hydraulic robot works near transmission lines in an environment without any obstacle ( =2) and the lineman controls the robot at a distance of 300 m, in order to have an acceptable quality of tracking, a router with the minimum antenna transmission power of 63 mW should be employed. This is shown in shaded row in the first column of Table V and the solid circle in Fig. 11.
selected from acceptable (A) and marginal (M) regions. No experiment was conducted within the “unacceptable” region, to prevent damage to the experimental test rig. Network scenarios are shown in Table VI. Figure 12 shows variations of packet loss during scenarios S1 to S8. With reference to Fig. 12, a pair of and , the mean value of packet loss increases with the distance between the master and slave sites. In all scenarios, the mean time delays were found less than 1 ms. TABLE VI CHARACTERISTICS OF NETWORK SCENARIOS EXAMINED. ‘A’ AND ‘M’ SHOW THAT THE SCENARIO BELONGS TO ACCEPTABLE OR MARGINAL REGIONS.
V. VALIDATIONS OF PERFORMANCE CHARTS A set of validation tests were performed using the real hydraulic actuator operated as the slave site (see Fig. 4). In total, 10(trials)×2( )×2( )×2( )=80 tests were conducted. The chosen path loss exponents ( ) were 2.3 and 3.0, and the antenna transmission powers ( ) were set to 30 mW and 60 mW. For each pair of and , two distances ( ) were
S1 (A)
S2 (M)
S3 S4 (A) (M)
S5 (A)
S6 (M)
2.3
(dB) (mW) (m)
30 80
100
S7 (A)
S8 (M)
3.0 60 120 140
30 25
60 35
40
45
TABLE V
30 37 43 50 57 63 70 77 83 90
n=2.0
n=2.3
500
200
400
150
300
30 37 43 50 57 63 70 77 83 90
d40% 12.8 13.4 13.9 14.3 14.8 15.2 15.5 15.9 16.2 16.5
30 37 43 50 57 63 70 77 83 90
n=3.0 d20% 35.6 38.1 40.2 42.2 44.0 45.6 47.2 48.7 50.0 51.4 n=4.7 d20% 9.9 10.3 10.7 11.1 11.4 11.6 11.9 12.1 12.3 12.5
n=2.7
A
100
d40% 39.8 42.5 45.0 47.2 49.2 51.0 52.8 54.4 55.9 57.4
30 37 43 50 57 63 70 77 83 90
d40% 10.6 11.1 11.5 11.9 12.2 12.5 12.8 13.0 13.3 13.5
30 37 43 50 57 63 70 77 83 90
n=3.3 d20% 24.9 26.4 27.8 29.0 30.1 31.1 32.1 33.0 33.8 34.6 n=5.0 d20% 8.5 8.8 9.1 9.4 9.6 9.9 10.1 10.2 10.4 10.6
80
A
60
n=3.3
50
U
35
A
40
60
n=3.7
60
P (mW) r
90
A
15 10 30
d (m)
A
16
20
P (mW) r
90
10 30
A 60
P (mW) r
A
20 30
90
60
90
n=5.0
11
12 10 8 30
90
12
U U
12 60
60
14
14
30
n=4.7
18
U d (m)
d (m)
U 25
30 30
90
n=4.3
25
20
60
n=4.0
30
15 30
40 30
90
U
25
d (m)
50 30
90
d (m)
60
d40% 9.1 9.5 9.8 10.1 10.3 10.5 10.8 11.0 11.1 11.3
40
A 200 30
d40% 27.5 29.2 30.7 32.1 33.3 34.4 35.5 36.5 37.4 38.3
n=3.0
60
U d (m)
d (m)
U
d40% 63.1 68.0 72.4 76.4 80.0 83.5 86.7 89.7 92.5 95.2
100
U d (m)
n=2.7 d20% 55.7 60.0 63.9 67.4 70.6 73.6 76.5 79.1 81.6 84.0 n=4.3 d20% 11.8 12.4 12.9 13.3 13.7 14.1 14.4 14.7 15.0 15.2
d (m)
30 37 43 50 57 63 70 77 83 90
ARE GIVEN IN UNITS OF mW AND m, RESPECTIVELY.
AND
d (m)
LOOKUP TABLE OF NETWORK PARAMETERS. n=2.0 n=2.3 d20% d40% d20% d40% 212.7 251.2 30 98.9 114.1 30 235.1 277.8 37 107.8 124.3 37 255.6 302.0 43 115.8 133.5 43 274.6 324.4 50 123.1 142.0 50 292.3 345.3 57 129.9 149.8 57 309.0 365.1 63 136.2 157.1 63 324.9 383.8 70 142.2 164.0 70 340.0 401.7 77 147.8 170.5 77 354.5 418.8 83 153.2 176.7 83 368.4 435.2 90 158.4 182.7 90 n=3.7 n=4.0 d20% d40% d20% d40% 18.5 20.3 30 14.5 15.8 30 19.6 21.5 37 15.3 16.6 37 20.5 22.5 43 15.9 17.3 43 21.3 23.4 50 16.5 18.0 50 22.1 24.2 57 17.0 18.5 57 22.8 24.9 63 17.5 19.1 63 23.4 25.6 70 18.0 19.5 70 24.0 26.3 77 18.4 20.0 77 24.5 26.9 83 18.8 20.4 83 25.1 27.4 90 19.1 20.8 90
A 60
P (mW) r
Bad
U
10
A
9 90
8 30
60
P (mW)
90
r
Fig. 11. Performance charts of the guideline designed to select network parameters. A and U stand for “Acceptable” and “Unacceptable” regions, respectively. Areas between the two curves belong to marginal region. In all charts, the value of σ is set to 4.
40
0 S1 TII-14-1069
20 40 S5 400 20 S1
20 40 0 S5 40 0 S1 20 40 20 S3 400 20 S5 0 20 40 0 S3 40 0 S5 20 40 20 S7 400 20 S3 0 20 40 0 S7 400 0 S3 20 20 4000 0 S7 20
1
2
3
4
5
2
3
4
5
Time (s)
1
Time (s)
S2 20
40 0 S2 20 40 S6 400 20 S2 20 40 0 S6 40 0 S2 20 40 20 S4 400 20 S6 0 20 40 0 S4 40 0 S6 20 40 20 S8 400 20 S4 0 20 40 0 S8 400 0 S4 20 20 4000 0 S8 20
1
2
3
4
5
2
3
4
5
Time (s)
1
Time (s)
Fig.4012. Variations of packet loss over 40 a 5-second period for network 0 S7 described in Table VI. 0 S8 scenarios 0 1 2 3 4 5 0 1 2 3 4 5
150
4
5
S3
100 50 S5
100 50 S7
100 50 0
1
2
3
Time (s)
4
5
2
150
150
150
50 S6
100 50 S8
100 50 0
2
3
4
Fm,s(N) 1
Fm,s(N)
Fm,s(N)
1500 S7 1000 500 0 0
1500 S2 1000 500 0 1500 S4 1000 500 0
Fm,s(N)
Fm,s(N)
1500 S5 1000 500 0
1500 S6 1000 500 0 1500 S8 1000 500 0 0
5
5
S4
Fm,s(N)
Fm,s(N) Fm,s(N)
1500 S3 1000 500 0
4
100
1
Fig. 13. Position of hydraulic actuator end-effector( line)( - ), and haptic device implement, xm (solid line). 1500 S1 1000 500 0
3
Time (s)
50
xm,s(mm)
xm,s(mm) xm,s(mm)
150
xm,s(mm)
50 150
3
xm,s(mm)
2
Time (s)
Time (s)
20 150 S2 0 0 1 100
xm,s(mm)
Time (s)
20 150 0 S1 0 1 100
2
3
Time (s)
4
5
- ), xs (dashed
(%) (%) (%) Loss (%) Loss Loss Loss (%) (%) (%)(%) Loss (%) Loss Loss Loss (%) (%) Loss Loss Loss Loss ( (%) (%) (%) Loss Loss Loss Loss (%)
xm,s(mm) (%) (%) (%) Loss (%) Loss Loss Loss (%) (%) (%)(%) Loss (%) Loss Loss Loss (%) (%) Loss Loss Loss Loss ( (%) (%) (%) Loss Loss Loss Loss (%)
xm,s(mm) (%) (%) (%) Loss (%) Loss Loss Loss (%) (%) (%)(%) Loss (%) Loss Loss Loss (%) (%) Loss Loss Loss Loss ( (%) (%) (%) Loss Loss Loss Loss (%)
S1 20
40 20 60 0 40 20 60 400 60
S03
10
S09
S03
small fluctuations around the actual trajectory were observed S09 20 in40 60 all scenarios. S03 After ensuring the system stability, the 200 60 40 transparency ofS06the system was examined. Figure 13 illustrates 0 40 20 position response of the master haptic device and the 60 the S09 20 400 end-effector. As seen, the responses in both regions are 60 slave 0 S06 20 40 good of position tracking. Figure 14 shows that the 60 in termsS09 200 60 40 force signals, in all scenarios, also had good tracking. In S12 0 40 20 60 general, the results validated the effectiveness of using the S06 20 0 40 60 charts, constructed based on our approach for wireless control 0 S12 20 of40 hydraulic manipulators. 60 S06 0 20 1 400 60 0 20 40 VI. 20 6000 1 A.400 Future
2
3
Time (s)
4
5
CONCLUDING REMARKS AND FUTURE WORK S12
2 3 4 5 directions Time (s) S12 20The intended application in this paper was to perform live60 0 maintenance. Nevertheless, the proposed approach can be line 1 2 3 4 5 400 (s) extended toTime any bilateral teleoperated system working under a 20 wireless communication channel. The three network 0 0 1 2 3 4 5 parameters, Time identified during the field trial, could arguably (s) reflect the need for the live-line maintenance application. However, other interesting network parameters could be included in performance charts in future studies. Future work will also focus on experimenting the existing master/slave setup under actual wireless communication in real field.
B. Significance Overall, this paper which is believed to make a further contribution to the development of techniques for teleoperated control of manipulators operating under a wireless communication channel, showed that the proposed approach of setting the network parameters is practical, can lead to effective utilization of the system, and could be considered as an approach to set up wireless channels in outdoor applications. Understanding the network parameters in a teleoperated system can also have considerable implications in establishing wireless communication channel connecting the slave and the master sites. A database of network parameters could also provide a benchmark for performance of teleoperated tasks such as live-line maintenance from distance. VII. CONCLUSIONS
1
2
3
4
5
Time (s) Time (s) Fig. 14. Scaled force produced by haptic device: Fm (dashed line), and actual force generated by the hydraulic actuator: Fs (solid line). A factor of 1000 was considered to plot the haptic forces.
Validation of the constructed performance charts (Fig. 11 and Table V) was done under 8 network parameters chosen within the acceptable (S1, S3, S5 and S7) and marginal (S2, S4, S6 and S8) regions (see Table VI). In all scenarios, the performance of the system was investigated using six defined performance indices. According to the results, the system was observed stably under all tested network scenarios; however,
In this paper, a technique was proposed to select appropriate parameters of a wireless network setup connecting the master and slave sites of a teleoperated manipulator. Performance evaluations were based on performance measures to quantify the quality of position tracking of the slave manipulator endeffector, and force tracking of the master haptic device. A set of performance charts were constructed to select proper antenna transmission power of the router and distance between the master and the slave sites. Three performance indices were applied to both position and force signals to determine the regions representing the quality of tracking. The technique was implemented on a setup comprising a PHANToM Omni haptic device, and a valve-controlled hydraulic actuator. The indices were defined to investigate the performance of the tested system: the integral of squared errors, the integral of absolute error, and the amplitude of overshoot. The indices helped us define three regions, namely acceptable, marginal,
TII-14-1069
11
and unacceptable. Each region allows different combinations of path loss exponent, antenna transmission power, and distance between the master and the slave sites. Results confirmed satisfactory performance in environments with and without obstructions when the network was located within the recommended regions. REFERENCES [1]
[2]
[3]
[4]
[5]
[6]
[7]
[8]
[9]
[10]
[11]
[12]
[13] [14]
[15]
[16]
S. Islam, P. X. Liu, E. Saddik A., and Y. B. Yang, "Bilateral control of teleoperation systems with time delay," IEEE/ASME Trans. on Mechatronics, vol. 20, no. 1, pp. 1-12, 2015. A. M. Ousaid, D. S .Haliyo, S. Regnier, and V. Hayward, "A stable and transparent microscale force feedback teleoperation system," IEEE/ASME Transactions on Mechatronics, vol. 20, no. 5, pp. 25932603, 2015. B. Hannaford, "Stability and performance tradeoffs in bi-lateral telemanipulation," in Proc. of IEEE Int. Conf. on Robotics and Automation, vol. 3, 1989, pp. 1764-1767. E. J. Rodriguez-Seda, D. Lee, and M. W. Spong, "Experimental comparison study of control architectures for bilateral teleoperators," IEEE Trans. on Robotics, vol. 25, no. 6, pp. 1304-1318, 2009. C. A. Lopez Martinez, I. Polat, R. van de Molengraft, and M. Steinbuch, "Robust high performance bilateral teleoperation under bounded timevarying dynamics," IEEE Transactions on Control Systems Technology, vol. 23, no. 1, pp. 206-218, 2015. Y. Maddahi, R. A. Rahman, W. K. Fung, and N. Sepehri, "Effect of network quality on performance of bilateral teleoperated hydraulic actuators: a comparative study," Journal of Control and Intelligent Systems, vol. 41, no. 1, pp. 11-25, 2013. K. Zarei-Nia, A. Y. Goharrizi, N. Sepehri, and W. K. Fung, "Experimental evaluation of bilateral control schemes applied to hydraulic actuators: a comparative study," Trans. of the Canadian Society for Mechanical Engineering, vol. 33, no. 3, pp. 377-398, 2009. G. Matz and F. Hlawatsch, Fundamentals of Time-varying Communication Channels, Wireless Communications over Rapidly Time-Varying Channels, Eds. Franz Hlawatsch and Gerald Matz, Amsterdam, The Netherlands: Academic Press, pp. 1–63, 2011. A. Suzuki and K. Ohnishi, "Frequency-domain damping design for timedelayed bilateral teleoperation system based on modal space analysis," IEEE Trans. on Industrial Electronics, vol. 60, no. 1, pp.177190, 2013. D. Tian, D. Yashiro, and K. Ohnishi, "Wireless haptic communication under varying delay by switching-channel bilateral control with energy monitor," IEEE/ASME Trans. on Mechatronics, vol. 17, no. 3, pp. 488– 498, 2012. S. Yifeng, W. Hongguang, and Z. Jianwei, "A vision-based broken strand detection method for a power-line maintenance robot," IEEE Trans. on Power Delivery, vol. 29, no. 5, pp. 2154-2161, 2014. Y. Maddahi, K. Zareinia, N. Sepehri, T. Olson, and W. Mueller, "Liveline maintenance training using robotics technology," in IEEE World Haptics Conf., Korea, 2014, pp. 587-592. T. Issariyakul and E. Hossain, Introduction to Network Simulator NS2, Springer, 2009. I. Elhajj, N. Xi, W. K. Fung, Y. H. Liu, W. J. Li, T. Kaga and T. Fukuda, "Haptic information in Internet-based teleoperation," IEEE/ASME Trans. on Mechatronics, vol. 6, no. 3, pp. 295-304, 2001. Y. Maddahi, N. Sepehri, S. Liao, W. K. Fung, and E. Hossain, "Wireless control of a teleoperated hydraulic manipulator with application towards live-line maintenance," in Proc. of ASME/BATH Symposium on Fluid Power and Motion Control, 2013, Florida, USA. P. Prokopiou, S. Tzafestas and W. Harwin, "A novel scheme for humanfriendly and time-delays robust neuropredictive teleoperation," Journal of Intelligent and Robotic Systems: Theory and Applications, vol. 25, pp. 311-340, 1999.
[17] S. Ivanov, A. Herms, and G. Lukas, "Experimental validation of the NS2 wireless model using simulation, emulation, and real network," in Proc. of ITG-GTI Conference on Communication in Distributed Systems, 2007, pp. 1-12. [18] D. Kotz, C. Newport, R. Gray, J. Liu, Y. Yuan, and C. Elliott, "Experimental evaluation of wireless simulation assumptions," in Proc. of the ACM Int. Symp. on Modeling, Analysis and Simulation of Wireless
and Mobile Systems, 2004, pp. 78–82. [19] T. Rappaport, Wireless Communications: Principles and Practice, Prentice Hall, 2002. [20] M. Karpenko, N. Sepehri, and J. Anderson, "Decentralized coordinated motion control of two hydraulic actuators handling a common object," Journal of Dynamic Systems, Measurement and Control, vol. 129, pp. 729-741, 2007. [21] H. E. Merritt, Hydraulic Control Systems, NY: John Wiley, 1967. [22] N. Niksefat, N. Sepehri, and Q. Wu, "Design and experimental evaluation of a QFT contact task controller for electro-hydraulic actuators," Int. Journal of Robust and Nonlinear Control, vol. 17, pp. 225-250, 2007. [23] L. Márton, S. Fodor, and N. Sepehri, "A practical method for friction identification in hydraulic actuators," Journal of Mechatronics, vol. 21, pp. 350–356, 2011. [24] M. Jerouane, N. Sepehri, and F. Lamnabhi-Lagarrigue, "Dynamic analysis of variable structure force control of hydraulic actuators via the reaching law approach," International Journal of Control, vol. 77, pp. 1260-1268, 2004. [25] L. Repele, R. Muradore, D. Quaglia, and P. Fiorini, "Improving performance of networked control systems by using adaptive buffering," IEEE Trans. on Industrial Electronics, pp. 4847-4856 vol. 61, no. 9, 2014.
Yaser Maddahi received his BSc and MSc in Mechanical Engineering and Biomedical Engineering in 2001 and 2003, respectively. He obtained his PhD degree in Mechanical Engineering from the University of Manitoba, Canada in 2013. He was an Eyes High postdoctoral fellow in Department of Clinical Neurosciences at University of Calgary and a visiting academic scholar in Department of Mechanical Engineering at the University of Manitoba. He is currently a Postdoctoral Killam Laureate at University of Calgary. The research interests of Dr. Maddahi include surgical robotics, MRcompatible haptic devices, networked robotics, and humanmachine interaction.
Stephen Liao received his B.Sc. degree and M.Sc. degree in Computer Engineering from the University of Manitoba in 2009 and 2013, respectively. He became a member of IEEE in 2009. His research interests include networked robotics and image processing.
Wai-Keung Fung (S’09) obtained his Ph.D. from the Department of Automation and Computer Aided Engineering at the Chinese University of Hong Kong in 2001. He has held postdoctoral positions at the Michigan State University and the Chinese University of Hong Kong. From 2005-2012 he was an Assistant Professor at the University of Manitoba. Currently he is a faculty member at the School of Engineering, Robert Gordon University, Scotland, United Kingdom. The research interests of Dr. Fung include intelligent robotics, networked
TII-14-1069 robotics, computational intelligence and human-machine interaction. He has been elevated to IEEE Senior Member since 2009.
Ekram Hossain (F'15) is a Professor (since March 2010) in the Department of Electrical and Computer Engineering at University of Manitoba, Winnipeg, Canada. He received his Ph.D. in Electrical Engineering from University of Victoria, Canada, in 2001. Dr. Hossain's current research interests include design, analysis, and optimization of wireless/mobile communications networks, cognitive radio systems, and network economics. He has authored/edited several books in these areas. Dr. Hossain serves as the Editor-in-Chief for the IEEE Communications Surveys and Tutorials} and an Editor for IEEE Wireless Communications. Also, he is a member of the IEEE Press Editorial Board. Previously, he served as the Area Editor for the IEEE Transactions on Wireless Communications in the area of “Resource Management and Multiple Access” from 2009-2011, an Editor for the IEEE Transactions on Mobile Computing from 2007-2012, and an Editor for the IEEE Journal on Selected Areas in Communications - Cognitive Radio Series from 2011-2014. Dr. Hossain has won several research awards including the University of Manitoba Merit Award in 2010 and 2014 (for Research and Scholarly Activities), the 2011 IEEE Communications Society Fred Ellersick Prize Paper Award, and the IEEE Wireless Communications and Networking Conference 2012 (WCNC'12) Best Paper Award. He was elevated to an IEEE Fellow for spectrum management and resource allocation in cognitive and cellular radio networks. Dr. Hossain is a Distinguished Lecturer of the IEEE Communications Society (2012-2015). He is a registered Professional Engineer in the province of Manitoba, Canada.
Nariman Sepehri is a professor with the Department of Mechanical Engineering, at the University of Manitoba, Canada. He received M.Sc. and Ph.D. degrees from the University of British Columbia, Canada. His research and development activities are primarily centered in all fluid power related aspects of systems, manipulation, diagnosis and control.
12