May 7, 2015 - 36 Avenue Guy de Collongue, 69134 Ecully, France. ABSTRACT. This paper presents a self-consistent multi-arcs dynamic model for high ...
IEEE Transactions on Dielectrics and Electrical Insulation
Vol. 23, No. 5; October 2016
2899
Self-Consistent Multi-arcs Dynamic Model for High Voltage Polluted Insulators N. Dhahbi-Megriche University of Carthage, Institute of Applied Sciences and Technology (INSAT), MMA Research Lab, Centre Urbain Nord, BP, No. 676,1080 Tunis Cedex, Tunisia and A. Beroual Ecole Centrale de Lyon, University of Lyon, Ampere CNRS UMR 5005, 36 Avenue Guy de Collongue, 69134 Ecully, France
ABSTRACT This paper presents a self-consistent multi-arcs dynamic model for high voltage polluted insulator under impulse voltage. This model is an improvement of that one developed for single arc; it is based on an electrical equivalent circuit consisting of a series of different partial arcs and residual layer resistance. It takes into account the configuration of insulator, applied voltage polarity and the instantaneous changes of discharges parameters. The proposed model enables to compute the flashover voltage and leakage current and to show the influence of dry bands on the voltage distribution along the surface and furthermore on the electrical performance of polluted insulator. It is validated using a simple plane model in the case of uniform and non-uniform polluted bands. The computed flashover voltage and leakage current are found in good agreement with those measured experimentally. Index Terms - Self-consistent multi-arcs dynamic model, high voltage polluted insulators, impulse voltage, flashover voltage, leakage current.
1
INTRODUCTION
MANY mathematical and physical models have been proposed to explain the mechanism and predict the flashover voltage of polluted insulators [1-4]. As far as models for predicting the flashover voltage of polluted insulators are concerned, both static [1, 5] and dynamic [6-8] mathematical models have been developed to simulate flashover on polluted insulators. The static models are based on Obenaus’s model, the flashover of insulator being assumed to an arc in series with a residual resistance consisting of the polluted layer unabridged by the arc. Based on arc constants and pollution conductivity, one can get the characteristics of the arc at its critical length that leads to flashover. While the dynamic model adopts a dynamic approach based on the physical processes constituting the phenomena; the arc is considered as a time-dependent impedance and the flashover process is simulated by a steps development. This model can be used to predict the critical flashover voltage and leakage current, arc velocity and flashover time [8]. To simplify the study, both static and dynamic models assume that there is a single dominant arc on insulator surface whereas a large number of investigations carried out in field and in laboratory showed that several local discharges would take place on the insulator surface in the same time [9-11]. Indeed, when a contaminated and wetted insulator is submitted to a voltage, a resistive Manuscript received on 7 May 2015, in final form 23 May 2016, accepted 27 June 2016.
leakage current arises; this latter is generally many orders of magnitude higher than the capacitive one that flows through the dry insulator surface. The leakage current leads to the evaporation (Joule effect) of humidity and the formation of multiple thin dry bands on the insulator surface at the edges of which the electric field will be enhanced. When the field reaches a critical value that is the ionization electric field of surrounding ambient air, arcs discharges occur. The formation and development of these partial arcs lead, under specific conditions, to the flashover of the insulator surface. Many attempts have been made to improve the existing models by introducing the multi-arcs concept [10, 12] to predict roughly the critical characteristics of polluted insulators. Most of these models relate to DC or AC voltage whereas there are only few models for flashover under impulse voltages (switching or lightning voltages); this being of great interest for sizing/design the transmission lines. Lighting is the most severe constraints to which are exposed insulators even under light pollution conditions. The lightning impulse voltage used for tests in laboratory is the standard wave-shape 1.2/50 µs (according to IEC 60060). The main purpose of this paper is the developing of a multiarcs model for predicting the behavior of polluted insulator under impulse voltage and to investigate the influence of the pollution configuration, the voltage polarity and the resistivity of the pollutant on the flashover voltage and the leakage current.
DOI: 10.1109/TDEI.2016.005392
2900
2
N. Dhahbi-Megriche and A. Beroual: Self-Consistent Multi-arcs Dynamic Model for High Voltage Polluted Insulators
MULTI-ARCS MODEL DESCRIPTION 2.1 BASIS OF THE MODEL
The coexistence of several partial arcs on polluted insulator and their growth until a complete flashover has been reported by many researchers [9-11]. In this work, a flat insulator with n dry bands in series with m polluted bands is used to study the influence of multi-arcs (Figure 1a). The corresponding equivalent electrical circuit is given in Figure 1b. Each band (dry or polluted) of xi length is described by Ri Ci cell; Vap is the applied voltage. The voltage and the current are governed by the following equations ,
(1) ,
(2)
Vi, Ii, Ri, and Ci are respectively the potential, the current, the resistance and the capacitance in the band number i.
an inherent negative charge, are accelerated towards the positive electrode. Thus, the hypothesis that considers ionization processes and avalanche mechanisms as responsible for partial arc from electrode appears to be valid as reported by Slama [13, 14]. According to these authors, partial arcs can occur at the high voltage electrode and at the ground electrode even if there are no dry bands in front of this electrode. The model used by Slama et al [13, 14] consists of 2 dry bands and 2 polluted bands (Figure 3a). With the assumption that partial arcs are already established over each dry band and from electrode end, this model can be equivalently split into two parts as shown in Figure 3b; arc1 refers to the partial arc developing from the 1rst electrode end with an arc length x1; arc2 is the partial arc developing from the middle dry band in the direction of the first electrode with an arc length x2; arc3 is the partial arc developing also from the middle dry band but in the direction of the second electrode with an arc length x3; and arc4 is the partial arc developing from the 2nd electrode end with an arc length x4.
(a)
(a)
(b) Figure 1. Model used for the analysis of insulator with multiple polluted and dry bands (a) and Equivalent electrical circuit (b).
The influence of pollution deposit distribution, polarity of applied voltage and conductivity of the pollutant on the morphology and electrical signals of discharges developing over a polluted flat insulator has been investigated in previous work [13, 14]. It was observed that partial arcs occur at the high voltage end, the ground end and on dry bands (Figure 2).
Figure 2. Morphology of local discharges on discontinuous plane insulator model [14].
Partial arcs observed at electrodes are due to the formation of electron avalanches that occur when the intensity of the electric field at these electrodes exceeds a certain critical value. The electrons in the air near electrode surface are accelerated by the electrostatic field. These electrons, having
(b) Figure 3. Insulator model with 2 polluted bands and 2 dry bands (a) and equivalent model (b).
This model can be represented by a simple electrical equivalent circuit consisting of 4 arcs in series with electrical resistances corresponding to the polluted insulator bands (Figure 4).
Figure 4. Electrical equivalent model of the polluted insulator.
For each arc, one assumes that there is one point on the pollution layer where the current lines are concentrated. In that case, the flashover of polluted insulator should be accounted for by the multi-arcs model in which each arc channel is assumed to a cylinder channel of radius ri and length xi that remains in contact with the insulator surface during its propagation. This
IEEE Transactions on Dielectrics and Electrical Insulation
Vol. 23, No. 5; October 2016
channel is represented by RC cell. Both Rp1 and Rp2 are the residual resistances of the polluted bands B1 and B2 unabridged by the arcs. Li, Vap, Vi, If are respectively the length of the polluted band Bi, the applied voltage, the voltage drop in the polluted band number i, and the leakage current. The voltages in the different cells of the electrical equivalent model are governed by the following equations ,
,
∑
,
, (3)
,
,
,
∑
,
(4) ,
,
,
,
∑
,
,
(5) ,
,
,
The extracted equations can be presented in matrix form
1
1
0 0 0 1
0
1
0
0
0
0 0 0
0 0 1
2.2.2 THE CAPACITANCE OF THE ARC The capacitance Ci at the head of each arci can be computed using a spherical approximation [15]: ∑
4
(10)
Where cosh
(11)
cosh
(12)
cosh
(13)
cosh
(14)
Lf is the total leakage length of insulator, L1 and L2 are the lengths of the polluted bands, xi is the local arci length and ri is the radius (in cm) of the discharge channel. The discharge radii are supposed to have the same initial value only in the beginning of computation. Since the current is different for each cell, the discharge channel radii will be also computed according to Wilkins model [18].
, (6)
0 0 0
2901
(7)
1
r
.
(15)
2.2.3 THE RESISTANCES OF THE POLLUTED BANDS The insulator geometry being very complex, it is difficult to express the resistance of the polluted band by a simple equation. In the considered model, Wilkins [19] equation is used. This equation that takes into account the constriction of current at the arc foot gives good results. For a narrow polluted band, where the width of the polluted layer is shorter than its length, both resistances Rp1 and Rp2 of polluted bands can be represented by: (16)
This may be written as a state space representation
(17) (8)
Where A is the state matrix, B is the input matrix, X is variables of voltage and U is inputs. 2.2 CIRCUIT PARAMETERS The circuit parameters Rpi, Ri and Ci, are calculated by taking into account the geometry of the considered insulator [15]: 2.2.1 THE RESISTANCES OF ARCS The arc resistance being non-linear, therefore to describe its dynamic behavior, Mayr’s equation [16] is used such us: 1
(9)
Where Ri, is the arc resistance, the arc time constant, Nc the static arc constant [17], and Ii the current.
Where i is the pollution surface conductivity of the band Bi and a is its width. When propagating on the insulator surface, the different arcs can elongate differently. So a given polluted band can be bridged before the other; this depends on the voltage polarities and the initial conductivities of polluted bands. Therefore, the topology of the equivalent electrical model must be changed. For our model, two cases have to be considered: If the polluted band B1 is firstly bridged, the new configuration of the electrical equivalent circuit will be as shown in Figure 5a and If the polluted band B2 is the firstly bridged, the configuration will be that shown in Figure 5b. For every configuration, the equations introduced above must be accordingly modified. The resolution of the state equation leads to the calculation of voltages and currents for each cell and the deduction of the leakage current.
2902
N. Dhahbi-Megriche and A. Beroual: Self-Consistent Multi-arcs Dynamic Model for High Voltage Polluted Insulators
temporal evolution of discharge (arc) propagating over polluted insulator (current and electrical charge, discharge length, potential, discharge propagation velocity, resistance of discharge channel and time to flashover). (a)
(b) Figure 5. New configurations of the electrical equivalent circuit; (a) Polluted band B1 bridged, (b) Polluted band B2 bridged.
2.3 IMPULSE VOLTAGE Under impulse voltage, the formation of partial discharges occurs almost instantaneously in a fraction of microsecond. The elongation of these partial discharges depends on the magnitude and the rate of rise of the applied voltage. If the voltage is high enough to develop a leader channel which crosses the gap, breakdown will occur. The formation of the leader channel is the main criterion for flashover of the gap. The applied voltage that we consider is a bi-exponential wave simulating lightning and switching impulse voltages. A mathematical expression for such a voltage is ௧
௧
்ೌ
்್
ܸሺݐሻ ൌ ܸ ቂ݁ݔሺെ ሻ െ ݁�ݔሺെ
ሻቃ
(18)
where Vo, Ta and Tb are respectively the crest voltage and the time constants [20]. 2.4 COMPUTATION STEPS The initial conditions of the system such as the pollution conductivity, the applied voltage, the insulator configuration, the polluted bands number and the initial arcs length must be inputted. The different circuit parameters are first computed and then the propagation criterion is tested. If the criterion is not satisfied, the applied voltage is incremented or else the discharge propagates. Now, if one of the initial polluted bands is bridged then the topology of the circuit must be changed and the above steps are repeated until the total arcs length is equal to the critical leakage length. So the critical conditions are reached and the flashover occurs. This computation is repeated for every pollution severity. Figure 6 shows the flowchart of the computer program enabling to compute the dynamic flashover voltage.
3 VALIDATION OF THE PROPOSED MODEL The model presented above is computed using a Matlab package developed in previous work for single arc propagation [15, 20, 21]. This model is improved here to take into account the new configuration with multi-arcs presence. This package allows us to predict the flashover voltage and to compute the different characteristic parameters of the
Figure 6. Flawchart of the mult-arcs dynamic model.
To validate the proposed model, our simulated results are compared to those obtained experimentally by Slama et al [13, 14]. For that purpose, we consider an insulator model with the same parameters, submitted to the same voltage (i.e., a lightning impulse voltage: 1.2/50 µs), as that used by these authors. The insulator model consists of a rectangular channel made of PVC (Figure 3) composed of 2 polluted bands and 2 dry bands (Table I). The pollution consists of a simple electrolyte (NaCl +H2O) with a conductivity ranging 10µS/cm to 500 µS/cm. 3.1 THE LEAKAGE CURRENT The leakage current is widely used as a tool to monitor and to investigate the pollution site, the surface electrical activity (partial discharges, arcs and flashovers) and overall the performances of insulators of various high voltage equipment whether in lab or outdoor conditions. Thus, the knowledge of the leakage current flowing through a given insulator surface provides information about the pollution severity of insulator and flashover [22-24].
IEEE Transactions on Dielectrics and Electrical Insulation
Vol. 23, No. 5; October 2016
Measured Current
2903 Computed Current
(1) Negative Polarity
(2) Positive Polarity (a) Case of uniform pollution layer for 250µS/cm
(3) Negative Polarity
(4) Positive Polarity (b) Case of Non uniform pollution layer: Configuration A
(5) Positive Polarity
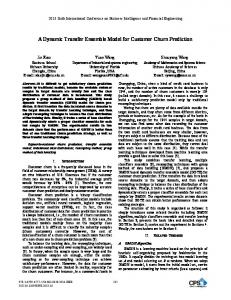
(6) Negative Polarity (c) Case of Non uniform pollution layer: Configuration B Figure 7. Comparison of measured and computed leakage current under positive and negative polarities for: (a) case of uniform pollution layer, (b) case of Non uniform pollution layer: Configuration A and (c) case of Non uniform pollution layer: Configuration B.
2904
N. Dhahbi-Megriche and A. Beroual: Self-Consistent Multi-arcs Dynamic Model for High Voltage Polluted Insulators
The same characteristics of the applied voltage (crest value, time constants and period) used in the experimental study are introduced in the package program to compute the leakage current for uniform and non-uniform pollution deposits in order to investigate the insulator behavior under voltage constraint fixed by the operator. Insulator leakage length lf 110 cm
Table1. Insulator parameters. Polluted Dry Insulator Polluted band band width b band length length length L2 S1 L1 4 cm 4.5 cm 4.5 cm 1 cm
Dry band length S2 1 cm
3.1.1 UNIFORM POLLUTION LAYER In this case, both polluted bands B1 and B2 of the insulator model have the same conductivity that is 250µS/cm. According to the proposed electrical equivalent model, the voltage polarity is taken into account by changing the direction of the discharges propagation. Figure 7a depicts the measured and computed instantaneous leakage current for negative and positive polarity respectively for a given applied voltage. The leakage current waveform presents different stages: (i) an initiation of a discharge during the rise time of the applied voltage in which the current increases rapidly with high density of pulses; (ii) a stabilization of the current that is longer and corresponds to the propagation of discharge in which the current increases almost on a regular basis with a slope more or less pronounced, while the applied voltage declining slowly; (iii) the appearance of a second discharge corresponding to current call and the connection of two successive discharges; and iv) a very fast and sudden increase of the current announcing the flashover [13, 20]. In a previous work [21], we developed a dynamic model of discontinuously polluted insulator. In this model, the pollution layer consists of different bands with different conductivities but with a single pre-established arc always initiated at HV electrode.
Figure 8. Comparison of the measured and computed critical leakage current for different pollution conductivities under positive and negative polarities.
Figure 8 gives the critical leakage current values provided by the multi-arcs model, the single arc model and those obtained experimentally for both polarities and for different pollution conductivities in the case of uniform pollution configuration. It can be observed that the predicted values of
the multi-arcs model are in good agreement with the experimental ones. Note that the critical leakage current corresponds to the maximal value of the current obtained when the applied voltage equals to the flashover voltage. 3.1.2 NON-UNIFORM POLLUTION LAYER The description of the non-uniformity of the pollution deposit is delicate and complex while this case is more representative of the realistic situation (i.e., real outdoor conditions). To validate our model for the case of non-uniform pollution, an insulator sample as presented above (2 dry bands and 2 polluted bands) is used. Two different conductivities are considered [13]: a polluted band with a given conductivity, the other is only wetted. Both configurations A and B used are as shown in Figure 9. a) Configuration A: This case corresponds to a polluted band (with a conductivity of 100 µS/cm) at the high voltage electrode and a wet band (with a conductivity of 5 µS/m) at the grounding electrode (Figure 9a). The leakage current waveforms for negative and positive polarity are shown in Figure 7b.
(a)
(b) Figure 9. Non-uniform pollution model: (a) Configuration A, (b) Configuration.
b) Configuration B: This case corresponds to a wet band (with a conductivity of 5 µS/m) at the high voltage electrode and a polluted band (with a conductivity of 10 µS/cm) at the grounded electrode (Figure 9b). Figure 7c depicts the leakage current waveforms for both negative and positive polarities. Similarly, the leakage current waveforms computed with the multi-arcs model elaborated are in a good agreement with those measured experimentally. The leakage current values clearly indicate that partial pollution of insulator surface in the vicinity of electrodes (Configuration A) is more harmful to the polluted insulators than the uniform surface pollution, whatever the polarity (Figure 7b). According to many researchers [24-27], excessively high stresses occur at the junction of two different surface conductivities for non-uniform surface pollution. Partial pollution of the insulator surface near the electrodes causes higher stresses than those in the case of uniform pollution. Extremely high stresses occur at the edges of dry bands; these
IEEE Transactions on Dielectrics and Electrical Insulation
Vol. 23, No. 5; October 2016
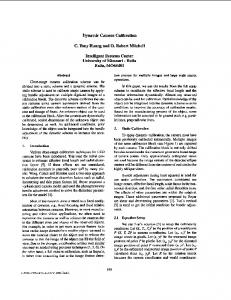
mainly depend on the width dry strips but much less their location. For a given surface resistivity, the stresses are higher in the case of switching impulse voltages than in that of lightning ones. However, power frequency voltage of the same amplitude gives rise to the highest stresses. Despite the fact that the experimental and numerical current shapes seem to be very similar, their magnitudes are different, especially in stage ii. This can be explained by the fact that under impulse wave, only a portion of the pollution layer engages conduction and the breakdown phenomenon takes place practically in the air [14, 20]. Slama [14] refers to the effective thickness of the deposit which is proportional to the resistivity of pollution; it increases with increasing values of the pollution resistivity. This author has argued that the effective thickness involves an effective resistance superior to the real resistance of pollution layer regardless of the polarity of the HV electrode. This results in a measured leakage current lower than computed by the dynamic model in which one considers the real resistances of polluted bands and not the effective one. 3.2 FLASHOVER VOLTAGE The flashover performance of polymeric insulators under impulse voltages has been investigated for the last couple of decades and various conclusions have been put forward for different insulating materials [28-31]. So, it has been reported that charge accumulation on the insulator surface can vary due to the change in the electrical parameters like magnitude, polarity and time duration of the applied voltage and due to the environmental factors like humidity, pressure and temperature [29-31]. The change of any of these parameters can alter the charge magnitude and its distribution along the surface, so as a consequence change the electric field and thus the flashover voltage. As previously indicated, when submitting a polluted insulator to a critical value of voltage, several local discharges appear at its surface. Thus to predict the flashover voltage, it is more appropriate to use multi-arcs model. According to the flow chart of the proposed model, the voltage will be increased up a value that leads to the flashover; this value will be the flashover voltage. And the maximal value of the current corresponding to this voltage will be the critical leakage current. To verify the validity of the proposed model, the simulated results are compared with the experimental ones reported by Slama [13] for the case of insulator model with 2 dry bands and 2 uniformly polluted bands. Figure 10 shows the flashover voltage values provided by the multi-arcs model, the single arc model and those obtained experimentally for both polarities and for different pollution conductivities. One observes that the numerical results of flashover voltage given by the multiarcs model are found in good agreement with the experimental ones. An increase of flashover voltage with the electrolyte conductivity is observed. And, the value for positive polarity is lower than that with negative polarity as reported by other researchers [14, 25, 29-31]. This is due to the fact that the discharges mechanism is similar to that one in air. Indeed, the electric field at the edges of dry bands being higher than that within polluted bands (wet bands), initiate discharges at the
2905
air/insulator interface (i.e., dry bands); and the partial arcs propagate mainly in air. And it is well known that in air, the positive breakdown voltage is lower than the negative one. Thus, the flashover voltage for positive polarity is lower than for negative polarity.
Figure 10. Comparison of the measured and computed flashover voltage for different pollution conductivities under positive and negative polarities.
3.3 COMPARAISON WITH THE SINGLE ARC MODEL To highlight the accuracy of the multi-arcs model, the flashover voltage and the critical leakage current are computed both by the single and the multi-arcs models, for different pollution conductivities. Figures 11 and 12 give the discrepancy of each model with respect to the experimental results reported by Slama [14] for flashover voltage and critical leakage current, respectively. One notes that the discrepancy decreases when the pollution resistivity increases. The flashover voltage computed using the proposed multi-arcs model presents an average discrepancy of 6% and 5.4% for positive and negative polarities, respectively. While those obtained by the single arc model present an average discrepancy of 21 and 28% for positive and negative polarities, respectively.
Figure 11. Flashover voltage discrepancy vs. the pollution conductivity.
As concerns the critical leakage current, the proposed multi-arcs model presents an average discrepancy of 10% and 11.6% for positive and negative polarities, respectively. And those obtained by the single arc model shows an average discrepancy of 28 and 20%, for positive and negative polarities, respectively. The above results evidence the accuracy of the multi-arcs model. On the other hand, the
2906
N. Dhahbi-Megriche and A. Beroual: Self-Consistent Multi-arcs Dynamic Model for High Voltage Polluted Insulators
computed critical currents are different and higher than the measured ones. It appears from the obove results, that the current do not enter all the cross section of pollution. One can suppose that only a part of this section contributes to the conduction phenomena at the interface as predicted in previous work [20].
[8] [9] [10] [11] [12] [13]
[14]
[15] [16] [17] Figure 12. Critical leakage current discrepancy vs. the pollution conductivity.
4 CONCLUSIONS A multi-arcs dynamic model for predicting the behavior of polluted insulator has been developed and validated for a flat insulator model, for different configurations of pollution deposit under impulse voltage. The simulated flashover voltage and leakage current given by our model were found in a good accordance with those obtained experimentally. The proposed multi-arcs model offers great advantages compared to the existing single arc models since it corresponds better to the real behavior of polluted insulators. It can also provide a powerful tool to predict the flashover voltage. It showed that the accuracy of the multi-arcs model is better than the single arc one. Note that this work was performed on a simple insulator model (flat insulator). It would be interesting to validate the developed model on real insulators of different shapes and made of different materials, and to investigate the influence of thickness of pollution layer on the flashover voltage.
[18] [19] [20] [21]
[22]
[23] [24]
[25] [26]
REFERENCES [1] [2] [3] [4] [5]
[6] [7]
F.A.M. Rizk, “Mathematical models for pollution flashover”, Electra, Vol. 78, pp. 71-103, 1981. D.C. Jolly, “Physical Process in the Flashover of Insulators with Contaminated Surfaces”, PhD thesis MIT, USA, 1971. L. L. Alston and S. Zoledziowski, “Growth of discharges on polluted insulation”, Proc. IEE, Vol. 110, No. 7, pp. 1260-1266, 1963. B. F. Hampton, “Flashover mechanism of polluted insulation”, Proc. IEE, Vol. 111, No. 5, pp. 985-990, 1964. M. El-A. Slama, A. Beroual and H. Hadi, “Analytical computation of discharge characteristic constants and critical parameters of flashover of polluted insulators”, Trans Dielectr. Electr. Insul., Vol. 17, No. 6, pp. 1764-1771, 2010. S. Anjana and C. S. Lakshminarasmha, “Computed of flashover voltages of polluted insulators using dynamic arc model”, Int’l. Sympos. High Voltage Eng., New Orleans, USA, Paper 30.09, 1989. R. Sundararajan and R.S. Gorur, “Dynamic arc modelling of pollution flashover of insulators under dc voltage”, IEEE Trans. Elect. Insul., Vol. 28, pp. 209-219, 1993.
[27]
[28] [29] [30]
[31]
N. Dhahbi-Megriche and A. Beroual, “Flashover dynamic model of polluted insulators under AC voltage”, IEEE Trans. Dielectr. Electr. Insul., No. 2, Vol. 7, pp. 283-289, 2000. F. A. M. Rizk and D. H. Nguyen, “Digital simulation of source insulator interaction in HVDC Pollution Tests”, IEEE Trans. Power Delivery, pp. 405-410, 1988. T.C. Chen and H.I.M. Nour, “A Study on the profile of HVDC insulators”, IEEE Trans. Electr. Insul., Vol. 24, No. 1, pp. 113-117, February 1989. P. Zmajkovic, “Modélisation du contournement electrique et validation expérimentale du mécanisme proposé pour l’extension de la décharge”, Thèse de l’Université Paul Sabatier, Toulouse, 1996. S. Taheri, M. Farzaneh and I. Fofana, “Improved dynamic model of DC arc discharge on ice-covered post insulator surfaces”, IEEE Trans. Electr. Insul., Vol. 21, No. 2, pp. 729-739, 2014. M. El-A. Slama, A. Beroual and H. Hadi, “The effect of discontinuous non uniform pollution on the flashover of polluted insulators”, Int’l. Conf. on High Voltage Eng.and Application, Shanghai, China, pp. 246249, 2012. M. El-A. Slama, “Etude expérimentale et modélisation de l’influence de la constitution chimique et de la répartition de la pollution sur le contournement des isolateurs haute tension”, Thèse de l’Ecole Centrale de Lyon, N° d’ordre : ECL, 2011-23, 2011. N. Dhahbi-Megriche, W. Arfaoui and A. Beroual, “Computer package for selecting high voltage insulators for different contamination conditions”, IEEE Trans. Electr. Insul., Vol. 20, No. 4, pp. 1428-1435, 2013. O. Mayr, “Beitrag zur théorie der statischen und der dynamischen lichtbogens”, Archiv fur Elektrotechnik, Vol. 37, pp. 588–608, 1943. N. Dhahbi-Megriche, A. Béroual and L. Krähenbühl, “A New Proposal Model for Flashover of Polluted Insulators”, J. Phys. D. Appl. Phys., No. 30, pp. 889-894, 1997. R. Wilkins and A. J. Al-Baghdadi, “Arc Propagation Along an Electrolyte Surface", Proc. IEE, Vol. 118, No. 12, pp. 1886-1894, 1971. R. Wilkins, “Flashover voltage of HV insulators with uniform surface pollution films”, Proc IEE, Vol. 116, pp. 457-465, 1969. N. Dhahbi-Megriche and A. Beroual, “Dynamic model of discharge propagation on polluted surfaces under impulse voltages”, Proc. Generation, Transmission and Distribution, Vol. 147, No. 5, pp. 279-284, 2000. N. Dhahbi-Megriche and A. Béroual, “Predictive dynamic model of the leakage current and flashover voltage of discontinuously polluted insulators under ac voltage: experimental validation”, J. Phys. D: Appl. Phys., Vol. 40 , pp.7782-7786, 2007. Zhidong Jia, Can Chen, Xilin Wang, Hai Lu, Cuiru Yang and Tong Li, “Leakage current analysis on RTV coated porcelain insulators during long term fog experiments”, Trans. Dielectr. Electr. Insul., Vol. 21, No. 4, pp. 1547-1552, 2014. P. Thin, N. Doan and V. Dao, “Leakage current analysis for predicting flashover in distribution network”, IEEE Conf. Electr. Insul. Dielectr. Phenomenon, pp.462-465, 2009. M. A. Douar, A. Mekhaldi, and M. C. Bouzidi, “Flashover process and frequency analysis of the leakage current on insulator model under nonuniform pollution conditions”, IEEE Trans. Dielectr. Electr. Insul., Vol. 17, pp. 1284-1297, 2010. A. M. Rahal and C. Huraux, “Flashover mechanism of high voltage insulators”, IEEE Trans. Power App. Syst., Vol. 98, No. 6, pp. 22232230, 1979. S. Taheri, M. Farzaneh and I. Fofana, “Electrical performance evaluation of EHV post insulators covered with ice under different air gap configurations”, Trans Dielectr. Electr. Insul., Vol. 21, No. 6, pp. 26192627, 2014. C. Volat, S. M. Ale Emran and M. Farzaneh, “Numerical Simulations of Ice-Covered EHV Post Station Insulator Performance Equipped with Booster Sheds”, IEEE Int’l. Sympos. Electr. Insul. (ISEI), San Juan, PR, USA, pp.91-94, 2012. S. Chakravorti and P. K. Mukherjee, “Power frequency and impulse field calculation around a HV insulator with uniform or nonuniform surface pollution”, Trans Electr. Insul., Vol. 28, No. 1, pp. 43-53, 1993. S. Hasegawa and H. Akagami, “Flashover Characteristics of Impulse Voltages on Solid Dielectric Surfaces under High Humidity”, Japanese J. Appl. Phys., Vol. 29, No. 1, pp.168-172, 1990. K. L. Chrzan, “Ligthning Impulse Performance of Polluted medium Voltage Insulator”, Intl. Sympos. High Voltage Eng., ISH, Paper E-29, pp. 1-6, 2009. R. Montano, H. Sjostedt, Y. Serdyuk and S. Gubanski, “Effect of surface charges on the flashover voltage characteristics of polymeric materials: comparison between theory and practice”, IEEE Conf. Electr. Insul. Dielectr. Phenomena, pp. 368-371, 2007.]
IEEE Transactions on Dielectrics and Electrical Insulation
Vol. 23, No. 5; October 2016
Nabila Dhahbi-Megriche received the Master and Ph.D. degrees, respectively in 1994 and 1998 from the Ecole Centrale de Lyon, France. She is currently an assistant professor at the Institute of Applied Sciences and Technology (INSAT) in Tunisia. She is a member of the Research Unit “Materials, Measurements, and Applications (MMA)”. Her main research interest include high voltage engineering phenomena, outdoor insulation and modeling of discharges.
2907
Abderrahmane Beroual (F’11) is currently a Professor at the Ecole Centrale de Lyon, France. Presently, he is the head of the Dielectric Materials and High Voltage Group at AMPERE Lab - CNRS as well as Responsible of the Master Research Program in electrical engineering. From 1994 to 1998, he chaired the International Study Group on Streamer Propagation in Liquids of the IEEE – DEIS. He is a member of many Advisory Committees of International Conferences (ICDL, ISH, APTADM, Gas Discharge, ICHVE, CMD, NIWE, iREED, Technical Committee of the IEEE CEIDP, UF10 Technical Commission – MT30 of IEC) and responsible of various research projects. His main research interests include high voltage insulation, dielectric materials, long air gaps discharge and lightning, outdoor insulation, modelling of discharges and composite materials. He supervised more than 40 Ph.D. Students. He is author/co-author of more than 400 technical papers including more than 160 refereed journal papers, 5 patents, 2 books and 6 book chapters.