Hindawi Wireless Communications and Mobile Computing Volume 2018, Article ID 6201386, 11 pages https://doi.org/10.1155/2018/6201386
Research Article Self-Organized Cell Outage Detection Architecture and Approach for 5G H-CRAN Peng Yu , Fanqin Zhou
, Tao Zhang, Wenjing Li
, Lei Feng , and Xuesong Qiu
State Key Laboratory of Networking and Switching Technology, Beijing University of Posts and Telecommunications, Beijing 100876, China Correspondence should be addressed to Wenjing Li;
[email protected] Received 1 December 2017; Accepted 3 April 2018; Published 10 May 2018 Academic Editor: Gui-Ling Sun Copyright © 2018 Peng Yu et al. This is an open access article distributed under the Creative Commons Attribution License, which permits unrestricted use, distribution, and reproduction in any medium, provided the original work is properly cited. An attractive architecture called heterogeneous cloud radio access networks (H-CRAN) becomes one of the important components of 5G networks, which can provide ubiquitous high-bandwidth services with flexible network construction. However, massive access nodes increase the risk of cell outages, leading to negative impact on user-perceived QoS (Quality of Service) and QoE (Quality of Experience). Thus, cell outage management (COM) became a key function proposed in SON (Self-Organized Networks) use cases. Based on COM, cell outage detection (COD) will be resolved before cell outage compensation (COC). Currently few studies concentrate on COD for 5G H-CRAN, and we propose self-organized COD architecture and approach for it. We firstly summarize current COD solutions for LTE/LTE-A HetNets and then introduce self-organized architecture and approach suitable for H-CRAN, which includes COD architecture and procedures, and corresponding key technologies for it. Based on the architecture, we take a use case with handover data analysis using modified LOF (Local Outlier Factor) detection approach to detect outage for different kinds of cells in H-CRAN. Results show that the proposed approach can identify the outage cell effectively.
1. Introduction The future 5G networks will provide ubiquitous highbandwidth network services for varieties types of heterogeneous terminals by integrating different advanced technologies, such as millimeter wave, large-scale MultipleInput Multiple-Output (MIMO) and Nonorthogonal Multiple Access (NOMA) for wireless access, and Software Defined Network (SDN), cloud computing for core networks [1]. In order to make network more efficient, 5G will be a combination of centralized performance processing and distributed demodulation. C-RAN has become a new type of network architecture because of its advantages of cloud computing and distributed processing, which can realize the efficient usage and sharing of computing resources [2]. However, LTE/LTEA heterogeneous networks (HetNet) providing differentiated data services will still be left to 5G networks. To improve spectrum efficiency and energy efficiency for HetNet coexisting with C-RAN, a new 5G wireless network architecture call H-CRAN is proposed [3]. In addition, a brief architecture
for H-CARN is shown in Figure 1. Each nodeC connects to ACEs or RRHs from wired or wireless fronthaul, and users communicate with ACE or RRH from wireless link, and D2D link is also adopted to improve edge user throughputs as well. NodeCs are located in cloud environment and can connect to Internet. In 5G H-CRAN, Building Baseband Unit (BBU) pools are centralized into cloud computing node called NodeC [3]. These nodes can communicate with each other and control regional access nodes such as remote radio heads (RRHs) and existing legacy communication entities (LCEs). All the NodeC are located in the cloud and connect to the Internet, and they can control ACEs and RRHs with wired or wireless fronthaul. Moreover, NodeC collects and processes the spatial information from ACEs and RRHs and performs most of the processing, calculating, and radio resource management functions. Here ACEs (such as eNodeB) may pay the role of providing seamless coverage and RRHs are response for hot spots. Users in H-CRAN are composed of different kinds of devices, such as mobile phones, laptops, smart meters, and
2
Wireless Communications and Mobile Computing
Internet
NodeC
NodeC
NodeC
······
ACE
RRH
RRH
RRH
RRH
RRH
RRH D2D
Wireless communication link ACE Fronthaul RRH Fronthaul
Figure 1: A brief architecture of H-CRAN.
Internet of things (IoT) devices and may adopt advanced communication technologies such as D2D [4]. To realize the universal plug and play function, offload network traffic immediately, and manage the computing and spectrum resource dynamically, SON plays an important role to realize intelligent management of H-CRAN. SON is proposed to reduce service providers’ operating expenses in LTE/LTE-A systems and HetNet [5]. H-CRAN consists of a large number of heterogeneous access nodes and cloud computing resource units, and its resource should be virtualized for sharing as well. Therefore, a large-scale SON (LSSON) that integrates a unified autonomic process of ultracomputing, ultra-planning, ultra-configuration, and ultraoptimization is preferred [3]. LS-SON can reduce the complexity of cochannel interference management in H-CRAN to save the operating costs
of all RRHs and ACEs. So it is used to coordinate the management functions of the entire network and improve the overall operational efficiency. Because NodeC needs to serve multiple RANs and cooperate with RRHs, it is considered to implement self-configuring, self-optimization, and selfhealing by using a centralized SON architecture for LS-SON. As one of the critical functions and use cases of SON, self-healing not only identifies fault events, but also is able to diagnose the causes (for example, deciding why it happened), and then triggers appropriate compensation mechanism to turn network to normal state [6]. In H-CRAN, it first has to perceive a fault that has occurred or is about to occur and then adopts proper actions to recover the services (partially or wholly, definitely or temporarily). According to 3GPP standard, the self-healing function can be further divided into multiple use cases, including fault
Wireless Communications and Mobile Computing diagnosis, fault classification, and COM. COM first needs to detect the cell outage automatically and then perform a reasonable compensation mechanism to repair the faults, so as to minimize the impact of cell outage [7]. Therefore, COD is an essential prerequisite for self-healing. At present, the studies of COD mainly aim at traditional LTE/LTE-A HetNet with limited data collection, which may not be appropriate for the complex H-CRAN network architecture. This paper proposes a self-organized COD architecture and a corresponding approach for H-CRAN based on previous work and gives a use case with HO data analysis to evaluate them. The rest of the paper is organized as follows. Section 2 introduces the related work for COD. Section 3 proposes the architecture and approach for 5G H-CRAN COD, meanwhile introducing COD procedures and related technologies. In Section 4, a COD use case for HO data analysis with modified M-LOF is introduced, and conclusions are given in Section 5.
2. Related Work In wireless communication networks, cell outage is mainly caused by the software and hardware faults which bring in network communication interrupt, thus affecting network QoS and users’ QoE [8]. At present, the existing COD researches mainly focus on the LTE/LTE-A HetNet. Several detection methods use data collected by drive test or subscriber complaints to analyze the network faults and cell outages. For instance, in [9], COD is analyzed autonomously by preprocessing the minimization drive testing (MDT) together with local outlier factor based detector (LOFD) and one class support vector machine based detector (OCSVMD) to detect and localize anomalous network behavior. These solutions not only cost much time and manpower cost, but also require expert knowledge or prior experience. Several studies pay attention to COD with KPI variation such as handover statistics [10], and a cooperative femtocell outage detection architecture, which consists of a trigger stage and a detection stage with RSRP, is introduced in [11]. Further, an efficient discriminant function is used to complete COD with CQI and RRC connection reestablishment information in [12]. However, these approaches are just suitable for traditional UMTS or LTE/LTE-A networks. Recently, there have been a few studies that focus on COD with machine learning approaches under data collected from users or cells. In [13], an unsupervised data mining algorithm with a reference signal received power (RSRP) and reference signal received quality (RSRQ) was proposed to detect cell outages. Reference [14] applied the Hidden Markov model for cell outage detection under RSRP and RSRQ as well. Further, a classification-based approach named 𝐾nearest neighbor (KNN) is proposed for COD in [15], and transductive confidence machines (TCM) based COD with RSRP and SINR data is proposed in [16]. Moreover, our previous work used LOF to detect cell outage with handover statistics [17]. These works can give suggestions for technology selection for 5G H-CRAN COD. In particular, RRHs failure in 5G H-CRAN may be difficult to detect because their failure may not trigger operation
3 and maintenance system alarm, which make that self-healing function unable to timely compensate for these nodes. As a result, the outage may last hours or a few days before being discovered, unless the abnormal status is captured by DT test or feedback from users. Rapid fault discovery and localization of abnormal cells can reduce network paralysis and deterioration caused by node outage. Due to the high density of nodes in H-CRAN, the faults of a single RRH will not quickly affect the network as users may handover or reconnect to neighbor RRHs or ACEs. It increases the fault tolerance rate but makes COD more difficult as well, thus increasing the instability of the network. Based on above analysis, we find that present COD approaches for LTE/LTE-A HetNet may not be suitable for H-CRAN due to their limited data sets and obvious outage alarm. Therefore, in this paper, we will establish COD architecture with complete procedures to handle implicit RRH outages.
3. COD Architecture and Approach for 5G H-CRAN To make it clean, in 5G H-RAN, we also regard the coverage of each RRH as a cell. Still, cell definition for ACEs may use traditional ones. As COD for ACEs can be easily resolved by approach mentioned above in HetNet, here we mainly concentrate on implicit cell outage for RRHs. For the convenience of illustration, we consider a simple cell outage scenario in H-CRAN under a NodeC as shown in Figure 2. Here one ACE and many randomly distributed RRHs are under control of one NodeC. When a RRH cell turns into outage, its serving users may reconnect to ACE or handover to another RRH cell. This reconnection or handover will result in signaling and communication variation among users, RRHs, ACEs, and NodeC. We require all these data to execute COD if we want to achieve accurate and timely outage detection. In the above scenario, a simple user reconnect procedure is shown in Figure 3. If a user has to establish a communication link with a RRH, it first sends a “Connection Request” command to it, and then this RRH will send a “Resource Request” command to NodeC. Only when NodeC reply a “Request Response” command to RRH with required resource allocation, the RRH will give a successful connect reply with “Connection Setup” to users. Then the service will go on. It means a user keeps a connection to a RRH under the control of NodeC with allocated resource. If the RRH has gone into outage state due to cable loss or power off, user’s service will fail and it will attempt to reconnect to ACE or other RRHs. If NodeC has enough resource, connection between user and ACE will be established again as the same as RRH connection. Here RRH outage may not report to NodeC immediately. However, we can count the time of connect request from user to other RRH and ACE, as the two counting points show in Figure 3. If we store these data and analyze it with time series fitting or prediction, we may get variation features and obtain abnormal points at several time intervals, which may be useful for RRH COD.
4
Wireless Communications and Mobile Computing
Outage RRH
RRH Node C Cloud ACE
RRH
Connect Lost connection Reconnect
RRH Fronthaul ACE Fronthaul
Figure 2: Cell outage in H-CRAN.
User
RRH
ACE
NodeC
Counting point Connection request Resource request Resource response Connection response Connection setup In Service Outage Occurs Connection failure
Counting point
Connection request Connection response
Resource request Resource response
Connection setup Service Recovery
Figure 3: An instance of user reconnection process.
Wireless Communications and Mobile Computing
5
Data Collection User RRH/ ACE NodeC
Data Analysis Input
RSRP/RSRQ/
Pre-processing
SINR/CQI. . . . . .
Input
HO/Connection Request
Input
/NCL. . . . . .
Temporal Predication
Network topology/ Cell parameters. . . . . . Input
DT
Spatial Predication
Machine Learning
MDT Data. . . . . .
Achieve
Performance Evaluation Guideline Cell Outage Compensation
COD Conclusion
Figure 4: Overview architecture for COD in 5G H-CRAN.
Based on the above analysis, we want to construct an integrated COD architecture for 5G H-CRAN, and its detailed introduction is given below. 3.1. COD Architecture and Procedures. Firstly, the proposed architecture for COD can be found in Figure 4. As shown in Figure 4, COD mainly consists of data collection and data analysis stages. Firstly, data collection should store data from different sources, which are as follows: (1) Data collection from users through measurement reports, such as RSRP, RSRQ, SINR, and CQI information: this information is always huge and hard to be handled synchronously as the time interval is fairly dense. So we can set a sampling interval and just take the statistics for them. (2) Data collection from RRH/ACE, such as HO/Connection Request/NCL: these data may come from the KPI statistics from OAM system. These data are performance indicators and can be used directly as the interval is defined beforehand under acceptable level. (3) Data collection for NodeC, which may network level data such as network topology, and preconfigured cell parameters (transmit power, spectrum, antenna height, and tilt): these data can be used to supplement the spatial and temporal analysis of different cells. (4) Drive test data: drive test is a tool to verify network performance afterward. It can be used as a validation for COD conclusions and thus provide correction suggestions for COD approach. After data collection, all the data can be put to data analysis stage to execute COD. As shown in Figure 4, with SON entities which located at NodeC, the procedure will be executed as follows:
(1) SON entities firstly should preprocess these data to improve the data quality. (2) SON entities adopt temporal and spatial prediction method to obtain varying patterns for temporal data and spatial data, respectively. (3) Next SON entities choose proper machine learning approach to identify the outage cell. Still, with COD results, we can give suggestions for COC. And COC effectiveness evaluation can be obtained through network performance monitoring, thus constructing a selforganized loop. The critical technologies of preprocessing, spatial and temporal prediction and machine learning will be introduced next. 3.2. Key Technologies for COD 3.2.1. Data Processing. Data processing includes two concepts such as Data Cleaning and Feature Engineering. These two are compulsory for achieving better accuracy and performance before machine learning and deep learning. And it includes data cleaning, data integration, data transformation, and data reduction. So in our architecture, we should choose proper data processing approach to obtain high-quality data. 3.2.2. Spatial Prediction. Spatial prediction technologies mainly aim at analysis spatial traffic distributions or capture user variations. Currently, several methods have been adopted in this field, such as log-normal or Weibull distribution used in [18] or traffic patterns identifying methods proposed in [19]. With spatial prediction, we can obtain different distribution laws. 3.2.3. Temporal Prediction. Temporal prediction is aiming at predicting future variation direction based on past and
6
Wireless Communications and Mobile Computing Table 1: Cell level data.
Measurements Time Cell info Cell location Cell inHO
Description Transmission time interval (TTI) Cell global identity (CGI) Longitude and latitude information Cell incoming handover
current temporal sequence data, for instance, traffic variation of one ACE or load of NodeC. Temporal prediction can adopt Holt–Winter traffic forecast [20] or S-ARIMA model [21] to construct prediction sequences, which will be useful for abnormal traffic recognition. Moreover, joint temporalspatial predication approaches deserve more attention as well.
Table 2: Simulation parameters. Simulation parameters ACE RRH User number User distribution Link direction BS Tx power Path loss model UE velocity User distribution Cell selection criteria Simulation length
Value (unit) 19 sites, with 3 cells each 1 cell per site 25 per ACE Uniform random distribution Downlink 46 dBm Cost231-Hata 15 km/h Uniform Strongest RSRP defines the target cell 150 TTI
3.2.4. Machine Learning. As analyzed in [22], machine learning has been used for LTE/LTE-A self-healing and achieves remarkable results. However, these methods are mainly based on single data source and do not take integrated data set shown in Section 3.1 together. To make COD more accurate and intelligent in 5G networks, deep learning model [23] such as DRN model can be considered.
4. A Use Case for 5G H-CRAN COD According to the architecture and procedures above, we introduce a use case to achieve COD for 5G H-CRAN. Here we suppose that the outage RRH or ACE cell cannot carry traffic anymore. Typically at this point, all users served by this cell have to be offloaded to its neighbor cells. This will result in a huge number of handovers in H-CRAN. The rising handovers in neighbor cells could be easily detected by means of data mining. So we will discuss our algorithm by using the temporal data of inHO statistics collected from the NodeC. RRH cell
4.1. Use Case Scenario Description. The scenario is shown in Figure 5. It consists of 19 ACE with 25 users under coverage. All these users are active users. Each ACE has 3 cells and one RRH cell is located under each ACE cell. The UEs are randomly distributed in cells to generate handover statistics and measurement reports. Still, we mainly collect cell level information stored in NodeC as shown in Table 1. Moreover, in order to make the evaluation more obvious, we will evaluate the procedure under a simulation platform developed by our lab. Parameter settings can be found in Table 2. In our simulation platform, we assume that rapid decrease of cell’s transmit power indicates cell outage. That is, we can set cell outage manually to evaluate efficiency of our approach. Then users under the affected outage areas switch to the neighbor cells which will increase the number of handovers. We will use the inHO data collected from all the cells with a machine learning methods to evaluate whether outage cells can be detected.
ACE
Figure 5: Scenario use case for 5G H-CRAN.
4.2. COD Procedures with M-LOF. Considering the situations above and the advantage of LOF shown in [9], a modified LOF based detector is adopted to detect the outage by extracting both spatial and temporal correlations of handover statistics over the neighbors of outage cells. The procedure is shown in Figure 6. The COD procedure includes four steps: data collection, preprocessing, machine learning, and localization, and all can be executed automatically under the control of LS-SON. In this way, the outage cell can be detected timely, so we can minimize the performance degradation of the network. Here we will introduce the functions in three steps. 4.2.1. Preprocessing. When data collection is finished, SON entities proceed to extract feature vector 𝑇𝑖 for LOF [24],
Wireless Communications and Mobile Computing
7 After slicing the data series, linear functional transformation criterion is used to normalize the data to eliminate errors caused by nonuniform features. For example, the criterion of 𝑆𝑗 is defined as
Data Collection
Cell Level Data H-CRAN Database
𝑆𝑗 =
Pre-processing
Filter
Low-dimension
Standardization
Parameter Estimation
Detection
Store data to database
Yes
.
Test z score Calculation
𝑑 (𝑜𝑖 , 𝑝) ≤ 𝑑 (𝑜𝑘 , 𝑝) ,
Outage
(4)
and for at most 𝑘 − 1 cells 𝑜𝑖 satisfies 𝑑 (𝑜𝑖 , 𝑝) < 𝑑 (𝑜𝑘 , 𝑝) . COC
corresponding to each temporal data. Since the inHO data is collected from different cells at the different time, the data vector is designed as spatial-temporal series. In fact, the inHO statistics of outage cells are zero since the KPIs in outage cell cannot be collected. Moreover, for one possibility, there may be a few zero-inHO cells, because no active users are within their coverage. This will enhance the difficulty of detection. In this case, we filter all inHO statistics of zero. Here each cell splits out an ordered time series of inHO. To finish length-wise normalization and carry out uniformization and standardization processing, we slice the time series to several subseries. For temporal analysis, 5 TTIs data is put into one feature vector 𝑇𝑖 , as shown in below where 𝑖 represents the order of subseries. 𝑇𝑖 = {inHO1 , inHO2 , inHO3 , inHO4 , inHO5 } .
Definition 3. Reachability distance of cell 𝑝 with respect to cell 𝑜 is denoted as rd𝑘 (𝑝, 𝑜); it is the maximum one of 𝑑𝑘 (𝑝) and the distance between 𝑝 and 𝑜. rd𝑘 (𝑝, 𝑜) = max {𝑑𝑘 (𝑜) , 𝑑 (𝑜, 𝑝)} .
(2)
(6)
Definition 4. Local reachability density of cell p, denoted as lrd𝑘 (𝑝), is shown as follows: lrd𝑘 (𝑝) =
𝑁𝑑𝑘 (𝑝) (𝑝) . ∑𝑜∈𝑁𝑑 (𝑝) (𝑝) rd𝑘 (𝑝, o)
(7)
𝑘
Definition 5. Local outlier factor of cell p, denoted as LOF𝑘 (𝑝), can be obtained as below:
(1)
The feature vector 𝑇𝑖 utilizes exactly one cell’s inHO data, which is used to find out the time when an outage happened. For spatial analysis, one feature vector 𝑆𝑗 consists of 𝑙 cell handover statistics at TTI time 𝑗, where 𝑗 represents the identity of the cell. 𝑆𝑗 = {inHO1 , inHO2 , inHO3 , inHO4 , inHO5 , inHO6 ,
(5)
Definition 2. 𝑘-distance neighborhood of cell 𝑝, denoted as 𝑁𝑑𝑘 (𝑝) (𝑝), when 𝑑𝑘 (𝑝)is given, 𝑁𝑑𝑘 (𝑝) (𝑝) is the set which includes every cell whose distance to cell 𝑝 is smaller than 𝑑𝑘 (𝑝).
Figure 6: COD procedure with modified LOF.
inHO7 , inHO8 , . . . , inHOl } .
(3)
Definition 1. k-distance of cell 𝑝, denoted as 𝑑𝑘 (𝑝), represents the distance between cell 𝑝 and its 𝑘th nearest neighbor, so that for at least 𝑘 cell 𝑜𝑖 satisfies
Localization No Z> threshold?
max𝑗 (𝑆𝑗 ) − min𝑗 (𝑆𝑗 )
4.2.2. Machine Learning. LOF detection is an unsupervised anomaly detection algorithm. The local densities of target points are calculated by LOF used to compare with its neighbors. The larger the difference between the sample and its neighbors is, the larger outage factor score will be assigned to the sample. The advantage of LOF is that no prior knowledge is required in advance to detect the unknown cell outage. The detailed definitions of LOF are explained as follows.
Machine Learning
M-LOF Calculation
𝑆𝑗 − min𝑗 (𝑆𝑗 )
LOF𝑘 (𝑝) =
∑𝑜∈𝑁𝑑
𝑘 (𝑝)
(lrd𝑘 (𝑜) /lrd𝑘 (𝑝)) . 𝑁𝑑𝑘 (𝑝) (𝑝)
(𝑝)
(8)
The above descriptions give the definition of LOF. From our previous work in [17], the proposed M-LOF is a proper approach for heterogeneous network, so here we use the modified LOF algorithm called M-LOF to make a refined choice for H-CRAN. Definitions of M-LOF and m-distance are given below.
Wireless Communications and Mobile Computing
MLOF Value
8 5.5 5.0 4.5 4.0 3.5 3.0 2.5 2.0 1.5 1.0 0.5 0.0 −0.5 −1.0 −1.5
13 76 74
60
62
36 11
6 3 4 1
8
5 7
11
17 0 14 16 6 8 10 12 14 13 2 4 10 16 2 7 3 0 15 5 12 9 1
0
24
17
58
9 15
75
73
21 25 22 24 27 25 27
33 35 29 30 32 35 36 38 29 30
22 21
3233
38
41
47
44 4344
41
46 43
52 49
47 46
69 76 65 64 75 67 70 71 59 65 6869 59 62 7071 73 63 60 565758 72 56 74 63 66 57 66 68 55 64 67 72
55
54 52 54
49
5 10 15 20 25 30 35 40 45 50 55 60 65 70 75 80 Cell Id InHo Data MDT Data Abnormal cells
Figure 7: Spatial analysis for abnormal cells.
Definition 6. 𝑚-distance of cell 𝑝, given the positive integer 𝑘, is defined as 𝑚− 𝑑𝑘 (𝑝) = 𝜀 + [ [
∑𝑜∈𝑁𝑑 (𝑝) (𝑝) 𝑑 (𝑝, 𝑜) 𝑘 ]. 𝑁𝑑𝑘 (𝑝) (𝑝) ]
(9)
Here 𝜀 is a constant value to enhance the accuracy. Definition 7. 𝑚-distance neighborhood of cell p, denoted as 𝑁𝑚− 𝑑𝑘 (𝑝) (𝑝), is the set which includes every cell which distance to cell 𝑝 is smaller than m-distance. Definition 8. Reachability distance of m-distance of cell 𝑝 concerning cell o, denoted as 𝑟− 𝑑𝑚 (𝑝, 𝑜), is 𝑟− 𝑑𝑚 (𝑝, 𝑜) = max {𝑚− 𝑑𝑘 (𝑜) , 𝑑 (𝑜, 𝑝)} .
(10)
Definition 9. Local reachability density of cell p is defined as 𝑁 𝑚− 𝑑𝑘 (𝑝) (𝑝) . lrd𝑚 (𝑝) = (11) ∑𝑜∈𝑁𝑚 𝑑 (𝑝) (𝑝) 𝑟− 𝑑𝑚 (𝑝, o) − 𝑘
Definition 10. Modified local outlier factor of cell p is shown below: LOF𝑚 (𝑝) =
∑𝑜∈𝑁𝑚
(𝑝) (lrd𝑚 (𝑜) /lrd𝑚 (𝑝)) . 𝑁𝑚− 𝑑𝑘 (𝑝) (𝑝)
− 𝑑𝑘 (𝑝)
(12)
According to the definition of LOF𝑘 (𝑝) and LOF𝑚 (𝑝), the choice of 𝑘 is exactly sensitive. As a consequence, if there is a prior experience, we will choose the cross-validation method to estimate the parameter k. 4.2.3. Localization. The last step is localization based on the output of LOF calculation. Here the neighbor cell list [25] is used to search the relation between the outage cell and its neighbor cells by geographic information with 𝑧-score. In this way, the outage cells may be localized.
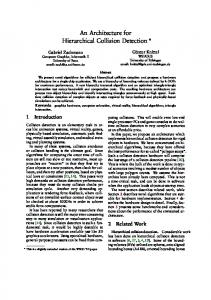
4.3. Results Analysis. Based on the above steps, M-LOF would detect anomalous behaviors of handover. And in the simulation, the value of 𝑘 for the LOF based detector is found between 5 and 14. For the purpose of validation, we will first analyze the results from the spatial and temporal perspectives and then determine outage cell locations with neighbor cell list, and performance comparison between M-LOF and LOF will be given at last. 4.3.1. Spatial Analysis. For spatial analysis, we focus on the temporal data of different cells at the same time period. Figure 7 shows the M-LOF of each cell at 95th TTI. It can be seen that factor values derived from six cells’ inHO data are far higher than the normal value which is usually less than 1.5. Therefore, the abnormal cells can be distinguished from normal cells as they have experienced many user reconnections. For comparison, Figure 7 also shows the detection result using MDT measurements (with RSRP and SINR) as the data source. It can be seen that the abnormal cells are hard to be detected using MDT. Because M-LOF values of cells based on MDT data are smoother than inHO data. In contrast, our proposed method using the inHO data has a better performance for abnormal cell detection in H-CRAN. 4.3.2. Temporal Analysis. Figure 8 shows the temporal analysis result for M-LOF variations relative to TTI for outage cell 13. At this time, from the results we find that M-LOF value arises between TTI 90 and TTI 100, which is in accordance with our outage time setting. As initial connections of users occur between 0–5 TTI under unstable status, so we just ignore these data. 4.3.3. Localization. After the implementation of M-LOF based detector, neighbor cell list is used to localize the outage
Wireless Communications and Mobile Computing 2.2
9 Table 3: Performance evaluation.
95
Result False negative rate False positive rate
2.0
110
1.4 10
1.2
15
1.0
0
6
85 20
0.8
M-LOF value 3% 6%
5
1.6
25 30
35 40
55 50 45
65 60
70
800
130
75 80
90
140 115 125 135 100 105 120
10 20 30 40 50 60 70 80 90 100 110 120 130 140 TTI
4 User Position Y
MLOF Value
1.8
LOF value 3% 12%
600
Outage Period
𝑧𝑘 =
𝑛𝑘 − 𝜇𝑛 , 𝜎𝑛
30
100
14
63
61 27
13
60
200
1
18
24
12
75
22
57
0
16
69
17
72
11
300 400 500 600 User Position X
700
9 47
52 54
8 44
49
71 55
21
46
68 73
56
7 41
70
74 58
59
15
66
65 76
62
25
200
cells. First, we need to set a threshold to filter anomalous cells through 𝑧-score calculation as
64
43
38 67
35
29 2
Figure 8: Temporal analysis for outage TTI.
33
32 3
400
5
36
10
800
(13)
where 𝑛𝑘 is the M-LOF value of kth cell and 𝜇𝑛 , 𝜎𝑛 are the mean and standard deviation of M-LOF value for the anomaly scores of the other cells. The reference 𝑧-score threshold is configured with a preferred value for the abnormal cells. Here the reference 𝑧-score is set to 2.1 according to the computing results. We conducted two sets of evaluations to make a comparison of performance of COD based on inHO data and MDT data, respectively. The results can identify outage cell 18 and cell 61, which is the right one as shown in Figure 9, as LOF values of their neighbor cells are relatively higher than other cells. 4.3.4. Performance Evaluation. In this part, we analyzed the M-LOF detection performance under varying traffic conditions. Since the behaviors of users have a direct effect on inHO data, the diagnosis process has been tested in different scenarios by changing the User Density (UD) and User Velocity (UV) parameters as the baseline setup. To evaluate the impact of the variations of UD and UV on M-LOF values, different scenarios are set up by adjusting these two parameters. The Cumulative Distribution Function (CDF) of the M-LOF values under different UV conditions is shown in Figure 10. It can be seen that, for the low-velocity scenario, almost 80% of the M-LOF values are less than 0.5. However, there is a significant reduction in the M-LOF value as the UV increases. Likewise, a similar behavior is observed with the increase of UD, as shown in Figure 11. The UV and UD parameters influence the distribution and spread of the inHO data as explained earlier, and consequently the value of MLOF. This leads to a low detection performance of M-LOF since it generates an increased number of false alarms.
Outage cell Affected cell
Figure 9: Outage cell location results.
At last, this paper compares LOF and M-LOF by evaluating False Positive Rate (FPR) and False Negative Rate (FNR) and the final results of the simulation are shown in Table 3. The FNR represents the chance that an outage cell is not recognized from the outage cells, while the FPR represents the chance that a normal cell is recognized as the outage cell from all normal cells. From Table 3, we can see that FPR and FNR of LOF based detector are 12% and 3%, respectively. It means the outage cell can be almost wholly detected, although a small part of the normal cell may be determined as an anomaly. The main cause of the 3% FNR is that a small number of anomalous cells have low traffic so that seldom user data cannot be collected when they are in outage. So these small cells are failed to be detected. However, these outages have little impact on overall network performance and user experience. Therefore, we can say the outage cells can be detected successfully with LOF based detector approach. As for M-LOF, the FPR is 6% which is smaller than LOF. The reason why M-LOF has better performance is that M-LOF pays more attention to local density. This is in line with the actual use of outage detection since the abnormal handovers caused by the neighbor outage cell are also localized. Still, as M-LOF just modified the distance computation of LOF, so for time complexity, it is just the same as LOF, with is 𝑂(𝑛2 ). Here 𝑛 is the TTI number or cell number shown in Figure 7 or Figure 8.
10
Wireless Communications and Mobile Computing 1.0
account as well and compare the efficiency of different algorithms under a embodied H-CRAN network deployments. Moreover, we will focus on a specific perspective for selfhealing approaches for H-CRAN and propose more practical solutions.
0.8
CDF
0.6
Conflicts of Interest
0.4
The authors declare that they have no conflicts of interest. 0.2
Acknowledgments 0.0 −2
−1
0
1 M-LOF
2
3
4
This research is supported by the National Science and Technology Major Project of the Ministry of Science and Technology of China (no. 2018ZX030110004).
5
0 m/M < 5% 6?FI=CNS < 1 m/s 1 m/M < 5% 6?FI=CNS < 3 m/s 3 m/M < 5% 6?FI=CNS < 5 m/s
References
Figure 10: CDF of M-LOF for User Velocity. 1.0
0.8
CDF
0.6
0.4
0.2
0.0 −2
−1
0
1
2 M-LOF
3
4
5
6
UE Density = 30 Users/Cell UE Density = 20 Users/Cell UE Density = 10 Users/Cell
Figure 11: CDF of M-LOF value for User Density.
5. Conclusions In this paper, we propose self-organized cell outage detection architecture and approach for 5G H-CRAN. The previous methods using single data source are hard to detect the hidden outage such as RRHs. Aiming at this problem, we introduce architecture and corresponding approach to realize COD for H-CRAN and still analyze the required key technologies. Then we evaluate the approach under a use case, which utilizes the collected inHO statistics and adopt MLOF to detect the anomalous behavior outage cells. Results show that the use case is effective. However, much work still has to be done for this architecture, as we do not consider resource allocation and COC solutions; still, we have to take more intelligent learning model such as deep learning into
[1] P. Rost, A. Banchs, I. Berberana et al., “Mobile network architecture evolution toward 5G,” IEEE Communications Magazine, vol. 54, no. 5, pp. 84–91, 2016. [2] M. Peng, Y. Sun, X. Li, Z. Mao, and C. Wang, “Recent advances in cloud radio access networks: system architectures, key techniques, and open issues,” IEEE Communications Surveys & Tutorials, vol. 18, no. 3, pp. 2282–2308, 2016. [3] M. Peng, Y. Li, Z. Zhao, and C. Wang, “System architecture and key technologies for 5G heterogeneous cloud radio access networks,” IEEE Network, vol. 29, no. 2, pp. 6–14, 2015. [4] N. Chen, B. Rong, X. Zhang, and M. Kadoch, “Scalable and flexible massive MIMO precoding for 5G H-CRAN,” IEEE Wireless Communications Magazine, vol. 24, no. 1, pp. 46–52, 2017. [5] O. G. Aliu, A. Imran, M. A. Imran, and B. Evans, “A survey of self organisation in future cellular networks,” IEEE Communications Surveys & Tutorials, vol. 15, no. 1, pp. 336–361, 2013. [6] E. J. Khatib, R. Barco, P. Munoz, I. D. La Bandera, and I. Serrano, “Self-healing in mobile networks with big data,” IEEE Communications Magazine, vol. 54, no. 1, pp. 114–120, 2016. [7] M. Amirijoo, L. Jorguseski, T. Kurner et al., “Cell outage management in LTE networks,” in Proceedings of the 2009 6th International Symposium on Wireless Communication Systems (ISWCS 2009), pp. 600–604, Siena, Italy, September 2009. [8] M. Yin, W. Li, L. Feng, P. Yu, and X. Qiu, “Multi-cell cooperative outage compensation in cloud-RANs based 5G public safety network,” IEEE Access, vol. 5, pp. 17309–17321, 2017. [9] A. Zoha, A. Saeed, A. Imran, M. A. Imran, and A. Abu-Dayya, “Data-driven analytics for automated cell outage detection in Self-Organizing Networks,” in Proceedings of the 2015 11th International Conference on the Design of Reliable Communication Networks, DRCN 2015, pp. 203–210, usa, March 2015. [10] I. De-La-Bandera, R. Barco, P. Mu˜noz, and I. Serrano, “Cell Outage Detection Based on Handover Statistics,” IEEE Communications Letters, vol. 19, no. 7, pp. 1189–1192, 2015. [11] W. Wang, Q. Liao, and Q. Zhang, “COD: A cooperative cell outage detection architecture for self-organizing femtocell networks,” IEEE Transactions on Wireless Communications, vol. 13, no. 11, pp. 6007–6014, 2014. [12] Q. Liao, M. Wiczanowski, and S. Stanczak, “Toward cell outage detection with composite hypothesis testing,” in Proceedings of the 2012 IEEE International Conference on Communications, ICC 2012, pp. 4883–4887, can, June 2012.
Wireless Communications and Mobile Computing [13] Y. Ma, M. Peng, W. Xue, and X. Ji, “A dynamic affinity propagation clustering algorithm for cell outage detection in selfhealing networks,” in Proceedings of the 2013 IEEE Wireless Communications and Networking Conference, WCNC 2013, pp. 2266–2270, chn, April 2013. [14] M. Alias, N. Saxena, and A. Roy, “Efficient Cell Outage Detection in 5G HetNets Using Hidden Markov Model,” IEEE Communications Letters, vol. 20, no. 3, pp. 562–565, 2016. [15] W. Xue, M. Peng, Y. Ma, and H. Zhang, “Classification-based approach for cell outage detection in self-healing heterogeneous networks,” in Proceedings of the 2014 IEEE Wireless Communications and Networking Conference, WCNC 2014, pp. 2822–2826, tur, April 2014. [16] J. Wang, N. Q. Phan, Z. Pan, N. Liu, X. You, and T. Deng, “An improved TCM-based approach for cell outage detection for self-healing in LTE HetNets,” in Proceedings of the 83rd IEEE Vehicular Technology Conference, VTC Spring 2016, chn, May 2016. [17] T. Zhang, L. Feng, P. Yu, S. Guo, W. Li, and X. Qiu, “A handover statistics based approach for Cell Outage Detection in selforganized Heterogeneous Networks,” in Proceedings of the 15th IFIP/IEEE International Symposium on Integrated Network and Service Management, IM 2017, pp. 628–631, prt, May 2017. [18] D. Lee, S. Zhou, X. Zhong, Z. Niu, X. Zhou, and H. Zhang, “Spatial modeling of the traffic density in cellular networks,” IEEE Wireless Communications Magazine, vol. 21, no. 1, pp. 80– 88, 2014. [19] F. Xu, Y. Li, H. Wang, P. Zhang, and D. Jin, “Understanding Mobile Traffic Patterns of Large Scale Cellular Towers in Urban Environment,” IEEE/ACM Transactions on Networking, vol. 25, no. 2, pp. 1147–1161, 2017. [20] S. Morosi, P. Piunti, and E. Del Re, “Sleep mode management in cellular networks: a traffic based technique enabling energy saving,” Transactions on Emerging Telecommunications Technologies, vol. 24, no. 3, pp. 331–341, 2013. [21] W. Y. Szeto, B. Ghosh, B. Basu, and M. O’Mahony, “Multivariate traffic forecasting technique using cell transmission model and SARIMA model,” Journal of Transportation Engineering, vol. 135, no. 9, pp. 658–667, 2009. [22] P. V. Klaine, M. A. Imran, O. Onireti, and R. D. Souza, “A Survey of Machine Learning Techniques Applied to Self Organizing Cellular Networks,” IEEE Communications Surveys & Tutorials, 2017. [23] Z. M. Fadlulla, F. Tang, B. Mao, and et al., “State-of-theArt Deep Learning: Evolving Machine Intelligence Toward Tomorrow’s Intelligent Network Traffic Control Systems,” IEEE Communications Surveys & Tutorials, vol. 19, no. 4, pp. 2432– 2455, 2017. [24] M. M. Breuniq, H. Kriegel, R. T. Ng, and J. Sander, “LOF: identifying density-based local outliers,” SIGMOD Record, vol. 29, no. 2, pp. 93–104, 2000. [25] C. M. Mueller, M. Kaschub, C. Blankenhorn, and S. Wanke, “A Cell Outage Detection Algorithm Using Neighbor Cell List Reports,” in Self-Organizing Systems, vol. 5343 of Lecture Notes in Computer Science, pp. 218–229, Springer Berlin Heidelberg, Berlin, Heidelberg, 2008.
11
International Journal of
Advances in
Rotating Machinery
Engineering Journal of
Hindawi www.hindawi.com
Volume 2018
The Scientific World Journal Hindawi Publishing Corporation http://www.hindawi.com www.hindawi.com
Volume 2018 2013
Multimedia
Journal of
Sensors Hindawi www.hindawi.com
Volume 2018
Hindawi www.hindawi.com
Volume 2018
Hindawi www.hindawi.com
Volume 2018
Journal of
Control Science and Engineering
Advances in
Civil Engineering Hindawi www.hindawi.com
Hindawi www.hindawi.com
Volume 2018
Volume 2018
Submit your manuscripts at www.hindawi.com Journal of
Journal of
Electrical and Computer Engineering
Robotics Hindawi www.hindawi.com
Hindawi www.hindawi.com
Volume 2018
Volume 2018
VLSI Design Advances in OptoElectronics International Journal of
Navigation and Observation Hindawi www.hindawi.com
Volume 2018
Hindawi www.hindawi.com
Hindawi www.hindawi.com
Chemical Engineering Hindawi www.hindawi.com
Volume 2018
Volume 2018
Active and Passive Electronic Components
Antennas and Propagation Hindawi www.hindawi.com
Aerospace Engineering
Hindawi www.hindawi.com
Volume 2018
Hindawi www.hindawi.com
Volume 2018
Volume 2018
International Journal of
International Journal of
International Journal of
Modelling & Simulation in Engineering
Volume 2018
Hindawi www.hindawi.com
Volume 2018
Shock and Vibration Hindawi www.hindawi.com
Volume 2018
Advances in
Acoustics and Vibration Hindawi www.hindawi.com
Volume 2018