Vol. 47 No. 1/2000 37–45 QUARTERLY
Self-organizing neural network for modeling 3D QSAR of colchicinoids.* Jaros³aw Polañski Department of Organic Chemistry, Institute of Chemistry, University of Silesia, 40-006 Katowice, Poland Received: 25 October, 1999 Key words: colchicinoids, 3D QSAR, neural networks A novel scheme for modeling 3D QSAR has been developed. A method involving multiple self-organizing neural network adjusted to be analyzed by the PLS (partial least squares) analysis was used to model 3D QSAR of the selected colchicinoids. The model obtained allows the identification of some structural determinants of the biological activity of compounds.
Colchicine I is a well known alkaloid drawing attention due to its numerous biological activities. Colchicinoids and related compounds bind to tubulin preventing its polymerization, which arrests proliferation. Therefore, the compounds have been widely tested as potential anticancer drugs [1–3]. The structural features determining the ability of colchicinoids to bind tubulin are not quite clear. It is usually believed that the biaryl angle describing the orientation of the A and C rings is the critical parameter determining the affinity of the molecule toward
tubulin. Recently a series of investigations appeared, which aimed at clearing the role of structural motifs of colchicine during interactions with tubulin [4–8]. The process of recognition of colchicine and related compounds by tubulin is a complex phenomenon which can involve more than one binding site [9–13]. In the present paper a new method based on self-organizing neural networks has been developed to obtain a quantitative 3D QSAR model describing a series of colchicinoids described by Boye et al. [14].
Presented at the 7th International Symposium on Molecular Aspects of Chemotherapy, September 8–11, 1999, Gdañsk, Poland. . Financial support of the State Committee for Scientific Research (KBN, Poland) grant No. 3T09A 020 16 is kindly acknowledged. ½ e-mail:
[email protected] Abbreviations: CT, counter-template; MTA, multiple template approach; PLS, partial least squares; SOM, self-organizing neural network; STA, single template approach; TP, transformed property. *
38
J. Polañski
MATERIAL AND METHODS Theoretical background
The classical Hansch QSAR [15–16] is based on two-dimensional structure (2D), which is, however, not a valid description of a real chemical molecule defined by a three-dimensional (3D) arrangement of atoms. Therefore, in the recent decade 2D techniques have been supplemented by 3D methods enabling an efficient comparison of three-dimensional molecular structures. In particular, it is the Comparative Molecular Field Analysis (CoMFA) that both brought a new 3D strategy into molecular design and is still the most frequently used method for determining 3D QSAR [17]; some new techniques have been developed recently [18]. One of the most interesting approaches is probably the self-organizing neural network (SOM), used by Zupan & Gasteiger [19–20] to obtain two dimensional maps of selected properties of molecular surfaces. SOM is a unsupervisedly trained network designed to reduce the dimensionality of the input objects while preserving their topology. Such maps were used for the visualization of the interactions of individual compounds with biological receptors [20–21]. This technique forms also a basis for comparison between molecules. A reference molecule can be selected to form a template network that is trained with coordinates from the van der Waals surface. The coordinates of other molecule (molecules) can be sent to such a network and surface vectors, e.g., the electrostatic potential can be projected on this network [22–26]. The resulting comparative feature map is a kind of superimposition of the molecule and the template. The patterns can be compared by means of a simple subtraction of the matrices [25, 26], classified by the use of a second neural layer [22] or investigated by means of the PLS analysis [27]. The method can be simplified by substituting the molecular surfaces and electrostatic potential for the atomic coordinates and
2000
partial atomic charges. The results are comparable with those yielded by larger maps [28–30]. Procedures
Model building. All structures were modeled by HYPERCHEM 4.0. The conformational search option of CHEMPLUS for HYPERCHEM 4.0 was used to perform conformational analysis and select those structures related most closely to the natural (–) colchicine (of the 7-S absolute configuration in the B ring) for which the angle between A and C rings is to about –50o. For the analogs 9–12 this angle was arbitrarily set to a similar value. A comparable conformer was selected for the six-membered B ring analog 22. The MM+ force field was used to optimize the molecules, and partial atomic charges were calculated with the AM1 method. The stereochemistry of the conformers included in the analysis is defined in Chart 2 by indicating the appropriate orientation of A and C rings using the broad bond lines. Neural procedures were programmed using the embedded protocols of the MATLAB 4.0 NN-Toolbox for Windows, as detailed in previous publications [28–30]. PLS analysis [31] and all other calculations were also programmed in the MATLAB envi-
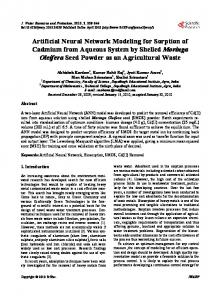
Chart 1.
ronment. All programmed m-files performing the discussed procedures are available from the author on request.
Vol. 47
Modeling 3D QSAR of colchicinoids
RESULTS AND DISCUSSION Multiple template scheme
An operation of a standard neural network is usually realized in such a way that there is one set of training objects (referred to as the template) which determines a single network. Af-
39
ter training the template network is used for the analysis of the test objects (referred to as the counter-templates — CT) investigated. It has been shown, however, that sometimes another scheme can be advantageous, which consists in training a set of n independent neural networks (templates); each characterizes the i-th object. These networks can be
40
J. Polañski
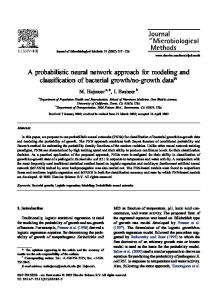
used in the next step to process the same data coming from a single test object (CT). The term multiple template approach (MTA) has been coined to stress the difference between the latter scheme and the standard one (single template approach — STA) [25]. Thus Figs. 1 and 2 illustrate the implementation of these schemes for the self-organizing maps of the molecular surfaces. The first scheme (Fig. 1)
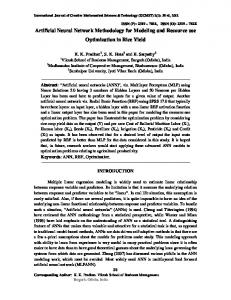
Figure 1. A scheme for the comparison of a series of molecules with a single template.
2000
Although the MTA scheme allows better characterization of each of the objects analyzed it brings a problem of further comparison of the patterns obtained because the n individual networks are not interconnected. Even if this problem can be solved by the use of the descriptors estimating the relation between the structure of each pair of the template and counter-template individually [25], such a method seems not an optimal one because the descriptors lost a lot of information. A comprehensive analysis of the Kohonen networks formed during the MTA processes allows, however, the designing of a new scheme opening the possibility for their evaluation. The atoms of each template are distributed during training within the SOM maps, which means that each atom of the molecule can be ascribed to a certain neuron. The same SOM, if used for processing the data of the CT molecule, attracts its atoms. If the atomic coordinates (x, y, z) form a training set, the location within 3D space will be the parameter de-
A series of molecules (a) is consecutively processed by a single neural network (b) trained with a reference molecule (c). This gives a series of pairs of maps in which the first one is always the same map of the reference template molecule (single template approach, STA); the SOMs shown are topographical maps of the molecular electrostatic potential (size 50 by 50 neurons; colors code electrostatic potential values).
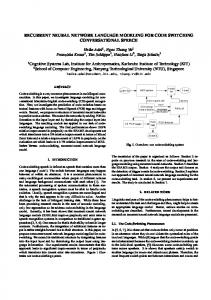
consists of the comparison of each molecule of a series (a) by a single network (b) trained with one reference molecule (c). As a result, a series of pairs of maps (d) is obtained in which the reference map will always be the same. The second scheme (Fig. 2) involves the training of a separate Kohonen network for each molecule of a series (a), i.e., one reference molecule (c) is sent through each of these networks (b), which as previously results in a series of map pairs (d). The comparative pattern of the reference molecule will now be different depending upon the individual template network.
Figure 2. A scheme for the comparison of a series of molecules with multiple networks. Each of the molecules in the series (a) trains a separate network (b). Each of these networks is used to perform a comparison with a reference molecule (c). The resulting comparative maps of the reference will always differ depending on the similarity of the molecule used to obtain a given network and the reference molecule (multiple template approach, MTA); the SOMs shown are topographical maps of the molecular electrostatic potential (size 50 by 50 neurons; colors code electrostatic potential values).
Vol. 47
Modeling 3D QSAR of colchicinoids
termining the location of the atoms within the maps. Then, the atoms of each template and the counter-template located in the same neurons can be related to each other. The back projections of the average property describing the SOM neurons on each atom of the CT molecule give a matrix that will be referred to here as the transformed property (TP) matrix. Since the back projections can involve either the signals coming from the template molecule or from the counter-template, the matrix contains two columns, TP1 and TP2. As a result of the operation, a series of n TP matrices is obtained. The length of the TP matrix will always amount to the number of atoms within
41
Many different hypothetical models explain the interactions of tubulin with the colchicinoid series analyzed. These models usually ascribe to the A and C rings (or A ring especially) a decisive influence for these interactions, while the B ring is important for the kinetics of binding. Some auxiliary binding within this ring has also been suggested [1, 9]. As the structure of the complex between the ligand and tubulin is very sensitive to the patterns of interacting moieties, and the binding process itself can include broad conformational changes of both tubulin and ligand, its modeling poses serious problems. In fact, very few quantitative models of the tubulin
Table 1. The inhibitory effect of colchicinoid compounds on tubulin polymerization [14] Inhibitory effect IC50 [mM]
Compound
1
1.4
9
2.6
2
1.5
10
6.0
3
1.5
11
7.5
4
1.6
12
9.1
5
1.9
13
10.7
6
2.2
14
15.5
7
2.4
8
2.6
Compound
the CT molecule, therefore, the set of the resulting matrices can be analyzed further, e.g. by means of the PLS analysis. The optimization of the new scheme using the steroids benchmark series [17, 32] leads to an excellent 3D QSAR models,which has been described elsewhere [33]. Colchicinoid series
From many different compounds which have been tested as potential tubulin binding ligands, the series characterized by various degree of similarity to a parent colchicine structure [14], was selected for this analysis. The inhibitory effect of these compounds on tubulin polymerization is given in Table 1.
Inhibitory effect IC50 [mM]
binding series can be found in the literature [34]; often involving only small variation of the parent structure [35]. Therefore, a question arose if the QSAR approach could be used in such cases. Generally, QSAR can be interpreted as a non-direct method aimed at investigating the series of ligands interacting with a binding site. It should be remembered that QSAR does not provide a clear visualization of the receptor-ligand interactions. The main goal is the search for structural analogies between interacting molecules, which implies analogy in their biological interactions, including also quantitative responses. The more congeneric series the analysis involves the better a model can be obtained.
42
J. Polañski
In order to analyze the importance of the respective regions of molecules the series was processed by the method discussed above. The change of counter-template (CT) allows a display of different regions of the system. Since the conformation of the inactive atropoisomer of colchicine 14a is too far from all the active ones (1–14) it was omitted from all quantitative models. Three different CTs used give the results shown in Table 2. Although the predictive cross-validation statistics is rather low, it can be clearly observed that the area covering the whole molecular
2000
clusively — CT3 — fails to provide a predictive model Rcv2 < 0. Such results seem to indicate that the B ring also contributes to the interactions of the molecule with tubulin. External predictions, i.e., the use of the 3D QSAR model for the potential design of new compounds (that have not been presented during the so-called training step) are always the major tests for the model. On the other hand, this is also the most difficult task for the present day 3D QSAR technique [36]. Since the predictive power of all resulting models is too low for performing such predic-
Table 2. Performance metrics for 3D QSAR modeled by the SOM method, leave-one-out cross-validated statistics a
Counter-template (CT)
b
2
c
R
SDEP
CT1 (Molecule 1)
0.991
0.563
0.333(3)
4.089
CT2 (Molecule 14)
0.999
0.119
0.209(10)
8.131
CT3 (trimethoxybenzene)
0.733
2.879
a
b
2
Cross-validated Rcv (opt)
Cross-validated s
–0.318(1)
5.247
2
1/2 c
d
2
2
fitted model; SDEP (S(ypred–yobs) /n) ; cross-validated leave-one-out statistics: Rcv = 1– S(ypred–yobs) /S(ymean–yobs) ; opt, d 2 1/2 optimal number of the PLS components; cross-validated leave-one-out statistics: s = (S(ypred–yobs) /(n–opt–1)) ; n, the number of independent objects included in the PLS model.
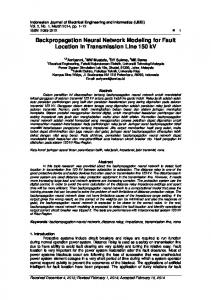
system — displayed with CT1 — provides the best model which is shown in Fig. 3a. The analysis involving rings A and C gives a model of slightly lower statistical parameters. Furthermore, the analysis involving the A ring ex-
tions, the best model (with CT1) was used as the basis for further optimization. An extensive optimization of the neural architecture allows the overcoming of the border value of Rcv2 = about 0.4 (cf. footnote a for Table 3),
Table 3. Predictions for the test molecules that have not been presented to the network during the a training stage R
a
Inhibitory effect IC50 [mM] Experimental
b c
Predicted
15
CH3CH2CH2
12.9
1.4
16
CH3CH2CO
2.7
0.1
17
CH3CH2CH2CO
6.9
2.2
18
CH3CH2CH2CO
11.0
8.7
19
CH3
4.1
2.5
20
CH3CH2
4.2
2.1
21
CH3S
2.4
5.1
22
–
3.6
6.0 2
b
performance metrics for the training set (leave-one-out cross-validation) Rcv = 0.511; s = 3.689 (4 components); data according c to the references: 15–21: [34], 22: [36]; performance metrics for the test set SDEP = 4.831; 2.774 (without 15)
Vol. 47
Modeling 3D QSAR of colchicinoids
a
43
atom C10 in the C ring. The second conclusion is that predictions are relatively better for colchicine analogs 18–22, including the six-membered B ring analogue 22, then for the allocolchicines 15–17. REFERENCES 1. Hastie, S.B. (1991) Interactions of colchicine with tubulin. Pharmac. Theor. 51, 377–401.
b
2. Sackett, D.L. (1993) Podophyllotoxin, steganacin and combrestatin: Natural products that bind at the colchicine site of tubulin. Pharmac. Theor. 59, 163–228. 3. Brossi, A. (1992) Fifteen years of research of bioactive alkaloids. Med. Res. Rev. 12, 1–26. 4. Andreu, J.M. (1998) Role of colchicine ring A and its methoxy groups in binding to tubulin and microtubule inhibition. Biochemistry 37, 8356–8368.
Figure 3. A 3D QSAR model of the inhibitory effect on tubulin polymerization: a, for the training set of colchicinoids 1–14; b, for the test set of colchicinoids 15–22.
therefore we tried to apply it for such purposes. Since the molecules selected randomly for this test have been previously described in the literature, the estimated values of the predictions can be compared with the actual ones and the respective data are given in Table 3 and Fig. 3b. Molecule 15 substituted with a propyl group in the C ring is the most important outlier. Since the model overestimates the affinity of molecule 15, it can be speculated that quite a large alkyl side chain at carbon atom C10 inhibits the effective binding. In fact, a comparison of this molecule to the parent allocolchicine 1 reveals that while the shape of these molecules are comparable, 15 lacks an important polar moiety at carbon
5. Perez-Ramirez, B., Gorbunoff, M.J. & Timasheff, S.N. (1998) Linkages in tubulincolchicine functions: The role of the ring C(C¢) oxygens and ring B in the controls. Biochemistry 37, 1643–1661. 6. Andreu, J.M. & Timasheff, S.N. (1982) Interaction of tubulin with single ring analogues of colchicine. Biochemistry 21, 534–543. 7. Chakrabarti, G., Sengupta, S. & Bhattacharyya, B. (1996) Thermodynamics of colchicinoid-tubulin interactions. J. Biol. Chem. 271, 2897–2901. 8. Berg, U. & Bladh, H. (1998) Stereochemical variations on the colchicine motif. Part 4. Remote metalation approach toward a colchicine analog with a five-membered B-ring. Acta Chim. Scan. 52, 1380–1385. 9. Engelborghs, Y. (1998) General features of the recognition by tubulin of colchicine and related comopounds. Eur. Biophys. J. 27, 437–445.
44
J. Polañski
10. Shi, Q., Chen., K., Brossi, A., Verdier-Pinard, P., Hamel, E., McPhail, A.T., Tropsha, A. & Lee, K. (1998) Antitumor agents. 183. Syntheses, conformational analyses and antitubulin activity of allothiocolchicinoids. J. Org. Chem. 63, 4018–4025. 11. Lincoln, P., Nordth, J., Deinum, J., Angstrom, J. & Norden, B. (1991) Conformation of thiocolchicine and two B-ring modified analogues bound to tubulin with optical spectroscopy. Biochemistry 30, 1179–1187. 12.Andreu, J.M. & Timasheff, S.N. (1980) Conformational states of tubulin liganded to colchicine, tropolone methyl ether, and podophyllotoxin. Biochemsitry 21, 6465–6476. 13. Pyle, E.A. & Hastie, S.B. (1993) Conformational analysis of colchicinoids containing an electron-deficient aromatic ring on the B ring. J. Org. Chem. 58, 2751–2759. 14. Boye, O., Itoh, Y. & Brossi, A. (1989) 185. Deaminocolchicinyl methyl ether: Synthesis from 2,3,4,4¢-tetramethoxybiphenyl-2-carbaldehyd. Comparison of antitubulin effects of deaminocolchicinyl methyl ether and dehydroanalogs. Helv. Chim. Acta 72, 1690– 1696. 15. Hansch, C. & Gao, H. (1997) Comparative QSAR: Radical reactions of benzene derivatives in chemistry and biology. Chem. Rev. 97, 2995–3059. 16. Kubinyi, H. (1993) QSAR: Hansch analysis and related approaches; in Methods and Principles in Medicinal Chemistry (Mannhold, R., Krokgsgaard-Larsen, P. & Timmerman, H., eds.) VCH, Weinheim. 17. Cramer III, R.D., Patterson, D.E. & Bunce, J.D. (1988) Comparative molecular field analysis (CoMFA) 1. Effect of shape on binding steroids to carrier proteins. J. Am. Chem. Soc. 110, 5959–5967. 18. Kubinyi, H. (1997) QSAR and 3D QSAR in drug design. Part 1. Methodology. Drug Discovery Today 2, 457–467.
2000
19. Gasteiger, J., Li, X., Rudolph, Ch., Sadowski, J. & Zupan, J. (1994) The representation of molecular electrostatic potentials by topological feature maps. J. Am. Chem. Soc. 116, 4608– 4620. 20.Gasteiger, J. & Zupan, J. (1993) Neural Networks for Chemists — An Introduction, Chapter 19, pp. 277–291, VCH, Weinheim. 21. Gasteiger, J. & Li, X. (1994) Abbildung elektrostatischer Potentiale muscarinischer und nicotinsicher Agonisten mit künstlischen neuronalen Netzen. Angew. Chem. 106 671–674. 22.Polañski, J. & Gasteiger, J. (1994) The comparison of molecular surfaces by an assembly of self organizing neural network. Proc. III International Conference “Computers in Chemistry 94”, June, Wroc³aw, Poland, p. 88. 23.Anzali, S., Barnickel, G., Krug, M., Sadowski, J., Wagener, M., Gasteiger, J. & Polañski, J. (1996) The comparison of geometric and electronic properties of molecular surfaces by neural networks: Application to the analysis of corticosteroid globulin activity of steroids. J. Comp.-Aided Mol. Design 10, 521. 24. Anzali, S., Gasteiger, J., Holzgrabe, U., Polañski, J., Sadowski, J., Tackentrup, A., Wagener, M. (1998) The use of self-organizing neural networks in drug design; in 3D QSAR in Drug Design (Kubinyi, H., Folkers, G. & Martin, Y.C., eds), vol. 2, pp. 273–299, ESCOM/ Kluwer, Dordrecht. 25.Polañski, J., Gasteiger, J., Wagener, M. & Sadowski, J. (1998) The comparison of molecular surfaces by neural networks and its application to quantitative structure activity studies. Quant. Struct. Act. Relat. 17, 27–36. 26.Barlow, T.W. (1995) Self-organizing maps and molecular similarity. J. Mol. Graphics 13, 24–27. 27. Polañski, J. & Walczak, B. (1999) The comparative molecular surface analysis (CoMSA): A
Vol. 47
Modeling 3D QSAR of colchicinoids
novel tool for molecular design. Computers and Chemistry (in press). 28.Polañski, J. (1996) Neural nets for the simulation of the molecular recognition within MS-WINDOWS environment. J. Chem. Inf. Comp. Sci. 36, 694–705. 29.Polañski, J. (1997) The receptor-like neural network for modeling corticosteroid and testosterone binding globulins. J. Chem. Inf. Comp. Sci. 37, 478–484. 30.Polañski, J. (1997) A neural network for the simulation of biological systems. J. Mol. Struct. (Theochem) 398–399, 567–571. 31. Geladi, P. & Kowalski, B.R. (1986) Partial least-squares regression: A tutorial. Anal. Chim. Acta 185, 1–17. 32.Coats, E. (1998) The CoMFA steroids as a benchmark dataset for development of 3D QSAR methods. Perspect. Drug Discov. Design 12/13/14, 199–213. 33.Polañski, J. (2000) The non-grid technique for modeling 3D QSAR using self-organizing neu-
45
ral network (SOM) and PLS analysis: Application to steroids and colchicinoids. SAR QSAR Env. Sci. (in press). 34. Zhu, Q., Guo, Z., Huang, N., Wang, M. & Chu, F. (1997) Comparative molecular field analysis of a series of paclitaxel analogues. J. Med. Chem. 40, 4319–4328. 35.Dahl, J.R., Staretz, M.E., Potenziano, J.L. & Hastie, S.B. (1998) 3D QSAR Analysis of Colchicine Analogs, http://chemiris.chem. binghamton.edu/HASTIE/QSAR_POSTER/q sar_poster.html 36.Sun, L., McPhail, A.T., Hamel, E., Lin, C.M., Hastie, S.B., Chang, J.J. & Lee, K.H. (1993) Anitumor agents. 139. Synthesis and biological evaluation of thiocolchicine analogs 5,6-dihydro-6(S)-(acyloxy)- and 5,6-dihydro-6(S)[(aryloxy)methyl]-1,2,3-trimethoxy-9-(methylthio)-8H-cyclohepta[a]naphtalen-8-ones as novel cytostatic and antitumor agents. J. Med. Chem. 36, 544–551.