IJCSI International Journal of Computer Science Issues, Vol. 7, Issue 5, September 2010. ISSN (Online): 1694-0814 ...... In Proc. of UAI-99, pp.101â108 ,1999.
IJCSI International Journal of Computer Science Issues, Vol. 7, Issue 5, September 2010 ISSN (Online): 1694-0814 www.IJCSI.org
272
Modeling and design of evolutionary neural network for heart disease detection K.S.Kavitha 1, K.V.Ramakrishnan 2, Manoj Kumar Singh 3 1
Auden Technology & Management academy, Bangalore, India 2
3
C.M.R .Institute of Technology. Bangalore, India
Manuro Tech. Research, Bangalore, India
Abstract This research is having purpose to find the alternatives to the solution of complex medical diagnosis in detection of heart disease where human knowledge is apprehended in a general fashion. Successful application examples shown previously that human diagnostic capabilities are significantly worse than the neural diagnostic system. This paper describes a new system for detection of heart disease based on feed forward neural network architecture and genetic algorithm. Hybridization has applied to train the neural network using Genetic algorithm and proved experimentally, proposed learning is more stable compare to back propagation. Detail analysis has given with respect to genetic algorithm behavior and its relationship with learning performance of neural network. Affect of tournament selection has analyzed to get more detailed knowledge what is happening internally. With the proposed system we hope that, design of diagnosis system for heart disease detection will become easy, cost effective, reliable and efficient. Keywords: Heart disease, Neural network, Genetic algorithm, Tournament selection.
1. Introduction Coronary artery disease cause severe disability and more death than any other disease including cancer. Coronary artery disease is due to athermanous narrowing and subsequent occlusion of the coronary vessel. It manifests as angina, silent ischemia, unstable angina, myocardial infraction, arrhythmias, heart failure and sudden death. Corresponding authors: 1 K.S.Kavitha, 3 Manoj Kumar Singh This research is completed at Manuro Tech. Research Bangalore, India.
The term Heart disease encompasses the diverse diseases that affect the heart. Heart disease is the major cause of casualties in the world. Coronary heart disease, Cardiomyopathy and Cardiovascular disease are some categories of heart diseases. The term “cardiovascular disease” includes a wide range of conditions that affect the heart and the blood vessels and the manner in which blood is pumped and circulated through the body. Cardiovascular disease (CVD) results in severe illness, disability, and death [1]. Narrowing of the coronary arteries results in the reduction of blood and oxygen supply to the heart and leads to the Coronary heart disease (CHD). Myocardial infarctions, generally known as a heart attacks, and angina pectoris, or chest pain are encompassed in the CHD. A sudden blockage of a coronary artery, generally due to a blood clot results in a heart attack. Chest pain arise when the blood received by the heart muscles is inadequate [2].High blood pressure, coronary artery disease, valvular heart disease, stroke, or rheumatic fever/rheumatic heart disease are the various forms of cardiovascular disease. The World Health Organization has estimated that 12 million deaths occurs world wide, every year due to the cardiovascular diseases. Half the deaths in the United States and other developed countries occur due to cardio vascular diseases. It is also the chief reason of deaths in numerous developing countries. On the whole, it is regarded as the primary reason behind deaths in adults [3]. Epidemiologists in India and international agencies such as the World Health Organization (WHO) have been sounding an alarm on the rapidly rising burden of cardiovascular disease (CVD) for the past 15 years [4].The reported Prevalence of coronary heart disease (CHD) in adult surveys has risen four-
IJCSI International Journal of Computer Science Issues, Vol. 7, Issue 5, September 2010 ISSN (Online): 1694-0814 www.IJCSI.org
fold in 40 years and even in rural areas the prevalence has doubled over the past 30 years [4]. In 2005, 53% of the deaths were on account of chronic diseases and 29% were due to cardiovascular diseases alone [5 6]. It is estimated that by 2020, CVD will be the largest cause of disability and death in India. The country already has more than 40.9 million people with diabetes and more than 118 million people with hypertension, which is expected to increase to 69.9 and 213 million respectively, by 2025 unless urgent preventive steps are taken[7 9]. WHO estimates [10] that India lost 9 billion dollars in national income from premature deaths due to heart disease, stroke and diabetes in 2005, and is likely to lose 237 billion dollars by 2015.Further concern is the fact that Indians are succumbing to diabetes, high blood pressure and heart attacks 5–10 years earlier than their Western counterparts [7, 11, 12,] in their most productive years. Unfortunately, scientific data also shows that socio-economically disadvantaged sections of the population are now the dominant victims of CVD and its risk factors [13-17]. There is also preliminary evidence that the burden of CVD in rural areas is increasing [18]. Therefore, there is a need to initiate urgent action to forestall this grave portent of increasing mortality and morbidity due to CVD. Let us have a look of report presented by WHO in 2009 update (September).
CVDs are the number one cause of death globally: more people die annually from CVDs than from any other cause. An estimated 17.1 million people died from CVDs in 2004, representing 29% of all global deaths. Of these deaths, an estimated 7.2 million were due to coronary heart disease and 5.7 million were due to stroke. Low- and middle-income countries are disproportionally affected: 82% of CVD deaths take place in low- and middleincome countries and occur almost equally in men and women. By 2030, almost 23.6 million people will die from CVDs, mainly from heart disease and stroke. These are projected to remain the single leading causes of death. The largest percentage increase will occur in the Eastern Mediterranean Region. The largest increase in number of deaths will occur in the South-East Asia Region.
2. Human experts vs. machine expert in diagnosis
273
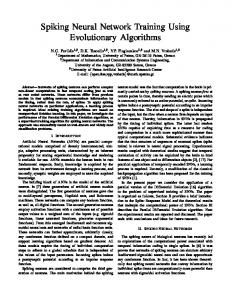
Almost all the physicians are confronted during their conformation by the task of learning to diagnose. Here, they have to solve the problem of deducing certain diseases or formulating a treatment based on more or less specified observations and knowledge. The diagnosis of disease is a significant and tedious task in medicine. The detection of heart disease from various factors or Symptoms is a multi-layered issue which is not free from false presumptions often accompanied by unpredictable effects. With the complexity of information available from health care domain, human intelligence alone is not good enough to ascertain the proper diagnosis. The problems associated with people involve in the diagnosis can considered broadly as (1) not having very high accuracy in decision (ii) shortage of expertise (iii) difficulties in knowledge up gradation (iv) time dependent performance as shown in fig. (1). Because of these problems there is necessity to develop the expert system to provide the assistance mechanism in diagnosis procedure. The conclusion is clear: humans can not ad hoc analyze complex data without errors. Intelligent systems are increasing being deployed in medicine and healthcare, to practically aid the busy clinician and to improve the quality of patient care [50][51][52][53][54][55][56]. The need for an objective methodology for evaluating such systems is widely recognized [52][53][57][58][59][60][61]. In medicine and healthcare where safety is critical, this is important if techniques such as medical expert systems and neural systems are to be widely accepted in clinical practice. Can neural networks help in this situation? Answer is yes. Artificial neural networks are computational paradigms based on mathematical models that unlike traditional computing have a structure and operation that resembles that of the mammal brain. Artificial neural networks or neural networks for short are also called connectionist systems or parallel distributed systems or adaptive systems, because they are composed by a series of interconnected processing elements that operate in parallel. Neural networks lack centralized control in the classical sense, since all the interconnected processing elements change or “adapt” Simultaneously with the flow of information and adaptive rules. Neural networks are being applied to an increasing large number of real world problems. Their primary advantage is that they can solve problems that are too complex for conventional technologies; problems that do not have an algorithmic solution or for which an algorithmic solution is too complex to be defined. In algorithmic approach, the computer follows a set of instructions
IJCSI International Journal of Computer Science Issues, Vol. 7, Issue 5, September 2010 ISSN (Online): 1694-0814 www.IJCSI.org
in order to solve a problem. Unless the specific steps that the computer needs to follow are known, the computer cannot solve the problem. That restricts the problem solving capability of conventional computers to problems that we are already understood and knows how to solve. In general, neural networks are well suited to problems that people are good at solving, but for which computers generally are not. These problems include pattern recognition and forecasting – which requires the recognition of trends in data. In case of neural network, even for imprecise inputs the network is able to retrieve the desired output or the data that is closest to the desired output. Considering the successful applicability of neural networks in many areas, an endeavor to assess their performance by providing the assistance in heart disease is the basis for this work. Artificial Neural Networks (ANNs) have been widely used as tool for solving many decisions modeling problems. The various capabilities and properties of ANN like Nonparametric, on-linearity, Input-Output Mapping, Adaptively make it a better alternative for solving massively parallel distributed structure and complex task in comparison of statistical techniques, where rigid assumption are made about the model. Artificial Neural Network being non-parametric, makes no assumption about the distribution of the data and thus capable of “letting the data speak for itself”. As a result, they are a natural choice for modeling complex medical problems when large databases of relevant medical information are available. The remaining sections of the paper are organized as follows: In Section 3, a brief review of some of the works on heart disease diagnosis is presented. A brief introduction about the feed forward neural architecture and its computing process is given in Section 4. In section 5, concept of genetic algorithms has given. Design of ANN learning based on GA presented in section 6. Result of various experiments and comparison contained by the section 7.Section 8 contain the analysis of tournament selection. The conclusions and future work are described in Section 9.
3. Previous work Numerous works in literature related with heart disease diagnosis have motivated our research Work. The necessity of effective identification of information -contextual data - non obvious and valuable for decision making from a large collection of data has been on a steady increase recently. This is an interactive and iterative process encompassing several subtasks and decisions and is known as Knowledge Discovery from Data. The central process
274
of Knowledge Discovery is the transformation of data into knowledge for decision making, known as Data Mining [20, 38]. Knowledge discovery in databases constitutes numerous distinct clearly illustrated processes.
Complication in diagnosis
Doctors
Advantage Active intelligent diagnosis
Time dependent performance
Replication of experts not possible
Knowledge up gradation is difficult
Difficult to establish multi variables relation
Not possible to deliver quantitative result
Fig.1. complexity in diagnosis with doctor
The central process belongs to data mining which aids in the recognition of hoarded yet beneficial knowledge from enormous databases. A widely accepted formal definition of data mining is given as “Data mining is the non trivial extraction of implicit previously unknown and potentially useful information about data” [22].Conventionally, the information that is mined is denoted as a model of the semantic structure of the dataset. In recent times, the data mining techniques are employed by numerous authors to propose diagnosis approaches for various kinds of heart diseases [32, 27, 38, 39, 40, 41]. A novel technique to develop the multi-parametric feature with linear and nonlinear characteristics of HRV (Heart Rate Variability) was proposed by Heon Gyu Lee et al. [32]. Statistical and classification techniques were utilized to develop the multiparametric feature of HRV. Besides, they have assessed the linear and the non-linear properties of HRV for three recumbent positions, to be precise the supine, left lateral and right lateral position. Numerous experiments were conducted by them on linear and nonlinear characteristics of HRV indices to assess several classifiers, e.g., Bayesian classifiers [35], CMAR (Classification based on Multiple Association Rules) [34], C4.5 (Decision Tree) [36]
IJCSI International Journal of Computer Science Issues, Vol. 7, Issue 5, September 2010 ISSN (Online): 1694-0814 www.IJCSI.org
and SVM (Support Vector Machine) [33]. SVM surmounted the other classifiers. A model Intelligent Heart Disease Prediction System (IHDPS) built with the aid of data mining techniques like Decision Trees, Naïve Bayes and Neural Network was proposed by Sellappan Palaniappan et al. [27]. The results illustrated the peculiar strength of each of the methodologies in comprehending the objectives of the specified mining objectives. IHDPS was capable of answering queries that the conventional decision support systems were not able to. It facilitated the establishment of vital knowledge, e.g. patterns, relationships amid medical factors connected with heart disease. IHDPS subsists well being web-based, user-friendly, scalable, reliable and expandable. The prediction of Heart disease, Blood Pressure and Sugar with the aid of neural networks was proposed by Niti Guru et al. [38]. Experiments were carried out on a sample database of patients’ records. The Neural Network is tested and trained with 13 input variables such as Age, Blood Pressure, Angiography’s report and the like. The supervised network has been recommended for diagnosis of heart diseases. Training was carried out with the aid of back propagation algorithm. Whenever unknown data was fed by the doctor, the system identified the unknown data from comparisons with the trained data and generates a list of probable diseases that the patient may vulnerable.
4. Feed forward architecture The type of Architecture implemented in the project is multiplayer Feed Forward architecture [62]. This neural network is formed in three layers, called the input layer, hidden layer, and output layer. Each layer consists of one or more nodes, represented in this diagram by the small circles. The lines between the nodes indicate the flow of information from one node to the next. In this particular type of neural network, the information flows only from the input to the output. The nodes of the input layer are passive, means they do not modify the data. They receive a single value as their input, and duplicate the value to their multiple outputs. In comparison, the nodes of the hidden and output layer are active. Each value from the input layer is duplicated and sent to all the hidden nodes. The values entering a hidden node are multiplied by weights; a set of predetermined number is stored in the program. The weighted inputs are then added to produce a single number. This is shown in the diagram by the symbol Σ. Before leaving the
275
node, this number is passed through a nonlinear mathematical function called Sigmoid. This is an “S” shaped curve that limits the node’s output. That is, the input to the sigmoid is a value between - ∞ to + ∞, while its output can only be between 0 and 1.The outputs from the hidden layer given to output nodes after multiplication with associated weight on that path. The active nodes of the output layer combine and modify the data to produce the output value of the network.
5. Genetic Algorithms 5.1 Fundamental concept Basic ideas on Genetic algorithms were first developed by John Holland, and are mainly used as search and optimization methods. Given a large solution space, one would like to pick out the point which optimizes an object function while still fulfilling a set of constraints. In network planning, a solution point could be a specific link topology, a routing path structure, or a detailed capacity assignment with minimum costs. Genetic algorithms are based on the idea of natural selection. In nature, the properties of an organism are determined by its genes. Starting from a random first generation with all kinds of possible gene structures, natural selection suggests that over the time, individuals with "good" genes survive whereas "bad" ones are rejected. Genetic algorithms try to copy this principle by coding the possible solution alternatives of a problem as a genetic string. The genes can be bits, integers, or any other type from which a specific solution can be deduced. It is required that all solution points can be represented by at least one string. On the other hand, a specific gene string leads to exactly one solution. A set of a constant number of gene strings, each characterizing one individual, is called a generation. Since the different strings have to be evaluated and compared to each other, the notion of fitness is introduced. The fitness value correlates to the quality of a particular solution. Instead of working with the actual solution itself, genetic algorithms operate on the respective string representation. The following three basic operators are applied :(i) Reproduction (ii)Crossover (iii) Mutation. The reproduction process creates a new generation, starting from an existing generation; strings are reproduced with a probability respective to their fitness value. Strings which represent solutions with good properties have a higher chance to survive than strings depicting solution points with bad characteristics. This principle is also known as "survival of the fittest”.
IJCSI International Journal of Computer Science Issues, Vol. 7, Issue 5, September 2010 ISSN (Online): 1694-0814 www.IJCSI.org
The crossover operator exchanges genetic information between two strings. The strings of two randomly selected solutions are broken up at randomly chosen position, and parts of the strings are exchanged. One hopes that two solutions with good properties create an even better one. New genetic material is introduced by the mutation operator. The values of individual genes are changed and hence, new solutions are chosen. Mutation becomes important when after some generations the number of different strings decreases because strong individuals start dominating. In a situation of strong dominance of few strings, the crossover operator alone would not bring any changes and the search for an optimal solution would be ended. To partially shift the search to new locations in the solution space, the mutation operator randomly alters genes.
5.2 Procedures for Implementation of Genetic Algorithms We start out with a randomly selected first generation. Every string in this generation is evaluated according to its quality, and a fitness value is assigned. Next, a new generation is produced by applying the reproduction operator. Pairs of strings of the new generation are selected and crossover is performed. With a certain probability, genes are mutated before all solutions are evaluated again. This procedure is repeated until a maximum number of generations are reached. While doing this, the all time best solution is stored and returned at the end of the algorithm.
6. Evolution of weights in neural network In recent times much research has been undertaken in the combination of two important and distinct areas: genetic algorithm and neural networks. Genetic algorithms attempt to apply evolutionary concept to the field of problem solving, notably function optimization and have proven to be valuable in searching large, complex problem spaces. Neural network are highly simplified models of the working of the brain. These consist of a combination of neurons and synaptic connections, which are capable of passing data through multiple layers. The end result is a system which is capable of pattern and classification. In the past, algorithm such as back propagation have been developed which refine one of the principle components of the neural networks: the connection weights. The system has worked well, but
276
is prone to becoming trapped in local optima and is incapable of optimization where problems lie in a multi-model or non-differentiable problem space. Genetic algorithms and neural networks can be combined such that populations of neural networks compete with each other in a Darwinian ‘survival of the fittest’ setting. Networks which are deemed to fit are combined and passed onto the next generation producing an increasingly fit population, so that after a number of iterations an optimized neural network can be obtained without resorting to a design by hand method. The evolution of neural networks can be classified according to the goals behind such evolution. Some schemes have proposed the evolution of weights with the fixed architecture. Other level of evolution where improve can be expected are the architecture ,transfer function etc.[yao].the primary motivation for using evolutionary technique to establish the weighting values rather than traditional gradient decent techniques such as back propagation lies in the inherent problems associated with gradient descent approaches. Back propagation in particular can become easily trapped in local maxima, ‘furthermore it is impossible for a back propagation algorithm to find the optimal solution if the function being optimized is multimodal or non differentiable [1].in addition it has been shown that back propagation is sensitive to the initial condition of the neural network causing additional problem.
6.1 Define Chromosome, Crossover & mutation operation to generate the offspring Initially a population of chromosomes created, contains the uniformly distributed generated random number. Chromosomes directly represented the weights of neural network, as shown in fig (6). Hence there is no need of any encoding mechanism in result. Crossover here can be defined as node crossover. From picked up two parents for generating off springs, any one active node from the set of hidden and output layer, pick up randomly with equal probability. This node is considered as a node of crossover. Values of all incoming weights for that particular node are exchanged with available other parent. Mutation can also be considered as node mutation, where in an offspring, all incoming weights
IJCSI International Journal of Computer Science Issues, Vol. 7, Issue 5, September 2010 ISSN (Online): 1694-0814 www.IJCSI.org
for a randomly picked up active node added with Gaussian distributed random numbers. These two process shown in fig(7)and in fig(8).
6.2. Objective function To get the fitness value of any chromosome, weights are extracted from that chromosome, which is reverse process of chromosome formulation. With the available inputs and above defined weights, architecture of neural network formed and output generated. From the output, error value is defined. Reciprocal of this error is taken as fitness value of that particular chromosome. i.e
Fitness = 1/error;
6.3. Algorithm for weights evolution by GA in ANN The following steps are taken for finding the optimal value of weights. (a) A population of µ parent solution ,i=1,…. µ,is initialized over a region M є . (b) Two parents selected randomly with uniform distribution from population of µ parents, and two offspring will created by crossover operator as shown in fig( 7) (c) Mutation on newly generated offspring will be applied as shown in fig (8). (d) Process from step (b) will repeated until equal to population of offspring µ,otherwise move to process (e) (e) Each parent solution , i=1,…. µ and ,o=1,…. µ,is scored in light of offspring the objective function ƒ(X). (f) A mixture population contains both parent population and offspring population created. This mixture population randomly shuffled so that parents and offspring could mix up properly. is (g) Each solution from evaluated against 10% of µ other randomly chosen solutions from the mix population .For each comparison a ‘win’ is assigned
277
if the solution’s score is less than or equal to that of its opponent. (h) The µ solutions with the greatest number of wins are retained to be parents of the next generation. (i) If the difference in the best chromosome for N number of continuous generation are less than the defined threshold value k, terminate the process and the last generation best chromosome is the optimal weights, otherwise proceed to step (b).
7. Experimental setup 7.1 Data set Data set has taken from publically available UCI repository [49]. Data set contains 270 patient’s record and each patient condition defined by 13 parameters, 150 patient’s record taken for training data set and remaining 120 for test data set.
7.2 Parameter setting ANN architecture size: No. of Input nodes=13; hidden nodes=2; output node=1; (a)Weights adjustment with gradient decent: Bias & momentum applied; Learning constant = 0.2; Momentum constant=0.1; (b)Weights adjustment with GA: Population size = 100, Initial range of random value definition: [-0.5 0.5] uniformly distributed; With the above defined parameters of neural network, architecture is created such that ten times independent training and test process repeated to capture more generalized capability for available data set. Training of neural network has given by back propagation learning[62] and genetic algorithm independently to have various parameters like True result (TR),False result(FR),True positive value (TP+) ,False positive value(FP+),True negative value (TN-) and false negative value(FN-).
7.3 Performance w.r.t gradient decent based training.
IJCSI International Journal of Computer Science Issues, Vol. 7, Issue 5, September 2010 ISSN (Online): 1694-0814 www.IJCSI.org
From the table (1) it is very clear, out of ten times, three times training could not happen properly. This is because of inherent limitation of gradient decent based algorithm to trap in local minima. The effect of training can easily see over the test data performance, in table (2).Suboptimal performance results shown in shaded rows. There is a question now: should this kind of learning algorithm acceptable for development of health care solution? Answer is definitely not, because whenever there is new data set available for up gradation, difficulties will appear. To overcome this kind of problem best option is evolutionary computation and this is the reason genetic algorithm has selected to find the optimal set of weights. Table (1): performance with gradient decent over training data set for 10 independent trails.
OVERALL TR FR 95.3333 4.6667 95.3333 4.6667 95.3333 4.6667 53.3333 46.666 94.0000 6.0000 53.3333 46.666 53.3333 46.666 94.0000 6.0000 95.3333 4.6667 94.6667 5.3333
(+VE)RESULT TPV FPV 8.5714 91.428 7.1429 92.857 7.1429 92.857 0 100.0 7.1429 92.857 0 100.0 0 100.0 7.1429 92.857 8.5714 91.428 8.5714 91.428
(-VE)RESULT TNV FNV 98.75 1.250 97.500 2.500 97.50 2.500 100.0 0 95.00 5.000 100.0 0 100.0 0 95.000 5.000 98.750 1.250 97.500 2.500
278
performance is very good but very consistence, which was lacking with the gradient decent learning
Table(3):performance with GA over training data set for 10 independent trail. OVERALL TR FR 92.666 7.333 92.666 7.333 90.000 10.00 94.666 5.333 90.666 9.333 94.666 5.333 94.000 6.000 94.000 6.000 94.666 5.333 94.000 6.000
(+VE)RESULT TPV FP 90.000 10.000 88.571 11.428 88.571 11.428 8.5714 91.428 88.571 11.428 8.5714 91.428 8.5714 91.428 90.000 10.000 8.5714 91.428 90.000 10.000
(-VE)RESULT TNV FN 95.000 5.000 96.250 3.750 91.250 8.750 97.500 2.500 92.500 7.500 97.500 2.500 96.250 3.750 97.500 2.500 97.500 2.500 97.500 2.500
Table (4): performance with GA over test data set for 10 independent trails. OVERALL TR FR 19.166 80.833 19.166 78.333 21.666 80.833 19.166 78.333 21.666 81.667 18.333 81.667 18.333 80.833 19.166 79.167 20.833 82.500 17.500
(+VE)RESULT TPV FPV 74.000 26.000 78.000 22.000 78.000 22.000 72.000 28.000 78.000 22.000 74.000 26.000 78.000 22.000 68.000 32.000 78.000 22.000 76.000 24.000
(-VE)RESULT TNV FNV 14.2857 85.714 17.1429 82.857 21.4286 78.571 12.8571 87.142 21.4286 78.571 12.8571 87.142 15.7143 84.285 10.0000 90.000 20.0000 80.000 12.8571 87.142
Table (2): performance with gradient decent over test data set for 10 independent trails. OVERALL TR FR 82.500 17.500 82.500 17.500 84.166 15.833 58.333 41.666 82.500 17.500 58.333 41.666 58.333 41.666 84.166 15.833 81.666 18.333 82.500 17.500
(+VE)RESULT TPV FPV 70.00 30.00 82.00 18.00 82.00 18.00 0 100.0 76.00 24.00 0 100.0 0 100.0 80.00 20.00 70.00 30.00 72.0 28.00
(-VE)RESULT TNV FNV 8.5714 91.428 17.1429 82.857 14.2857 85.714 100.0 0 12.8571 87.142 100.00 0 100.00 0 12.8571 87.142 10.0 90.000 90.00 10.00
7.4. Performance w.r.t Genetic algorithm based training Table (3) and Table (4) represent the performance over training and test data set for ten independent trails. From the result it’s very clear not only
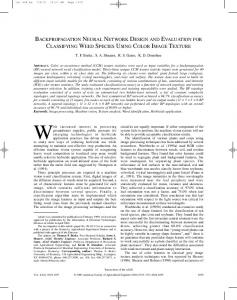
Fig.2. Error plot of population with learning Mean square Error plot of population with number of generation is shown in fig( 2).from the figure this is clear whole population is converging nearly same
IJCSI International Journal of Computer Science Issues, Vol. 7, Issue 5, September 2010 ISSN (Online): 1694-0814 www.IJCSI.org
279
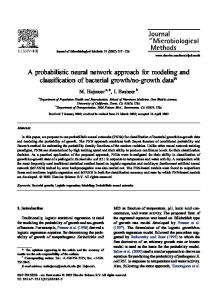
towards the final solution, as it was expected because initial solution generated from random numbers hence error value is high but with the generation improvement started to appear. Mean square of error for best chromosome along with the average error also plotted as shown in fig (3).
members for both domains counted in the every generation as shown in the table (5). From the table and plot it is very clear that more members coming from offspring population. This is true with each new generation developed in the process as shown in fig (5).This is an indication of generating the fitter offspring’s with time, hence diversity appears, at the same time more exploration of search space.
Fig.3. Error plot of best chromosome & average error of population with learning.
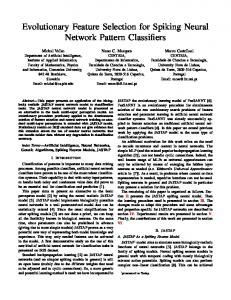
Fig.4. Best chromosomes distribution.
8 . Affect and analysis of tournament selection 8.1. Who gives better more? This is very first time ,analysis of tournament selection to know ,in creation of new generation with respect to competition who contributed more number of best chromosome in each generation for complete process. In other words parents population or offspring population dominant in producing best chromosome. To get the answer of this question in each generation, belonging domain of best chromosomes stored and counted. This will continue until process is not terminated. This is repeated for all ten independent trails. Contributed value by each domain plotted against each other .As it is shown from fig (4) and in table (5), no domain having the absolute dominancy for all trails. In conclusion each domain nearly contributed in same manner to produce the best at present, which is again supports the law available in nature. 8.2. Who is having more density: parent’s
population or offspring population? This is another very important question arise when tournament selection applied. Number of selected
Fig.5. chromosome density distribution
Table (5): performance with tournament selection over training data set for 10 independent trails. Chromo. density Parents offsprin 24387 25613 20647 21653 46855 49245 16865 17635 74162 78038 12733 13367 23099 24201 22348 23652 15168 15832 70090 73710
NO. of Best
parent 235 222 485 181 778 138 225 236 156 736
Chromos. offspring 265 201 476 164 744 123 248 224 154 702
IJCSI International Journal of Computer Science Issues, Vol. 7, Issue 5, September 2010 ISSN (Online): 1694-0814 www.IJCSI.org
b
a
1
c
280
d
3
2
4
w1a w1b w1c w1d w11 w12 w13 w14
W2a w2b w2c w2d
W3a w3b w3c w3d W31 w32 w33 w34
W41 w42 w43
Fig (6). Chromosome development
a
b
1
c
d
5
3
2
b
a
w11 w12 w13 w14 w1a w1b w1c w1d
W21 w22 w23 w24 W2a w2b w2c w2d
W51 w52 w53 w54 W5a w5b w5c w5d
6
d
7
8
4
CROSSOVER
c
W31 w32 w33 w34 W3a w3b w3c w3d
W61 w62 w63 w64 W6a w6b w6c w6d
W41 w42 w43
W7a w7b w7c w7d W71 w72 w73 w74
W85 w86 w87 W81 w82 w83
Offspring
w1a w1b w1c w1d
W6a w6b w6c w6d
W5a w5b w5c w5d
W3a w3b w3c w3d
W2a w2b w2c w2d
W41 w42 w43
W7a w7b w7c w7d
W85 w86 w87
Fig. (7) Crossover operation
IJCSI International Journal of Computer Science Issues, Vol. 7, Issue 5, September 2010 ISSN (Online): 1694-0814 www.IJCSI.org
281
[N (0,1) N(0,1) N(0,1) ]
+
MUTATION (OFFSPRING 1) w11 w12 w13 w14
W61 w62 w63 w64 W21 w22 w23 w24
W31 w32 w33 w34
[N (0, 1), N (0,1), N(0,1) ,N(0,1)] +
MUTATION (OFFSPRING 2)
W51 w52 w53 w54
W41 w42 w43
W21 w22 w23 w24
W71 w72 w73 w74
W81 w82 w83
Fig (8): mutation operation
9. Conclusions A new insight about problem and requirement associated with health care solution has presented. To develop the intelligent solutions, support for artificial neural network has shown. Most of the developed solution utilized the feed forward architecture and back propagation as a learning algorithm. Because of trapping tendency in local minima, problem may appear at the time of up gradation and in result no consistency in result. To overcome this problem a new way, genetic algorithm has applied for training purpose. Untold and unseen side of tournament selection has discovered. This will give a new meaning to understand the selection method. The primary intent of our research is to design and develop a model and design efficient approach for detection of heart disease, which can be utilized for real world applications as a computer aided diagnostic tool. With the presented research, in future we are going to develop an expert system for heart disease detection References: [1] "Hospitalization for Heart Attack, Stroke, or Congestive Heart Failure among Persons with Diabetes", Special report:2001 – 2003, New Mexico. [2] Chen, J., Greiner, R.: Comparing Bayesian Network Classifiers. In Proc. of UAI-99, pp.101–108 ,1999. [3] "Heart Disease" from http://chineseschool. netfirms.com/heart-disease-causes.html [4]. Reddy, K. S., India wakes up to the threat of cardiovascular diseases. J. Am. Coll. Cardiol., 2007, 50, 1370–1372. [5]. WHO India, http://www.whoindia.org/EN/Index.htm (accessed on 11 February 2008).
[6]. Reddy, K. S., Shah, B., Varghese, C. and Ramadoss, A. Responding to the threat of chronic diseases in India. Lancet, 2005, 366,1744–1749. [7]. Mohan, V., Sandeep, S., Deepa, R., Shah, B. and Varghese, C.,Epidemiology of type 2 diabetes: Indian scenario. Indian J. Med.Res., 2007, 125, 217–230. [8]. Kearney, P. M., Whelton, M., Reynolds, K., Muntner, P., Whelton,P. K. and He, J., Global burden of hypertension: analysis of worldwide data. Lancet, 2005, 365, 217–223. [9]. Reddy, K. S., Naik, N. and Prabhakaran, D., Hypertension in the developing world: a consequence of progress. Curr. Cardiol.Rep., 2006, 8, 399–404. [10]. WHO Global Report 2005, Preventing chronic diseases: A vitalinvestment, 2005. [11]. Teoh, M., Lalondrelle, S., Roughton, M., GrocottMason, R. andDubrey, S. W., Acute coronary syndromes and their presentation in Asian and Caucasian patients in Britain. Heart, 2007, 93, 183–188. [12]. Qiao, Q. et al., Age- and sex-specific prevalence of diabetes and impaired glucose regulation in 11 Asian cohorts. Diabetes Care,2003, 26, 1770–1780. [13]. Reddy, K. S. et al., Educational status and cardiovascular risk profile in Indians. Proc. Natl. Acad. Sci. USA, 2007, 104, 16263–16268 [14]. Pais, P. et al., Risk factors for acute myocardial infarction in Indians: a case-control study. Lancet, 1996, 348, 358–363.[15]. Reddy, K. S. et al., Collaborative study of coronary heart disease,ICMR Taskforce Study number 1988-0608A, 1996. [16]. Gupta, D. K., Verma, L. K., Khosla, P. K. and Dash, S. C., The prevalence of microalbuminuria in diabetes: a study from NorthIndia. Diabetes Res. Clin. Practice, 1991, 12, 125–128. [17]. Rastogi, T. et al., Diet and risk of ischemic heart disease in India.Am. J. Clin. Nutr., 2004, 79, 582–592.
IJCSI International Journal of Computer Science Issues, Vol. 7, Issue 5, September 2010 ISSN (Online): 1694-0814 www.IJCSI.org [18]. Joshi, R. et al., Chronic diseases now a leading cause of death in rural India – mortality data from the Andhra Pradesh Rural Health Initiative. Int. J. Epidemiol., 2006, 35, 1522–1529. [19] Sally Jo Cunningham and Geoffrey Holmes, "Developing innovative applications in agriculture using data mining", In the Proceedings of the Southeast Asia Regional Computer Confederation Conference, 1999. [20] Frank Lemke and Johann-Adolf Mueller, "Medical data analysis using self-organizing data mining technologies,"Systems Analysis Modelling Simulation , Vol. 43 , no. 10 ,pp: 1399 - 1408, 2003. [21] Tzung-I Tang, Gang Zheng, Yalou Huang, Guangfu Shu,Pengtao Wang, "A Comparative Study of Medical Data Classification Methods Based on Decision Tree and System Reconstruction Analysis", IEMS Vol. 4, No. 1, pp. 102-108,June 2005. [22] Frawley and Piatetsky-Shapiro, Knowledge Discovery in Databases: An Overview. The AAAI/MIT Press, Menlo Park, C.A, 1996. [23] Hsinchun Chen, Sherrilynne S. Fuller, Carol Friedman, and William Hersh, "Knowledge Management, Data Mining,and Text Mining In Medical Informatics", Chapter 1, pgs 3-34 [24] S Stilou, P D Bamidis, N Maglaveras, C Pappas , Mining association rules from clinical databases: an intelligent diagnostic process in healthcare. Stud Health Technol Inform 84: Pt 2. 1399-1403, 2001. [25] T Syeda-Mahmood, F Wang, D Beymer, A Amir, M Richmond, SN Hashmi, "AALIM: Multimodal Mining for Cardiac Decision Support", Computers in Cardiology,pages:209-212, Sept. 30 2007-Oct. 3 2007 [26] Anamika Gupta, Naveen Kumar, and Vasudha Bhatnagar,"Analysis of Medical Data using Data Mining and Formal Concept Analysis", Proceedings Of World Academy Of Science, Engineering And Technology ,Volume 6, June 2005,. [27] Sellappan Palaniappan, Rafiah Awang, "Intelligent Heart Disease Prediction System Using Data Mining Techniques",IJCSNS International Journal of Computer Science andNetwork Security, Vol.8 No.8, August 2008 [28] Andreeva P., M. Dimitrova and A. Gegov, Information Representation in Cardiological Knowledge Based System, SAER’06, pp: 23-25 Sept, 2006. [29] Latha Parthiban and R.Subramanian, "Intelligent Heart Disease Prediction System using CANFIS and Genetic Algorithm", International Journal of Biological, Biomedical and Medical Sciences 3; 3, 2008 [30] Hian Chye Koh and Gerald Tan ,"Data Mining Applications in Healthcare", Journal of healthcare information management, Vol. 19, Issue 2, Pages 64-72, 2005. [31] L. Goodwin, M. VanDyne, S. Lin, S. Talbert ,“Data mining issues and opportunities for building nursing knowledge”Journal of Biomedical Informatics, vol:36, pp: 379-388,2003. [32] Heon Gyu Lee, Ki Yong Noh, Keun Ho Ryu, “Mining Biosignal Data: Coronary Artery Disease Diagnosis using Linear and Nonlinear Features of HRV,” LNAI 4819: Emerging Technologies in Knowledge Discovery and Data Mining, pp. 56-66, May 2007.
282
[33] Cristianini, N., Shawe-Taylor, J.: An introduction to Support Vector Machines. Cambridge University Press, Cambridge ,2000. [34] Li, W., Han, J., Pei, J.: CMAR: Accurate and Efficient Classification Based on Multiple Association Rules. In: Proc. of 2001 Interna’l Conference on Data Mining .2001. [35] Chen, J., Greiner, R.: Comparing Bayesian Network Classifiers. In Proc. of UAI-99, pp.101–108 ,1999. [36] Quinlan, J.: C4.5: Programs for Machine Learning. Morgan Kaufmann, San Mateo 1993. [37] M. Chen, J. Han, and P. S. Yu. Data Mining: An Overview from Database Perspective. IEEE Trans. Knowl. Dat. Eng., vol: 8, no:6, pp: 866-883, 1996. [38] Niti Guru, Anil Dahiya, Navin Rajpal, "Decision Support System for Heart Disease Diagnosis Using Neural Network", Delhi Business Review , Vol. 8, No. 1 (January June 2007. [39] Carlos Ordonez, "Improving Heart Disease Prediction Using Constrained Association Rules," Seminar Presentation at University of Tokyo, 2004. [40] Franck Le Duff , Cristian Munteanb, Marc Cuggiaa, Philippe Mabob, "Predicting Survival Causes After Out of Hospital Cardiac Arrest using Data Mining Method", Studies in health technology and informatics ,107(Pt 2):1256-9, 2004. [41] Boleslaw Szymanski, Long Han, Mark Embrechts, Alexander Ross, Karsten Sternickel, Lijuan Zhu, "Using Efficient Supanova Kernel For Heart Disease Diagnosis", proc. ANNIE 06, intelligent engineering systems through artificial neural networks, vol. 16, pp:305-310, 2006. [42] Kiyong Noh, Heon Gyu Lee, Ho-Sun Shon, Bum Ju Lee, and Keun Ho Ryu, "Associative Classification Approach for Diagnosing Cardiovascular Disease", springer,Vol:345 , pp: 721-727, 2006. [43] A. Bellaachia and Erhan Guven, Predicting Breast Cancer Survivability using Data Mining Techniques , Ninth Workshop on Mining Scientific and Engineering Datasets in conjunction with the Sixth SIAM International Conference on Data Mining (SDM 2006), Saturday, April 22, 2006. [44] Abdelghani Bellaachia and David Portnoy, E-CAST: A Data Mining Algorithm for Gene Expression Data , 2nd Workshop on Data Mining in Bioinformatics at the 8th ACM SIGKDD International Conference on Knowledge Discovery and Data Mining, Edmonton, Alberta, Canada, July 23rd, 2002. [45] KS Leung,YT Ng, KH Lee, LY Chan, KW Tsui, Tony Mok, CH Tse, Joseph Sung, "Data Mining on DNA Sequences of Hepatitis B Virus by Nonlinear Integrals" Proceedings Taiwan-Japan Symposium on Fuzzy Systems &Innovational Computing, 3rd meeting, pp.1-10 Aug 2006, Japan. [46] Florin Gorunescu, "Data Mining Techniques in Computer-Aided Diagnosis: Non-Invasive Cancer Detection,"International Journal of Bioengineering, Biotechnology andNanotechnology, vol.1, no.2, pp.105 108, 2008. [47] Fu-ren Lin, Shien-chao Chou, Shung-mei Pan, Yaomei Chen, “Mining time dependency patterns in clinical pathways”, International Journal of Medical Informatics, 2001.
IJCSI International Journal of Computer Science Issues, Vol. 7, Issue 5, September 2010 ISSN (Online): 1694-0814 www.IJCSI.org [48] Margaret R. Kraft, Kevin C. Desouza, Ida Androwich (2002).“Data Mining in Healthcare Information Systems: Case Study of a Veterans’ Administration Spinal Cord Injury Population”, Proceedings of the 36th Hawaii International Conference on System Sciences (HICSS’03). [49] Heart attack dataset from http://archive.ics.uci.edu/ml/datasets/Heart+Disease. [50] J. M. Garibaldi, E. C. Ifeachor, ‘Application of Simulated Annealing Fuzzy Model Tuning to Umbilical Cord Acid–Base Interpretation’,IEEE Transactions on Fuzzy Systems, Vol.7, No.1, pp.72–84, 1999 [51] J. W. Huang, Y. Lu, A. Nayak and R. J. Roy, ‘Depth of Anesthesia Estimation and Control’, IEEE Transactions on Biomedical Engineering.Vol.46, No.1, pp.71–81, 1999. [52] D. A. Cairns, J. H. L. Hansen and J. E. Riski, ‘A Noninvasive Technique for Detecting Hypernasal Speech Using a Nonlinear Operator’,IEEE Transactions on Biomedical Engineering, vol.43, no.1,pp.35–45, 1996. [53] K. P. Adlassnig and W. Scheithauer, ‘Performance evaluation of medical expert systems using ROC curves’, Computers and Biomedical Research, Vol.22, No.4, pp.297–313, 1989. [54] L. G. Koss, M. E. Sherman, M. B. Cohen, A. R. Anes, T. M. Darragh,L. B. Lemos, B. J. McClellan, D. L. Rosenthal, S. Keyhani–Rofagha,K. Schreiber, P. T. Valente, ‘Significant Reduction in the Rate of False Negative Cervical Smears With Neural Network–Based Technology (PAPNET Testing System), Human Pathology, Vol 28, No 10,pp.1196–1203, 1997. [55] S. Andreassen, A. Rosenfalck, B. Falck, K. G. Olesen, S. K. Andersen,‘Evaluation of the diagnostic performance of the expert EMGassistant MUNIN’, Electroencephalography and clinical Neurophysiology, Vol 101, pp.129–144, 1996. [56] B. V. Ambrosiadou, D. G. Goulis, C. Pappas, ‘Clinical evaluation of the DIABETES expert system for decision support by multiple regimen insulin dose adjustment’, Computer Methods and Programs in Biomedicine, Vol.49, pp.105–115, 1996. [57] H. D. Cheng, Y. M. Lui, R.I. Freimanis, ‘A novel approach to microcalcification detection using fuzzy logic technique’, IEEE Transactions on Medical Imaging, Vol.17, No.3, pp.442–450, 1998. [58] R. D. F. Keith, S. Beckley, J.M. Garibaldi, J.A. Westgate, E.C. Ifeachor,K. R. Green, ‘A multicentre comparative study of 17 experts and an intelligent computer system for managing labour using the cardiotocogram’,British Journal Obstrtrics Gynaecology, Vol.102,pp.688–700, 1995. [59] J. A. Swets, ‘Measuring the Accuracy of Diagnostic Systems’,Science, Vol.240, pp.1285–1293, 1988.21 [60] K. Clarke, R. O’Moore, R. Smeets, J. Talmon, J. Brender, P. McNair,P. Nykanen, J. Grimson, B. Barber, ‘A methodology for evaluation of Knowledge–based systems in medicine’, Artifical Intelligence in Medicine, Vol.6, pp.107–121, 1994. [61] R. Engelbrecht, A. Rector, W. Moser, ‘Verification and Validation’, in‘Assessment and Evaluation of Information Technologies’, E. M. S. J.van Gennip, J. L. Talmon, Eds, IOS Press, pp.51–66, 1995.
283
[62] M.k.singh,’password based a generalized robust security system design using neural network’, IJCSI,vol4,No.9,pp.1-9,2009. 1
K.S.Kavitha presently working as assistant professor & HOD of computer & information engineering in Auden Technology and management academy. She is also a Ph.D scholar in ANNA University, Coimbatore, India. Her field of research includes Artificial intelligence, ANN, Evolutionary computation and data mining.
2
K.V.Ramakrishnan presently working as a professor & dean of C.M.R. Institute of technology, Bangalore, India
3
Manoj kr. Singh, Currently holding the post of director in Manuro tech. research. He is also actively associated with industry as technology consultant & guiding several research scholars. He is having background of R&D in Nanotechnology, VLSI‐CAD, Evolutionary computation, Neural network, Advanced signal processing etc.