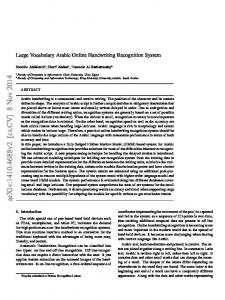
digitally describe images usually capture little information about the .... orderless document representation, in which each document is depicted by a vector of ...... soccer ball flamingo flamingo snoopy stop sign flamingo head flamingo head.
Semantic-enriched Visual Vocabulary Construction in a Weakly Supervised Context Marian-Andrei R IZOIU1
Julien V ELCIN
St´ephane L ALLICH {firstname.lastname}@univ-lyon2.fr Abstract
arXiv:1512.04605v1 [cs.CV] 14 Dec 2015
One of the prevalent learning tasks involving images is content-based image classification. This is a difficult task especially because the low-level features used to digitally describe images usually capture little information about the semantics of the images. In this paper, we tackle this difficulty by enriching the semantic content of the image representation by using external knowledge. The underlying hypothesis of our work is that creating a more semantically rich representation for images would yield higher machine learning performances, without the need to modify the learning algorithms themselves. The external semantic information is presented under the form of non-positional image labels, therefore positioning our work in a weakly supervised context. Two approaches are proposed: the first one leverages the labels into the visual vocabulary construction algorithm, the result being dedicated visual vocabularies. The second approach adds a filtering phase as a pre-processing of the vocabulary construction. Known positive and known negative sets are constructed and features that are unlikely to be associated with the objects denoted by the labels are filtered. We apply our proposition to the task of content-based image classification and we show that semantically enriching the image representation yields higher classification performances than the baseline representation. Keywords bag-of-features representation; visual vocabulary construction; semantic-enriched representation; image numerical representation; semi-supervised learning.
1 Corresponding author. ERIC Laboratory, University Lumi`ere Lyon 2 Address: 5, avenue Pierre Mend`es France, 69676 Bron Cedex, France Tel. +33 (0)4 78 77 31 54 Fax. +33 (0)4 78 77 23 75
1
1
Introduction
The large scale production of image data has been facilitated in modern days by the maturing of the image acquisition, storing, transmission and reproduction devices and techniques. The Web 2.0 allowed easy image sharing and recently even search capabilities (e.g., Instagram2 , Flickr3 ). Social Networks rely heavily on image sharing. Because of the sheer volumes of created images, automatic summarization, search and classification methods are required. The difficulty when analyzing images comes from the fact that digital image numerical formats poorly embed the needed semantic information. For example, images acquired using a digital photo camera are most often stored in raster format, based on pixels. A pixel is an atomic image element, which has several characteristics, the most important being the size (as small as possible) and its color. Other information can be color coding, alpha channel etc.. Therefore, an image is stored numerically as a matrix of pixels. The difficulty raises from the fact that low-level features, such as position and color of individual pixels, do not capture too much information about the semantic content of the image (e.g., shapes, objects). This problem is also known as the semantic gap between the numerical representation of the image and its intended semantics. To address this issue, multiple representation paradigms have been proposed, some of which will be presented in Section 2. The one showing the most promising results is the “bag-of-features” representation, a representation inspired from the textual “bag-of-words” textual representation. Whatsoever, the results obtained by the state-of-the-art image representations still leave plenty of room for improvements. One of the privileged tracks to closing the semantic gap is to take into account additional information stored in other types of data (e.g., text, labels, ontologies of concepts) associated with the images. With today’s Web, additional information of this type is often available, usually created by anonymous contributors. Our work presented in this paper is targeted towards improving a baseline, unsupervised, image description strategy by rendering it semi-supervised, in order to take into account user-generated additional information. The purpose is to capture more of the semantics of an image in its numerical description and to improve the performances of an image-related machine learning task. An overview of our proposals The focus of the work is embedding semantic information into the construction of image numerical representation. The task of contentbased image classification is used only to assess the validity of our proposals. The content-based image classification literature provides examples (some of which are mentioned in Section 2) of systems which achieve good results. Our objective is not to compare with these approaches or show the superiority of our methods on well-known image benchmarks. Neither we do not propose a new image representation system. The objective of our work is to show how embedding semantics into an existing image representation can be beneficial for a learning task, in this case image classification. Starting from the baseline image representation construction present in Section 1.1, we propose two algorithms that make use of external information to enrich the semantics of the image representation. The external information is under the form of non-positional labels, which signal the presence in the image of an object (e.g., car, motorcycle) or give information about the context of the image (e.g., holiday, evening), but do not give 2 http://instagram.com/ 3 http://www.flickr.com/
2
any information about its position of the image (in the case of objects). Furthermore, the labels are available only for a part of the image collection, therefore positioning our work in a semi-supervised learning context. We use both the baseline representation and our semantically improved representation in an image classification task and we show that leveraging semantics consistently provides higher scores. Our work is focused on the visual vocabulary construction (which is also referred in the literature as codebook or model). In the “bag-of-features” (BoF) representation, the visual words serve a similar role as the real textual words do in the “bag-of-words” representation. We propose two novel contributions that leverage external semantic information and that allow the visual vocabulary to capture more accurately the semantics behind a collection of images. The first proposal deals with introducing the provided additional information early in the creation of the visual vocabulary. A dedicated visual vocabulary is constructed starting from the visual features sampled from images labeled with a given label. Therefore, a dedicated vocabulary contains visual words adapted to describing the object denoted by the given label. In the end, the complete visual vocabulary is created by merging the dedicated vocabularies. In the second proposal, we add a filtering phase as a pre-processing of the visual vocabulary construction. This reduces the influence of irrelevant features on the visual vocabulary construction, thus enabling the latter to be more adapted to describe the semantics of the collection for images. For any given image, we construct a known positive set (images labeled with the same labels as the given image) and a known negative set (images that do not share any labels with the given image). If a visual feature, sampled from the target image, is more similar to features in the known negative set than to features in the known positive set, then there are high chances that it does not belong to the objects denoted by the labels of the given image and it can, therefore, be eliminated. As our experiments in Section 4.5 show, this approach increases the overall accuracy of the image-related learning task. The two approaches are combined into a visual vocabulary construction technique and shown to consistently provide better performances than the baseline technique presented in Section 1.1. The layout of this article The remainder of this paper is structured as follows: the rest of this section presents how to construct a baseline “bag-of-features” image description (in Section 1.1). In Section 2, we present a brief overview on constructing a numerical image representation, concentrating on some of the state-of-the-art papers that relate to visual vocabulary construction and knowledge injection into image representation. Section 3 explains our two proposals, followed, in Section 4, by the experiments that were performed. Some conclusions are drawn and future work perspectives are given in Section 5.
1.1
Baseline “bag-of-features” image numerical description
The “bag-of-features” [9, 57] (BoF) representation is an image representation inspired from the “bag-of-words” (BoW) textual representation. The BoW representation is an orderless document representation, in which each document is depicted by a vector of frequencies of words over a given dictionary. BoF models have proven to be effective for object classification [9, 55], unsupervised discovery of categories [12, 47, 49] and video retrieval [6, 50]. For object recognition tasks, local features play the role of “visual words”, being predictive of a certain “topic” or object class. For example, a wheal is highly predictive of a bike being present in the image. If the visual dictio-
3
nary contains words that are sufficiently discriminative when taken individually, then it is possible to achieve a high degree of success for whole image classification. The identification of the object class contained in the image is possible without attempting to segment or localize that object, simply by looking which visual words are present, regardless of their spatial layout. Overall, there is an emerging consensus in recent literature that BoF methods are effective for image description [57].
Image Dataset
Image Sampling
Feature Description
1
2
Visual Vocabulary Construction
3
Assign Features to Visual Words
4
“Bag-offeatures” representation
Figure 1: Construction flow of a “bag-of-features” numerical representation for images
Baseline construction Typically, constructing a BoF image representation is a four phase process, as shown in Figure 1. Starting from a collection P containing n images, the purpose is to translate the images into a numerical space, in which the learning algorithm is efficient. In phase 1, each image pi ∈ P is sampled and li patches (features)4 are extracted. Many sampling techniques have been proposed, the most popular being dense grid sampling [12, 53] and salient keypoint detector [9, 12, 49]. In phase 2, using a local descriptor, each feature is described using a h-dimensional5 vector. The SIFT [32] and the SURF [2] descriptors are popular choices. Therefore, after this phase, each image pi is numerically described by Vi ⊂ Rh , the set of h-dimensional vectors describing features sampled from pi . Based on these numeric features, in phase 3, a visual vocabulary is constructed using, for example, one of the techniques presented in Section 2.2. This is usually achieved by means of clustering of the described features, and the choice is usually the K-Means clustering algorithm, for its linear execution time required by the high number of features. The visual vocabulary is a collection of m visual words, which are described in the same numerical space as the features and which serve as the bases of the numerical space in which the images are translated. More precisely, the centroids created by the clustering algorithm serve as visual words. In clustering, centroids are the abstractions of a group of documents, therefore summarizing the common part of the documents. In the above example, all the visual features extracted from the region of an image depicting the wheal of a bike will be regrouped together into one or several clusters. The centroid of each cluster represents a visual word, which is associated with the wheal. Figure 2, we depict three examples of images portraying bikes. In each image, we highlight 3 features: two corresponding to visual words associated with “wheal” and one associated with a visual word associated with ”exhaust pipe”. In phase 4, each sampled feature is assigned to a visual word. Similarly to the BoW numerical description for texts, each image is described as a distribution over the visual words, using one of the term weighting scheme (e.g., tf , tf xidf etc.). In the previous example, the distribution vector associated with each of the images in Figure 2 has a high count for the visual words associated with “wheal”, “exhaust pipe”, and “sadle”. 4 l is dependent on the content on the image (number of objects, shape etc.) and the extraction algorithm i used. It can vary from a couple of hundreds of features up to several tens of thousands. 5 e.g. for the SIFT descriptor h = 128.
4
(a)
(b)
(c)
Figure 2: Example of feature corresponding to the visual words associated with “wheal” (in red) and “exhaust pipe” (in green) The resulting numerical description can then be used for classification, information retrieval or indexation tasks.
2
Context and related work
Over the past decades computer vision domain has seen a large interest from the research community. Its application are larger than image analysis and include augmented reality, robotic vision, gesture recognition etc. Whatsoever, in the context of Internet-originating images, one of the prevailing task is content-based image classification. Some of the initial image classification systems used color histograms [51] for image representation. Such a representation does not retain any information about the shapes of objects in images and obtains moderate results. Other systems [16, 26, 35, 52] rely on texture detection. Texture is characterized by the repetition of basic elements or textons. For stochastic textures, it is the identity of the textons, not their spatial arrangement, that matters. The BoF orderless representation has imposed itself as the state-of-the-art in image representation, for classification and indexation purposes. The process of constructing the representation includes sampling the image (phase 1 in Figure 1), describing each features using an appearance-based descriptor (phase 2), constructing a visual vocabulary (phase 3) and describing images as histograms over the visual words (phase 4). The remainder of this section presents a brief overview (i) of the sampling strategies and numerical descriptors for image keypoints present in literature (in Section 2.1) and (ii) of the visual vocabulary construction techniques, concentrating on how external information can be used to improve the vocabularies representativity (in Section 2.2).
2.1
Sampling strategies and numerical description of image features
Image sampling methods Image sampling for the BoF representation is the process of deciding which regions of a given image should be numerically described. In Figure 1, it corresponds to phase 1 of the construction of a BoF numerical representation. The output of feature detection is a set of patches, identified by their locations in the image and their corresponding scales and orientations. Multiple sampling methods exist [43], including Interest Point Operators, Visual Saliency and random or dense grid sampling. Interest Point Operators [22, 31] search to find patches that are stable under minor
5
affine and photometric transformations. Interest point operators detect locally discriminating features, such as corners, blob-like regions, or curves. A filter is used to detect these features, measuring the responses in a three dimensional space. Extreme values for the responses are considered as interest points. The popular choice is the HarrisAffine detector [37], which uses a scale space representation with oriented elliptical regions. Visual Saliency [14] feature detectors are based on biomimetic computational models of the human visual attention system. Less used by the BoF literature, these methods are concerned with finding locations in images that are visually salient. In this case, fitness is often measured by how well the computational methods predict human eye fixations recorded by an eye tracker. There are research [50] that argue that interest point-based patch sampling, while useful for image alignment, is not adapted for image classification tasks. Examples are city images, for which the interest point detector does not consider relevant most of the concrete and asphalt surroundings, but which are good indicators of the images’ semantics. Some approaches sample patches by using random sampling [33]. [42] compare a random sampler with two interest point detectors: Laplacian of Gaussian [28] and Harris-Laplace [25]. They show that, when using enough samples, random sampling exceeds the performance of interest point operators. Spatial Pyramid Matching, proposed in [27], introduces spacial information in the orderless BoF representation by creating a pyramid representation, where each level divides the image in increasingly small regions. Feature histogram is calculated for each of these regions. The distance between two images using this spatial pyramid representation is a weighted histogram intersection function, where weights are largest for the smallest regions. Feature descriptors With the image sampled and a set of patches extracted, the next questions is how to numerically represent the neighborhood of pixels near a localized region. In Figure 1, this corresponds to phase 2 of the construction of a BoF numerical representation. Initial feature descriptors simply used the pixel intensity values, scaled for the size of the region. The normalized pixel values have been shown [12] to be outperformed by more sophisticated feature descriptors, such as the SIFT descriptor. The SIFT (Scale Invariant Feature Transform) [32] descriptor is today’s most widely used descriptor. The responses to 8 gradient orientations at each of 16 cells of a 4x4 grid generate the 128 components of the description vector. Alternative have been proposed, such as the SURF (Speeded Up Robust Features) [2] descriptor. The SURF algorithm contains both feature detection and description. It is designed to speed up the process of creating features similar to those produced by a SIFT descriptor on HessianLaplace interest points by using efficient approximations.
2.2
Unsupervised visual vocabulary construction
The visual vocabulary is a mid-level transition key between the low-level features and a high-level representation. It is a prototypic representation of features that are discriminative in a classification context. The visual vocabulary is used to reduce dimensionality and to create a fixed length numerical representation for all images6 . Most BoF approaches use clustering to created the visual vocabulary, usually the K-Means [19, 27, 50] algorithm. K-Means is used for the fact that it produces centroids, which are prototypes of similar features in 6 The number of extracted features can greatly vary depending on the image and the method used for sampling.
6
the same cluster. Its linear execution time is a plus considering the high volume of individuals to be processed [46]. Some authors [21] argument that in K-Means, centroids are attracted by dense regions and under-represent less denser, but equally informative regions. Therefore, methods were proposed for allocating centers more uniformly, inspired by mean shift [7] and on-line facility location [36]. Other visual vocabulary construction techniques do not rely on K-Means. For example, [40] use an Extremely Randomized Clustering Forest, an ensemble of randomly created clustering trees. This technique provides good resistance to background clutter, but the main advantage over K-Means is the faster training time. One of the most important parameters in the construction of the visual vocabulary is its dimension, which has a powerful impact on both performance and computational complexity [9, 21]. It has been shown [19, 30, 42] that a large vocabulary may lead to overfitting for construction techniques based on interest points detection. As our experiments show (in Section 4.6), even a random vocabulary (in a random vocabulary, a number of features are randomly chosen to serve as visual words) can lead to overfitting if its dimension is high enough.
2.3
Leveraging additional information
The BoF representation yields surprising results for image classification and indexing. This is because there is an intrinsic relation between the “quantity” of semantic information captured by the description space and the performances of machine learning algorithms (e.g., in a classification task, the separability of individuals in the description space is crucial). Therefore, one direction to further improve results is to construct new representations that capture even more semantics from the raw image data. Another direction, the one that we privilege in our work, is to use external information to further enrich the semantic content of the constructed representation. In the case of Internet-originating images, precious information is given either by the textual context of images (e.g., titles, descriptions etc.), or by labels attached to the images (e.g., on social networks websites, users have the option to label the presence of their friends in images). Of course, the literature presents approaches that leverage other resources to semantically enrich enrich the image representation (e.g., [1] propose a system that links low-level visual descriptors to high-level, domain-specific concepts in an ontology). In the following paragraphs, we detail some of the methods present in the literature that address the use of additional information under the form of text or labels in order to improve image classification results and we position our work relative to these approaches. Leveraging the image’s textual context In [41], the text that comes alongside the images is used to improve the visual query accuracy. A BoF representation for images is created as shown in Section 1.1, with the exception that color information is also added to the keypoint description. An 11-dimension vector coding the color information of the sampled patches is added to the 128-dimension vector generated by the SIFT. The text that surrounds the images in the web pages is used to extract topics, using LDA [3]. The inferred topics are, afterwards, used to describe the textual information (therefore functioning as a dimension reduction technique). The textual and the image data are used together to estimate the parameters of a probabilistic graphical model, which is trained using a small quantity of labeled data. Another approach that uses the text accompanying images originating from the Internet is presented in [54].
7
An auxiliary collection of Internet-originating images, with text attached, is used to create a textual description of a target image. Images are described using three types of features: the SIFT features, the GIST features [44] and local patch color information. For each test image, the K most similar images (in terms of visual features) are identified in the auxiliary collection. The text associated with these near neighbor images is summarized to build the text feature. The label of each image is considered as a unit (i.e., a whole phrase is considered as an item) and the text feature is constructed as a normalized histogram over labels. A text classifier and a visual classifier are trained and the outputs of the two classifiers are merged for a more accurate description of the photo. [39] use co-training [4] to construct a classifier starting from textual and visual data. Text is described using a BoW representation, whereas images are described using region-based features. Each image is divided into a number of regions of fixed dimension (4-by-6 pixels), which are described using texture and color features. Co-training is a semi-supervised classification technique, which first learns a separate classifier for textual data and image data, using any labeled examples. The most confident predictions of each classifier on the unlabeled data are then used to iteratively construct additional labeled training data, and the classifiers are re-trained. Leveraging external semantic knowledge Other solutions rely on external expert knowledge in order to guide the visual vocabulary construction. This knowledge is most often expressed under the form of class/category annotations or labels (e.g. signaling the presence of an object inside an image), or semantic resources, such as WordNet [38]. An iterative boosting-like approach is used in [58]. Each iteration of boosting begins by learning a visual vocabulary according to the weights assigned by the previous boosting iteration. The resulting visual vocabulary is then applied to encode the training examples, a new classifier is learned and new weights are computed. The visual vocabulary is learned by clustering using K-Means a “learning” subset of image features. Features from images with high weights have more chances of being part of the learning subset. To classify a new example, the AdaBoost [13] weighted voting scheme is used. [45] construct both a generic vocabulary and a specific one for each class. The generic vocabulary describes the content of all the considered classes of images, while the specific vocabularies are obtained through the adaptation of the universal vocabulary using class-specific data. Any given image can, afterwards, be described using the generic vocabulary or one of the class-specific vocabularies. A semi-supervised technique [18], based on Hidden Random Markov Fields, uses local features as Observed Fields and Semantic labels as Hidden Fields and employs WordNet to make correlations. Some works [15, 17, 24, 56] use mutual information between features and class labels in order to learn class-specific vocabularies, by merging or splitting initial visual words quantized by K-Means. Another work [29] presents an algorithm used for learning a generic visual vocabulary, while trying to preserve and use the semantic information in the form of a point-wise mutual information vector. It uses the diffusion distance to measure intrinsic geometric relations between features. Other approaches [34] make use of label positioning in the images to distinguish between foreground and background features. They use weights for features, higher for the ones corresponding to objects and lower for the background. Our positioning In the methods presented earlier, we identify several approaches towards improving the results of classification algorithms: (a) improving image repre-
8
sentation semantics by combining multiple types of visual features (e.g., SIFT, color, texture etc., no external information is leveraged), (b) modifying the classification algorithm to take into account the text/label information (usually by training separate classifiers for (i) text and image or (ii) based on each label), (c) training and using multiple vocabularies to describe an image and (d) making use of positional labels to filter features unlikely to be relevant. Positional labels are labels in which the position of the objects in images are known, in addition to their presence. This kind of labeling is usually more costly to perform than non-positional labeling. Our proposals deal with leveraging external information to enrich the semantics of the image representation. The additional information is taken into account at the level of the representation construction. We do not modify the learning algorithm, therefore our proposals are compatible with existing classification algorithm. Our proposals can be classified under the previously defined point (c), since we construct multiple dedicated visual vocabularies. To the best or our knowledge, the feature filtering proposal, detailed in Section 3.2, is the first algorithm aimed at filtering features irrelevant for an object, without making use of positional labels. This greatly reduces the effort of manually labeling and allows the usage of broader sources of data available on the Web.
3
Improving the BoF representation using semantic knowledge
In this section, we present our two novel methods that leverage external semantic information, under the form of non-positional object labels, into the visual vocabulary construction. This kind of information is often freely available on the Web, being constantly produced by anonymous users. There are some distinctive differences between using public domain knowledge and using domain experts: (i) the public domain knowledge is not created especially for our application, but rather we make use it to improve the quality of the constructed image representations and (ii) unlike using domain experts, no evaluation feedback link can be made back to the creators of additional knowledge, as they are often anonymous. For these reasons, we privilege a semi-supervised approach and we use the additional information to guide the algorithm in the solutions space. Our work is positioned in a weakly supervised context, similar to the one defined in [57]. Each label signals the presence of a given object in an image, but not its position or boundaries. Our approaches use the semantic information to increase the relevancy of the visual vocabulary. In our first approach, for each label, we construct a dedicated visual vocabulary, based only on the images with a certain label. Such approaches have been shown [20, 45] to improve accuracy over a general purpose vocabulary, since specialized vocabularies contain visual words that more appropriately describe the objects appearing in the image collection. In our second approach, we further improve accuracy by proposing a novel pre-processing phase, which filters out features that are unlikely to belong to the respective object. Our filtering proposal follows the framework of the object recognition algorithm proposed in [32] and uses a positive and a negative example set, constructed based on the labels. The filtering pre-processing is combined with the dedicated visual vocabulary construction, and we show in Section 4 that this approach consistently achieves higher accuracy then both a dedicated vocabulary (with no filtering) and a general purpose vocabulary.
9
Including semantic knowledge The semantic knowledge is presented under the form of a collection T of k labels, T = {ti |i = 1, 2...k}. Each label is considered to denote an object in the image (e.g., a car, a person, a tree), but no positional markers are available. We make the assumption that the objects denoted by labels do not overlap in the images and their appearance in the dataset is not correlated (e.g., if a car appears, it does not necessarily mean that there is a person next to it). While these are strong assumptions, we will discuss ways of relaxing them in Section 5. Furthermore, we consider the labeling to be complete (i.e., if an image does not have a given label, than the object does not appear in the image). In Section 3.2, we discuss in further detail the effects of incomplete labeling, after presenting our proposals. Only a fraction of the image dataset is labeled and we use both labeled and unlabeled images to construct the semantic-aware representation, therefore positioning our work in the domain of semi-supervised learning. We denote by P the input collection, having n images. n1 images are labeled, thus forming the labeled set (P1 ), while the remaining images have no labels. The a priori label information is presented in the form of a boolean matrix Y ∈ {0, 1}n1 ×k , having n1 lines and k columns so that ( 1 if image pi ∈ P1 is labeled using tj ; yi,j = 0 otherwise.
3.1
Dedicated visual vocabulary generation
The idea behind the BoF representation is that the visual words are predictive for certain objects (as seen in Section 1.1). The quality of the visual words (and their predictive power) would be enhanced if they are constructed starting only from the features extracted from the respective objects. This would eliminate the background originating features and features belonging to other objects. In a weakly supervised context, the object boundaries are unknown, but selecting only the images that contain a certain object increases the relevant/noise feature ratio. Consequently, the resulted visual words are more accurate descriptions of the objects denoted by the labels. We propose to construct a dedicated visual vocabulary for each label ti ∈ T , starting only from features extracted from the images labeled with ti . The proposed method is presented in Algorithm 1. We make no assumptions about the number of visual words needed to describe each object and, therefore, visual words are distributed equally among objects. We construct k dedicated vocabularies, each one containing m/k visual words. Other division techniques can be imagined and make part of the perspectives of our work. Each dedicated vocabulary is created in the standard BoF approach, shown in Section 1.1. For a given label ti , we create Ci , the collection of all the features extracted from images labeled with ti . Formally: Ci =
n1 [
Vj
j=1 yj,i =1
where Vj is the set of numerically described features sampled from image pj . The function choose features at random is used to initialize the dedicated vocabulary Mi with m/k features randomly picked from Ci . The function ameliorate using K-Means evolves the visual vocabulary Mi by clustering the features in Ci around the visual words, using the K-Means algorithm. The Euclidean distance is used to measure the similarity between the numeric descriptions of two features, since this is the distance 10
Algorithm 1 Dedicated vocabulary generation algorithm. Input: C = {Vi | i = 1, 2..n1 } - set of features sampled from labeled images Input: Y ∈ {0, 1}n1 ×k - image/label association matrix Input: m - the dimension of the visual vocabulary M Output: the visual vocabulary M having m visual words // for each label for i = 1 to k do mi ←Sm/k // size of the dedicated vocabulary n1 Vj | yj,i = 1 // set of features in images labeled with ti Ci = j=1 // construct dedicated visual vocabulary Mi Mi ← choose features at random (mi , Ci ) Mi ← ameliorate using K-Means (Mi , Ci ) // merge the dedicated visual vocabularies M ←∅ for i = 1 to k do M ← concatenate vocabularies(M , Mi )
employed in the original work [32] that proposed the SIFT descriptor. Subsequently, it has been used by most of the literature to measure the similarity between features. The set of resulted visual words represent more accurately the object denoted by the label ti . At the end of the algorithm, the concatenate vocabularies function merges the dedicated vocabularies Mi , i = 1, 2..k into the general visual vocabulary M . This ensures that the generated visual vocabulary contains visual words which describe all the objects labeled with labels in T . Temporal complexity Algorithm 1 has a linear execution time, if we consider that matrix operations are indivisible and executed in O(1), which is the case in modern vectorial mathematical environments. Since we are executing K-Means k times, the temporal complexity will be noiter × k × O(m/k × nti ), where nti is the number of images labeled with ti and noiter is the number of performed iterations (usually limited, thus ignored in practice). That leads to a theoretical complexity of O(m × n), equal to that of K-Means.
3.2
Filtering irrelevant features
We propose a filtering mechanism in order to further increase the relevant/noise features ratio in the dedicated vocabulary construction technique presented in the previous Section 3.1: we detect and filter the features that are unlikely to be related to the object denoted by a given label. Given an image pi ∈ P1 , we construct two auxiliary image collections: the known positive set, which contains only images that are labeled identically as pi , and the known negative set, which contains images that do not share any tags with pi (given the complete labeling assumption). In practice, we limit the sizes of the known positive set and the known negative set to a maximum number of images, given by a parameter maxF iles. We define KPpi as the set of features sampled from images in the positive set and KNpi as the set of features sampled from the negative
11
(a)
(b)
(c)
Figure 3: (a) An image labeled “motorbike”, (b) an image from the known positive set and (c) an image from the known negative set set: KPpi = {f + ∈ Vj | ∀ tl ∈ T for which yi,l = 1 =⇒ yj,l = 1} KNpi = {f − ∈ Vj | ∀ tl ∈ T for which yi,l = 1 =⇒ yj,l = 0} Consider a feature sampled from pi (f ∈ Vi ), which is more similar to the features in the negative collection (f − ∈ KNpi ) rather than the ones in the positive collection (f + ∈ KPpi ). Such a feature has a higher chance of belonging to the background of pi rather than to the objects in the image. It can, therefore, be filtered. To measure the q similarity of two features, the euclidean distance is usually used: ||f1 − f2 || = 2
Σhi=1 (f1,i − f2,i ) . Formally, for a feature f sampled from an image pi : f ∈ Vi is filtered ⇔ @f + ∈ KPpi so that ||f − f + || ≤ δ with δ = α × min ||f − f − || f ∈KNpi
(1)
where δ is the filtering threshold and α ∈ R+ is a parameter, which allows the fine tuning of the filtering threshold. The filtering threshold δ is defined as the distance from the feature f to the closest feature in the known negative set, scaled by tuning parameter α. The influence of parameter α on the effectiveness of the filtering is studied in Section 4.7. A feature f is considered similar to a feature f + ∈ KPpi if and only if ||f − f + || is lower than the filtering threshold. Therefore, the feature f is removed when it has no similar feature in the known positive set. Let’s take the example of image collection depicted in Figure 3. The images in Figures 3a and 3b are labeled “motorbike”, whereas the image in Figure 3c is labeled “city”. The target image in Figure 3a has buildings in the background, and any feature sampled from that region of the image would be irrelevant for the object motorbike. Figure 3b serves as known positive set, while Figure 3c serves as known negative set. We take the example of two features: f1 sampled from the wheal of the motorbike (shown in green) and f2 sampled from the buildings in the background (shown in red), of the target image. For f1 , at least one similar feature exists in the positive set. For f2 , no similar features exist in the known positive set, its most similar feature being in the known negative set (shown in red in Figure 3c). f2 is, therefore, eliminated as it is considered not relevant for the object motorbike. Algorithm 2 presents the proposed filtering algorithm. The algorithm has two parameters maxF iles, which controls the maximum size of the KPpi and KNpi sets, and α, which controls how strict is the filtering. For each labeled image pi , the func12
Algorithm 2 Filtering irrelevant features. Input: C = {Vi | i = 1, 2..n1 } - set of features sampled from labeled images Input: Y ∈ {0, 1}n1 ×k - image/label association matrix Parameter: α - parameter controlling the filtering threshold Parameter: maxF iles - controls the size of the known positive and known negative sets Output: Vif , i = 1, 2..n1 - sets of the filtered features in each labeled image // for each labeled image for i = 1 to n1 do Vif ← ∅ Ti ← {tj | yi,j = 1} // the labels of image pi // KnownP ositive set KPpi ← create KP(i, Ti , Y , C, maxF iles) KNpi ← create KN(i, Ti , Y , C, maxF iles) // KnownN egative set // process each feature in current image pi for each f ∈ Vi do δ ← α× min distance(f , KNpi ) count ← count similar(f , KPpi , δ) if count > 0Sthen Vif ← Vif {f }
tions create KP and create KN are used to construct the feature sets KPpi and, respectively, KNpi . The count similar function is used to count how many features in KPpi have the similarity distance lower than the filtering threshold. If there exists at least one such feature in the KPpi set, then f is added to Vif , the filtered feature set of pi . Temporal complexity In Algorithm 2, for comprehension reasons, operations are presented for each feature f sampled from the image pi . In reality, in vectorial mathematical environments (e.g. Octave), matrix operations are unitary and they can be considered to be executed in O(1). Thus, the algorithm has a linear execution time O(n1 × maxF iles). Incomplete labeling In the proposed approaches, as well as in the experiments presented in Section 4, we make the assumption of complete labeling: if an object occurs in an image, then it is sure that the image has its corresponding label attached. In the case of incomplete labeling, an object might appear in an image p, but the associate label t is not set for the image p. For the dedicated vocabulary construction, incomplete labeling has a limited impact, especially if the dataset is large enough. It only means that the image p is left out when constructing the vocabulary for label t. For the filtering proposal, missing labels mean that the image p has a chance of being selected for the known negative set for an image labeled with t. This translates into a very high filtering threshold. Still, this should not pose problems if the known positive set also contains images depicting the given object. A given feature needs to have only one similar feature in the known positive set to be considered representative for the object. Furthermore, considering that our algorithms are devised to work in a semisupervised context, a limited number of completely labeled images is required. This reduces considerably the manual labeling effort.
13
Image Sampling Image Dataset
Sampled Patches
Feature Description
1
2
Results 1
Results 2
Evaluation Algorithm
.....
Assign Features to Visual Words .....
Visual Vocabulary 1
Visual Vocabulary Construction Technique 1
Visual Vocabulary 2
Visual Vocabulary Construction Technique 2
..... Visual Vocabulary N
Results N
Evaluation Results
5
Numerically Described Features
4
“Bag-offeatures” representations
..... Visual Vocabulary Construction Technique N
3
Figure 4: Schema for evaluating multiple visual vocabulary construction techniques.
4
Experiments and results
As already pointed out in Section 1, the focus of our work is enriching the semantics of the numerical representation of images. Therefore, the purpose of the experiments presented in this section is to compare the semantically-enriched representations created by our proposals to a standard baseline representation, created as described in Section 1.1. Whatsoever, directly comparing the discriminative power of two representations is not possible, unless in the context of an image-related machine learning task in this case a content-based image classification. In a nutshell, starting from a collection of images, we construct multiple numerical representations (corresponding to the techniques to be compared) and we train identical classifiers based on each of these representations. In the end, we attribute the differences of classifier performance as a direct consequence of the representation construction technique. More precisely, given the fact that we perform the semantic injection at the level of the visual vocabulary construction, the experimental protocol streamlined in Figure 4 and further detailed in Section 4.1, is designed to quantify the differences of performance due only to the visual vocabulary construction. The evaluation is a five phase process, out of which four phases (1, 2, 3 and 5) are identical for all techniques. Phases 1 to 4 correspond to the BoF representation construction (see Figure 1), while the last phase corresponds to the learning algorithm. We summarize here after each of these phases, which are further detailed in the next sections: • phase 1: image sampling, identical for all compared approaches; • phase 2: feature numerical description of patches, identical for all compared approaches; • phase 3: visual vocabulary construction, using the baseline approaches and our semantically-enriching approaches; • phase 4: feature assignment to visual words, identical for all compared approaches;
14
• phase 5: learning algorithm, each resulted representation is used with two classifiers (a clustering-based and an SVM), identical for all compared approaches.
4.1
Experimental protocol
Starting from a given image dataset, we construct, for each image, four BoF representations corresponding to the four evaluated visual vocabulary construction techniques (in phase 3). The image sampling (phase 1), the feature description (phase 2) and the image description (phase 4) are performed each time using the same algorithms and with the same parameters. In the end, the performances of each obtained BoF representation are measured and compared in the context of a content-based image classification task (detailed in Section 4.2). The visual vocabulary construction phase is the only phase to vary between the different constructed representations. Therefore, we consider the classifier performance differences a direct consequence of the vocabulary construction. The invariant phases 1, 2 and 4 In phase 1, images are sampled using a HessianAffine region detector and patches are described, in phase 2, using the SIFT descriptor [32]. We use the default parameters for these algorithms and we keep them unchanged during the experiments. The visual vocabulary is constructed in phase 3 using the construction technique to be evaluated. In phase 4, the final numerical representation is created, for each image, by associating features to visual words, using the tf term weighting scheme. To reduce the hazard component that appears in all the considered techniques, each construction is repeated 3 times and average results are presented. Compared vocabulary construction techniques (phase 3) Four visual vocabulary construction techniques are evaluated: two classical techniques random, random+km and our proposals model and filt+model. random constructs a random vocabulary (features are randomly chosen to serve as visual words). For random+km, we take the random features selected previously and we ameliorate them by using the ameliorate using K-Means function presented in Section 3.1. random+km is the baseline construction technique presented in Section 1.1. model is our proposal for dedicated vocabulary construction presented in Algorithm 1. In filt+model we applied the filtering technique presented in Algorithm 2 as a pre-processing phase before the dedicated vocabulary construction.
4.2
The learning task: content-based image classification
Each of the image representations obtained as shown in the previous sections, are used in a content-based image classification task. Two classifiers, an SVM and a clusteringbased classifier, are trained and evaluated on each representation, as described in the following paragraphs. The SVM classifier is chosen since it is the most widely used classifier in the object-based image classification literature, showing some of the best results and being a de facto standard. The K-Means-based classifier is used in order to asses our proposals with a second, weaker classifier. The choice of these classifiers is not unique and any other classifier can be used. In the following sections, we evaluate our proposals by measuring the performance gain for any given classifier.
15
The SVM classifier [8] The SVM classifier evaluation respects the experimental setup recommended by the authors of the Caltech1017 dataset. We used the SVM implementation present in the LibSVM[5] library, using a linear kernel and default parameter values. One of the challenges when evaluating in Data Mining is the disequilibrium between the class cardinality (usually it is the minority class that is of interest). This disequilibrium can cause errors in estimating the generalization error of the constructed model. Usually, the disequilibrium is the result of a certain reality in the population from which the sample was extracted (e.g. the population of sick individuals is a minority compared to the healthy population). But in the case of image datasets like Caltech101, the disequilibrium is only the result of the choice of its creator and represents no reality that needs to be taken into account. We choose to equilibrate the classes before training the classifier, by randomly selecting 30 examples for each label to be part of the learning set. 15 images in the learning corpus are randomly selected to be part of the labeled set P1 . We test on all remaining individuals, which means that the generalization error on majority classes will be better estimated. Evaluation indicators are calculated for each class and we report only the non-weighted averages. The process is repeated 10 times: we create 10 learning sets and the corresponding 10 testing sets. We report the average performances over the 10 executions. The results are expressed using the True Positive Rate, because this measure is usually used in the literature when reporting results on Caltech101 and RandCaltech101. A clustering-based classifier The clustering-based evaluation task is inspired from the unsupervised information retrieval field and it is based on clustering. A learning set of the image collection is clustered into a number of clusters and each cluster is assigned a label, using a majority vote. Each image in the test corpus is assigned to its nearest centroid and it is given the predicted label of the cluster. Predicted labels are compared to the real labels and classical information retrieval measures (i.e., precision, recall, Fscore ) are calculated. The evaluation of the clustering-based classifier is performed using a stratified holdout strategy. The images are divided into a learning corpus (67% of images in each category) and a test corpus (33% of the images in each category). 50% of images in the learning corpus are randomly selected to be part of the labeled set P1 . For the rest, the labels are hidden. Images in the learning set are then clustered into nc clusters using K-Means. nc varies between 50 and 1000 (step 50) for Caltech101 and RandCaltech101 and between 3 and 90 (step 3) for Caltech101-3 (Caltech101-3 contains only 3 classes, see Section 4.3). To eliminate the effect of disequilibrium between class sizes, we calculate and report the non-weighted averages over tags of these indicators. To measure the classification accuracy, we use the Fscore (the harmonic average of precision and recall), a classical Information Retrieval measure. For each combination (vocabulary dimension, nc, vocabulary algorithm), the clustering and prevision phase is repeated 25 times, to eliminate the influence of the random initialization of the K-Means in the clustering-based classifier.
4.3
Datasets
Experiments were performed on the Caltech101 [11] and RandCaltech101 [23] datasets. Caltech101 contains 9144 images, most of them in medium resolution (300×300 pixels). It is a heterogeneous dataset, having 101 object categories and 7 http://www.vision.caltech.edu/Image_Datasets/Caltech101/
16
one reserve. Each category class is considered to be a label. Spatial positioning of objects is not used, therefore positioning ourselves in a weakly supervised context. Some authors argue that Caltech101 is not diverse enough and that backgrounds often provide more information than the objects themselves. RandCaltech101 is obtained from Caltech101 by randomly modifying the backgrounds and the posture (position, orientation) of objects. It has been shown [23] that classification is more challenging on RandCaltech101 than on Caltech101. Because Caltech101 is an unbalanced dataset, with category sizes ranging from 31 to 800 images, we have taken 3 out of the biggest categories (airplanes, Motorbikes and Faces easy) and created another corpus, denoted Caltech101-3. It contains 2033 images. The advantage of the new corpus is that it provides many examples for each category and it is balanced category-wise. This allows us to study how our propositions behave on both balanced and unbalanced datasets.
4.4
Qualitative evaluation
Figure 5: Example of images from “easy” classes (top row) and “difficult” classes (bottom row) In a classification tasks, some classes are naturally easier to recognize than others. This happens when the numerical description is better adapted to translate them into a separable numerical space. On Caltech101, the best classification scores are almost invariably obtained by the same categories, independent of the choice of visual construction algorithms or parameters. Figure 5 shows some examples of images belonging to “easy classes”, categories that obtain good classification scores (on the upper row), and examples of “difficult classes”, categories that obtain low scores (on the bottom row). The objects belonging to the “easy classes” either appear in the same posture in all examples or they have a specific color pattern that makes them easily recognisable. Most of the examples of airplanes and garfield appear with the same shape, size and orientation. Other categories like yin yang, soccer ball or dalmatian have a specific white-black alternation pattern, which makes them easily recognizable even in the real world. By contrast, the objects depicted in picture of “difficult classes”, like seahorse or butterfly appear in different colors, multiple postures and sometimes hidden in the background. We perform the same analysis on RandCaltech101. Table 1 presents a comparative view of “easy classes” and “difficult classes” constructed for Caltech101 and RandCaltech101, with the non-identical categories (between the two datasets) printed in boldface. We observe the high degree of overlapping of the constructed
17
Table 1: “Easy” classes and “difficult” classes in Caltech101 and RandCaltech101 “Easy” classes Caltech101 RandCaltech101 airplanes car side dalmatian dollar bill Faces easy garfield grand piano Leopards metronome Motorbikes panda scissors snoopy soccer ball stop sign tick watch windsor chair yin yang
“Difficult” classes Caltech101 RandCaltech101
accordion airplanes car side dalmatian dollar bill Faces easy garfield laptop Motorbikes panda snoopy soccer ball stop sign watch windsor chair yin yang
beaver buddha butterfly ceiling fan cougar body crab crayfish cup dragonfly ewer ferry flamingo flamingo head ibis kangaroo lamp lobster mandolin mayfly minaret pigeon platypus pyramid rhino saxophone schooner sea horse stapler strawberry wild cat wrench
bass binocular brontosaurus buddha butterfly crab crayfish crocodile cup dragonfly ewer flamingo flamingo head gerenuk helicopter ibis kangaroo lamp lobster mandolin mayfly metronome minaret okapi pigeon platypus saxophone sea horse stapler wrench
sets: most of the “easy classes” in Caltech101 also appear as “easily” recognizable for RandCaltech101. Similarly, difficult classes on Caltech101 remain difficult on RandCaltech101. In Table 1, the only category that changes difficulty is metronome, which is an “easy class” in Caltech101 and a “difficult class” in RandCaltech101. This proves that the background randomization performed in order to create RandCaltech101, while it makes the dataset more challenging to classify as a whole, does not change the relative difficulty between categories. Categories that obtain good classification scores for Caltech101 also obtain good scores for RandCaltech101.
18
Fscore for different model creation techniques
Fscore for different model creation techniques
0.19
0.13
0.18 0.12
0.17 0.16
0.11
Fscore Value
Fscore Value
0.15 0.14 0.13 0.12 0.11
0.1 0.09 0.08
0.1 0.07
0.09 model filt+model random+km random
0.08 0.07 0.06 50
150
250
350
450
550
650
750
850
model filt+model random+km random
0.06 0.05 950
50
Number of requested clusters (nc)
150
250
350
450
550
650
750
850
950
Number of requested clusters (nc)
(a)
(b)
Figure 6: A typical Fscore evolution for the clustering-based classifier for m = 1000 on Caltech101 (a) and on RandCaltech101 (b)
4.5
Quantitative evaluation
In this section, we show how the performances of the two classifiers vary, depending on the visual vocabulary construction technique and the size of the visual vocabulary. We show that the semantically-enriched representation clearly outperform the baseline approach, mostly by increasing the score of “difficult” categories, and we discuss the overfitting. For all the experiments presented in this subsection, the parameter α (introduced in Equation 1) of the filtering heuristic filt+model is set at one (α = 1) and its influence is studied later, in Section 4.7. Aggregating the number of clusters in the clustering-based classifier When using the clustering-based classification algorithm, for a fixed visual vocabulary size, varying the number of clusters nc leads to an Fscore variation as shown in Figure 6. For all visual vocabulary techniques, the Fscore has a steep amelioration for lower values of nc and stabilizes once nc reaches a value which is approximately two-three times bigger than the number of categories. Starting from this point Fscore augments slowly and reaches its theoretical maximum when nc equals the number of individuals in the testing set. Due to the fact that once stabilized, the score can be considered relatively constant, we compute the mean Fscore over all the values for nc. We obtain, for each visual vocabulary dimension, an aggregated Fscore . Obtained graphics Figures 7, 8 and 9 present the score evolution as a function of the visual vocabulary size on, respectively, the datasets Caltech101, Caltech101-3 and RandCaltech101. More precisely, Figures 7a, 8a and 9a show the evolution of the aggregated Fscore , for the clustering-based classifier, and Figures 7b, 8b and 9b show the variation of the T rueP ositiveRate, using the SVM classifier. We make vary the vocabulary dimension between 100 and 5300 for Caltech101 and RandCaltech101 and between 10 and 5500 for the Caltech101-3, using a variable step. For the three datasets, the horizontal axis is logarithmic. When observing the graphics for every tuple (dataset, classifier, vocabulary construction technique), we observe the pattern of a dome-like shape, corresponding to the three phases: underfitting, maximum performance and overfitting. We analyze more in detail the overfit-
19
FScore for different vocabulary creation techniques
True Positive Rate for different vocabularies
0.17 0.16 0.37
0.15
True Positive Rate
FScore value
0.36 0.14 0.13 0.12 0.11
0.35 0.34 0.33 0.32 0.31 0.3 0.29
0.1
0.28 model filt+model random+km random
0.09 0.08 100
200
300
model filt+model random+km random
0.27 0.26
500 700 1000
2300 3300
0.25 100
5300
200
Visual vocabulary size (log)
300
500 700 1000
2300 3300
5300
Visual vocabulary size (log)
(a)
(b)
Figure 7: Caltech101: Aggregated Fscore with clustering-based classifier (a) and T rueP osiviteRate for SVM (b) as functions of the vocabulary size FScore for different vocabulary creation techniques
True Positive Rate for different vocabularies 0.98
0.95
0.96
0.93 0.91
0.94
0.89
True Positive Rate
FScore value
0.87 0.85 0.83 0.81 0.79 0.77 0.75 0.73
0.92 0.9 0.88 0.86 0.84 0.82
model filt+model random+km random
0.71 0.69 0.67 10
30
50 70 110 160 260
model filt+model random+km random
0.8 0.78 500
1000
2000 35005500
Visual vocabulary size (log)
10
30
50 70 110 160 260
500
1000
2000 35005500
Visual vocabulary size (log)
(a)
(b)
Figure 8: Caltech101-3: Aggregated Fscore with clustering-based classifier (a) and T rueP osiviteRate for SVM (b) as functions of the vocabulary size ting behavior for each vocabulary construction technique in Section 4.6. Furthermore, the somehow low results obtained by the clustering-based classifier can be explained by the fact that the clustering-based classifier is a weak classifier (i.e., a classifier which perform only slightly better than a random classifier), whereas the SVM is a strong classifier. Results interpretation When comparing the relative performances of the different techniques presented in Figures 7, 8 and 9, we observe that our semantic-aware proposals (i.e., model and filt+model) generally obtain better results than the generic (random+km) and random ones. The three regions of evolution are wider (they enter overfitting later) for model and filt+model than for random and random+km. On the other hand, they also exit the under-fitting later. The generic random+km obtains better results than model and filt+model, for lower dimensions of visual vocabulary, on Caltech101 and RandCaltech101. After exiting the under-fitting region, model and filt+model constantly obtain better scores than random+km, even when 20
FScore for different vocabulary creation techniques
True Positive Rate for different vocabularies
0.12 0.29 0.11
0.28
True Positive Rate
FScore value
0.27 0.1
0.09
0.08
0.26 0.25 0.24 0.23 0.22 0.21
0.07
0.06 100
0.2
model filt+model random+km random 200
300
500 700 1000
model filt+model random+km random
0.19 2300 3300
5300
Visual vocabulary size (log)
0.18 100
200
300
500 700 1000
2300 3300
5300
Visual vocabulary size (log)
(a)
(b)
Figure 9: RandCaltech101: Aggregated Fscore with clustering-based classifier (a) and T rueP osiviteRate for SVM (b) as functions of the vocabulary size overfitted. Applying our filtering proposal (filt+model) consistently provides a plus of performance (over model), but also causes the visual vocabulary to enter overfitting earlier.
model
filt+model
random+km
pred.
Caltech101 Caltech101-3 RandCaltech101
13.96% 6.58% 20,49%
15,69% 7.36% 26,27%
4,36% 2.73% 12,07%
SVM
Table 2: Average gain of performance relative to random.
Caltech101 Caltech101-3 RandCaltech101
5,98% 4,71% 5,89%
12,02% 5.24% 15,20%
12,05% 1,90% 13,21%
Table 2 gives the average gain of performance relative to random for the generic random+km and our semantic-aware proposals model and filt+model. For the clusteringbased classifier, we show the average relative Fscore gain, while for the SVM we show the average relative T rueP ositiveRate gain. The best scores for each dataset are shown in bold. In five out of six cases, the best scores are obtained by filt+model. model also performs better than the generic random+km in four out of the six cases. This shows that a semantically-enriched representation outperforms the generic method random+km in a classification task. The maximum gain of performance is achieved on RandCaltech101, where, by eliminating the background noise, our filtering algorithm considerably improves the classification performances. When used with the SVM classifier on Caltech101 and RandCaltech101, the model technique obtains average scores lower than random+km. This is because model exits the underfitting later than the other techniques, thus lowering its average score (as shown in Figures 7b and 9b). The ROC curves Similar conclusions regarding the overfitting and the relative performances of the different visual vocabulary construction techniques can be drawn 21
ROC curve
ROC curve 0.11
0.15 0.1
0.14
Sensitivity
Sensitivity
0.13 0.12 0.11
0.09
0.08
0.1 0.09 0.08
0.07
model filt+model random+km random 0.0065
0.007
0.0075
0.008
model filt+model random+km random 0.007 0.0072 0.0074 0.0076 0.0078 0.008 0.0082 0.0084
1 - Specificity
1 - Specificity
(a)
(b)
Figure 10: ROC curves: clustering-based classifier on Caltech101 (a) and RandCaltech101 (b) by plotting the evolution using ROC [10] curves. Figure 10 shows the ROC curves obtained using the clustering-based classifier on Caltech101(Figure 10a) and on RandCaltech101 (Figure 10b). The visual vocabulary size varied between 100 and 5300. The sign * on the graphic indicates the smallest size. The plots are zoomed to the relevant part. Overfitting is clearly visible on the ROC curves. All the curves start by climbing towards the ideal point (0, 1) (first and second region on the graphics in Figures 7a and 9a). After reaching a maximum, the ROC curves start descending towards the “worst” point (1, 0), showing the overfitting region. The curve corresponding to filt+model clearly dominates all the other, confirming the conclusions drawn from studying Table 2: the proposed approaches and especially their combination in filt+model, achieve higher classification results. Scores for “easy” and “difficult” categories In Section 4.4, we have shown that in both Caltech101 and RandCaltech101 some classes are easier to learn than others. Regardless of the visual vocabulary construction technique, “easy classes” obtain higher classification scores. Nonetheless, the construction particularities of each technique influence the accuracy for difficult categories. In random, features are randomly picked to serve as visual words. Score differences between easy and difficult categories are pronounced and the overall accuracy is low. The K-Means iterations in random+km fit the visual vocabulary to “easy” classes. Few categories achieve good scores, accentuating the gap between easy and difficult categories. model and filt+model techniques achieve for “difficult” categories, better scores than random and random+km. The visual vocabulary is representative for all categories and difficult categories like pyramid, minaret or stapler obtain higher scores than those obtained with a baseline representation.
4.6
Overfitting
Evaluating using the clustering-based classifier In the clustering-based classifier, for each pair (dataset, vocabulary construction technique), the Fscore graphic shows a dome-like shape with three regions. In the first one, corresponding to low vocabulary dimensions, the visual vocabulary is under-fitted, there are not enough visual words 22
to describe the objects [19]. Consequently, in the assign phase (phase 4 in “bag-offeatures” construction schema in Figure 1), features are assigned to the same visual word even if they are not similar to each other. The second region represents the interval in which the vocabulary obtains the best results. In the third region (corresponding to large sizes of the visual vocabulary), performance degrades gradually. This is due to the fact that, in the assign phase, relevant features are grouped densely, while noise is evenly distributed. Some of the visual words regroup relevant features, while other regroup only the noise. As the visual vocabulary dimension augments, more and more visual words will regroup only noise. This generates a numerical space of high dimensionality, which is separable only on a few dimension. This leads to degrading the overall separability of the numerical space and the classification performances. Evaluating using the SVM classifier The same conclusions apply for the SVM classifier. Being a strong classifier, in Figures 7b (Caltech101) and 9b (RandCaltech101) the dome-shape is less visible for the SVM. The overfitting appears for higher visual vocabulary sizes than in the clustering-based classifier. For example, in Figure 9a, for random+km, clustering-based classifier starts to overfit at a vocabulary size of 300. When using the SVM, in Figure 9b, overfitting starts only at 1300. The model technique does not appear to enter overfitting in Figure 9b. But this is likely to happen for dimensions higher than 5300 (the maximum considered), because model is the last technique to enter overfitting for the clustering-based classifier (as shown in Figure 9a). The overfitting region is even more visible for Caltech101-3 (Figure 8). The visual vocabulary sizes are considerably higher than for the other datasets, relative to the number of classes. In Figure 8a performances of all visual vocabulary techniques descend sharply for higher values of vocabulary size. The evaluation using the SVM classifier, in Figure 8b, also clearly shows the dome-like shape.
4.7
Influence of parameter α FScore curve for different values for alpha (filtering)
True Positive Rate curve for different values for alpha (filtering)
0.12
0.3 0.29 0.28 0.27
True Positive Rate
FScore value
0.11
0.1
0.09
0.08 100
0.26 0.25 0.24 0.23 0.22 0.21 0.2
alpha = 0.8 alpha = 1 alpha = 1.25 alpha = 1.5 200
300
500 700 1000
alpha = 0.8 alpha = 1 alpha = 1.25 alpha = 1.5
0.19 0.18
2300 3300
5300
Visual vocabulary size (log)
0.17 100
200
300
500 700 1000
2300 3300
5300
Visual vocabulary size (log)
(a)
(b)
Figure 11: RandCaltech101: influence of parameter α on filt+model construction technique in the clustering-based classifier (a) and the SVM classifier (b) In Equation 1, we have defined δ, the filtering threshold, which is used to decide if a feature has any similar features in the known positive set. The parameter α is used to fine-tune this threshold. If α is set too low, only the features that are very close (in 23
terms of Euclidean distance) are considered to be similar. Consequently, the filtering is very strict, lowering the number of false positives, with the risk of an inflation of false negatives. On the other hand, setting α too high allows distant features to be considered as similar, causing a high number of false positives. In the previous experiments, we have set the parameter α = 1. In this section, we study the influence of this parameter on the performances obtained by the filt+model construction technique. Figure 11 shows the evolution of the filt+model visual vocabulary construction technique as a function of the vocabulary size, when using α ∈ {0.8, 1, 1.25, 1.5}. The horizontal axis is logarithmic. A value for α = 0.8 is too strict and the high number of false negatives decreases the classification performances. Augmenting α = 1 improves performances, both when using the clustering-based classifier (Figure 11a) and when using the SVM classifier (Figure 11b). If α is set too high, performances decrease again. Too many features are considered similar and less features get filtered. Performances approach those obtained when no filtering is applied. α = 1.25 and α = 1.5 show similar performances, since both levels are already too high for filtering to be effective. For α ≥ 1.25, filt+model is equivalent to the model visual vocabulary construction technique. In Figure 11a, filt+model with α ∈ {1.25, 1.5} obtains, for high visual vocabulary sizes (m > 2000), better results than filt+model with α ∈ {0.8, 1}. This behavior is similar with that already seen in Figure 9a, when model enters overfitting later than filt+model, and obtains better results for high vocabulary sizes. These initial experiments make us believe that α is dataset independent (a value of 1 provided best results on all three datasets), but further experiments on other datasets are required for a firm conclusion. Furthermore, a heuristic for automatically determining its value is part of our future plans.
5
Conclusion and future work
Conclusion In the work presented in this article, we have focused on constructing a semantically-enriched representation for images, by leveraging additional information under the form of non-positional labels. We argue that enriching the semantics of the image representation boosts the performances of learning algorithms and we apply our proposed method to the learning task of content-based image classification. We use the additional information in the phase of visual vocabulary construction, when building a “bag-of-features” image representation. We have proposed two novel approaches for incorporating this semantic knowledge into the visual vocabulary creation. The first approach creates dedicated vocabularies for each label, while the second uses a pre-processing phase for filtering visual features unlikely to be associated with a given object. We have shown that the semantically-enriched image representations built using our proposals obtain higher scores than a baseline BoF representation, in the context of a task of content-based image classification. This shows that incorporating semantic knowledge in the vocabulary construction results in more descriptive visual words, especially on datasets where the background noise is significant. Even when overfitted, our proposals continue to outperform the generic approach. Future work Our visual vocabulary construction techniques, proposed in Section 3, are not limited to the task of object-based image classification. They can be used with any image-related machine learning task that involves constructing a BoF representation for images. Whatsoever, scaling our approaches to other applications involves 24
relaxing some of the assumptions. For example, we assumed that labels which denote objects appear independently in the image collection. We are working on relaxing this strict condition and on passing from a learning task of object categorization to one of scene classification. This raises the difficulty of object co-occurrence. For example, a picnic scene is defined by the simultaneous presence of “people”, “trees”, “grass” and “food”. In terms of labels, this translates into label co-occurrence. Our approaches can be scaled to image classification by addressing the label co-occurrence issue. We are currently working on using the unsupervised feature8 construction algorithm proposed in [48] to reconstruct the image labels and to reduce, even eliminate, their co-occurrence. The new labels are constructed as conjunctions of existing labels and their negations, and would actually no longer be used to label objects, but scenes. For example, if the labels “motorcycle” and “rider” appear often together, a new label “motorcycle ∧ rider” will be created to mark the scene identified by the presence of the two objects.
References [1] Athanasiadis, T., Tzouvaras, V., Petridis, K., Precioso, F., Avrithis, Y., Kompatsiaris, Y.: Using a multimedia ontology infrastructure for semantic annotation of multimedia content. In: International Workshop on Knowledge Markup and Semantic Annotation, collocated with International Semantic Web Conference (ISWC 2005). SemAnnot ’05, Galway, Ireland (Nov 2005) [2] Bay, H., Tuytelaars, T., Van Gool, L.: Surf: Speeded up robust features. Computer Vision– ECCV 2006 pp. 404–417 (2006) [3] Blei, D.M., Ng, A.Y., Jordan, M.I.: Latent dirichlet allocation. The Journal of Machine Learning Research 3, 993–1022 (2003) [4] Blum, A., Mitchell, T.: Combining labeled and unlabeled data with co-training. In: Computational Learning Theory, Proceedings of the eleventh annual conference on. pp. 92–100. ´ ACM (1998) COLT 98, [5] Chang, C.C., Lin, C.J.: Libsvm: a library for support vector machines. ACM Transactions on Intelligent Systems and Technology (TIST) 2(3), 27 (2011) [6] Chavez, C.G., Precioso, F., Cord, M., Phillip-Foliguet, S., de A. Ara´ujo, A.: An interactive video content-based retrieval system. In: Systems, Signals and Image Processing, 15th International Conference on. pp. 133–136. IWSSIP ’08, IEEE (2008) [7] Comaniciu, D., Meer, P.: Mean shift: A robust approach toward feature space analysis. Pattern Analysis and Machine Intelligence, IEEE Transactions on 24(5), 603–619 (2002) [8] Cortes, C., Vapnik, V.: Support-vector networks. Machine learning 20(3), 273–297 (1995) [9] Csurka, G., Dance, C.R., Fan, L., Willamowski, J., Bray, C.: Visual categorization with bags of keypoints. In: Workshop on statistical learning in computer vision, ECCV. vol. 1, pp. 1–22 (2004) [10] Fawcett, T.: An introduction to roc analysis. Pattern recognition letters 27(8), 861–874 (2006) [11] Fei-Fei, L., Fergus, R., Perona, P.: Learning generative visual models from few training examples: An incremental bayesian approach tested on 101 object categories. Computer Vision and Image Understanding 106(1), 59–70 (2007) 8 Note that, in this context, the word feature is used in the sense of attribute. It should not be confused with the definition of feature in image processing literature, where it has the sense of visual feature.
25
[12] Fei-Fei, L., Perona, P.: A bayesian hierarchical model for learning natural scene categories. In: Computer Vision and Pattern Recognition, IEEE Computer Society Conference on. CVPR 2005, vol. 2, pp. 524–531. IEEE (2005) [13] Freund, Y., Schapire, R.E.: A decision-theoretic generalization of on-line learning and an application to boosting. Journal of computer and system sciences 55(1), 119–139 (1997) [14] Frintrop, S., Rome, E., Christensen, H.I.: Computational visual attention systems and their cognitive foundations: A survey. ACM Transactions on Applied Perception (TAP) 7(1), 6 (2010) [15] Fulkerson, B., Vedaldi, A., Soatto, S.: Localizing objects with smart dictionaries. Computer Vision–ECCV 2008 pp. 179–192 (2008) [16] Haralick, R.M., Shanmugam, K.: Computer classification of reservoir sandstones. Geoscience Electronics, IEEE Transactions on 11(4), 171–177 (1973) [17] Hsu, W., Chang, S.F.: Visual cue cluster construction via information bottleneck principle and kernel density estimation. Image and Video Retrieval pp. 82–91 (2005) [18] Ji, R., Yao, H., Sun, X., Zhong, B., Gao, W.: Towards semantic embedding in visual vocabulary. In: Computer Vision and Pattern Recognition (CVPR), 2010 IEEE Conference on. pp. 918–925 (2010) [19] Jiang, Y.G., Ngo, C.W., Yang, J.: Towards optimal bag-of-features for object categorization and semantic video retrieval. In: Proceedings of the 6th ACM International Conference on Image and Video Retrieval. pp. 494–501. ACM (2007) [20] Jianjia, Z., Limin, L.: Combined category visual vocabulary: A new approach to visual vocabulary construction. In: Image and Signal Processing, 4th International Congress on. CISP 2011, vol. 3, pp. 1409–1415 (Oct 2011) [21] Jurie, F., Triggs, B.: Creating efficient codebooks for visual recognition. In: Computer Vision, 2005. ICCV 2005. Tenth IEEE International Conference on. vol. 1, pp. 604–610. IEEE (2005) [22] Kadir, T., Brady, M.: Saliency, scale and image description. International Journal of Computer Vision 45(2), 83–105 (2001) [23] Kinnunen, T., Kamarainen, J.K., Lensu, L., Lankinen, J., K¨alvi¨ainen, H.: Making visual object categorization more challenging: Randomized caltech-101 data set. In: 2010 International Conference on Pattern Recognition. pp. 476–479. IEEE (2010) [24] Lazebnik, S., Raginsky, M.: Supervised learning of quantizer codebooks by information loss minimization. Pattern Analysis and Machine Intelligence, IEEE Transactions on 31(7), 1294–1309 (2009) [25] Lazebnik, S., Schmid, C., Ponce, J.: Affine-invariant local descriptors and neighborhood statistics for texture recognition. In: Computer Vision, 2003. Proceedings of the Ninth IEEE International Conference on. pp. 649–655. ICCV 2003, IEEE (2003) [26] Lazebnik, S., Schmid, C., Ponce, J.: A sparse texture representation using affine-invariant regions. In: Computer Vision and Pattern Recognition, 2003. Proceedings. 2003 IEEE Computer Society Conference on. vol. 2, pp. II–319. IEEE (2003) [27] Lazebnik, S., Schmid, C., Ponce, J.: Beyond bags of features: Spatial pyramid matching for recognizing natural scene categories. In: Computer Vision and Pattern Recognition, 2006 IEEE Computer Society Conference on. vol. 2, pp. 2169–2178. IEEE (2006) [28] Lindeberg, T.: Detecting salient blob-like image structures and their scales with a scalespace primal sketch: a method for focus-of-attention. International Journal of Computer Vision 11(3), 283–318 (1993) [29] Liu, J., Yang, Y., Shah, M.: Learning semantic visual vocabularies using diffusion distance. In: Computer Vision and Pattern Recognition (CVPR), IEEE Conference on. pp. 461–468. IEEE (2009)
26
[30] L´opez-Sastre, R., Tuytelaars, T., Acevedo-Rodr´ıguez, F., Maldonado-Basc´on, S.: Towards a more discriminative and semantic visual vocabulary. Computer Vision and Image Understanding 115(3), 415–425 (Nov 2010) [31] Lowe, D.G.: Object recognition from local scale-invariant features. In: Computer Vision, The Proceedings of the Seventh IEEE International Conference on. ICCV 1999, vol. 2, pp. 1150–1157. IEEE (1999) [32] Lowe, D.G.: Distinctive image features from scale-invariant keypoints. International Journal of Computer Vision 60(2), 91–110 (2004) [33] Maree, R., Geurts, P., Piater, J., Wehenkel, L.: Random subwindows for robust image classification. In: Computer Vision and Pattern Recognition, IEEE Computer Society Conference on. CVPR 2005, vol. 1, pp. 34–40. IEEE (2005) [34] Marszałek, M., Schmid, C.: Spatial weighting for bag-of-features. In: Computer Vision and Pattern Recognition, 2006 IEEE Computer Society Conference on. vol. 2, pp. 2118–2125. IEEE (2006) [35] de Medeiros Martins, A., Torres de Almeida Filho, W., Medeiros Brito J´unior, A., Duarte D´oria Neto, A.: A new method for multi-texture segmentation using neural networks. In: Neural Networks, Proceedings of the 2002 International Joint Conference on. IJCNN’02, vol. 3, pp. 2064–2069. IEEE (2002) [36] Meyerson, A.: Online facility location. In: Foundations of Computer Science, Proceedings of the 42nd IEEE Symposium on. pp. 426–431. IEEE (2001) [37] Mikolajczyk, K., Schmid, C.: Scale & affine invariant interest point detectors. International Journal of Computer Vision 60(1), 63–86 (2004) [38] Miller, G.A.: Wordnet: a lexical database for english. Communications of the ACM 38(11), 39–41 (1995) [39] Mooney, R.J., Gupta, S., Kim, J., Grauman, K.: Watch, listen & learn: Co-training on captioned images and videos. Machine Learning and Knowledge Discovery in Databases pp. 457–472 (Sep 2008) [40] Moosmann, F., Triggs, B., Jurie, F.: Fast discriminative visual codebooks using randomized clustering forests. Advances in neural information processing systems 19, 985 (2007) [41] Morsillo, N., Pal, C., Nelson, R.: Semi-supervised learning of visual classifiers from web images and text. In: International Joint Conference on Artificial Intelligence, Proceedings of the 21st. pp. 1169–1174. IJCAI 2009, Morgan Kaufmann Publishers Inc. (2009) [42] Nowak, E., Jurie, F., Triggs, B.: Sampling strategies for bag-of-features image classification. Computer Vision–ECCV 2006 pp. 490–503 (2006) [43] O’Hara, S., Draper, B.A.: Introduction to the bag of features paradigm for image classification and retrieval. Tech. rep., Cornell University Library (2011), arXiv preprint arXiv:1101.3354 [44] Oliva, A., Torralba, A.: Modeling the shape of the scene: A holistic representation of the spatial envelope. International Journal of Computer Vision 42(3), 145–175 (2001) [45] Perronnin, F., Dance, C.R., Csurka, G., Bressan, M.: Adapted vocabularies for generic visual categorization. Computer Vision–ECCV 2006 pp. 464–475 (2006) [46] Pham, N.K., Morin, A., Gros, P., Le, Q.T.: Factorial correspondence analysis for image retrieval. In: Research, Innovation and Vision for the Future, 2008. RIVF 2008. IEEE International Conference on. pp. 269–275. IEEE (2008) [47] Quelhas, P., Monay, F., Odobez, J.M., Gatica-Perez, D., Tuytelaars, T., Van Gool, L.: Modeling scenes with local descriptors and latent aspects. In: Computer Vision, Tenth IEEE International Conference on. ICCV 2005, vol. 1, pp. 883–890. IEEE (2005)
27
[48] Rizoiu, M.A., Velcin, J., Lallich, S.: Unsupervised feature construction for improving data representation and semantics. Journal of Intelligent Information Systems 40(3), 501–527 (2013) [49] Sivic, J., Russell, B.C., Efros, A.A., Zisserman, A., Freeman, W.T.: Discovering objects and their location in images. In: Computer Vision, Tenth IEEE International Conference on. ICCV 2005, vol. 1, pp. 370–377. IEEE (2005) [50] Sivic, J., Zisserman, A.: Video google: A text retrieval approach to object matching in videos. In: Computer Vision, Proceedings of the Ninth IEEE International Conference on. pp. 1470–1477. ICCV 2003, IEEE (2003) [51] Swain, M.J., Ballard, D.H.: Color indexing. International Journal of Computer Vision 7(1), 11–32 (1991) [52] Varma, M., Zisserman, A.: Texture classification: Are filter banks necessary? In: Computer Vision and Pattern Recognition, Proceedings of the IEEE computer society conference on. CVPR 2003, vol. 2, pp. II–691. IEEE (2003) [53] Vogel, J., Schiele, B.: Semantic modeling of natural scenes for content-based image retrieval. International Journal of Computer Vision 72(2), 133–157 (2007) [54] Wang, G., Hoiem, D., Forsyth, D.: Building text features for object image classification. In: Computer Vision and Pattern Recognition, 2009. CVPR 2009. IEEE Conference on. pp. 1367–1374. IEEE (2009) [55] Willamowski, J., Arregui, D., Csurka, G., Dance, C.R., Fan, L.: Categorizing nine visual classes using local appearance descriptors. In: ICPR Workshop on Learning for Adaptable Visual Systems (2004) [56] Winn, J., Criminisi, A., Minka, T.: Object categorization by learned universal visual dictionary. In: Computer Vision, 2005. ICCV 2005. Tenth IEEE International Conference on. vol. 2, pp. 1800–1807. IEEE (2005) [57] Zhang, J., Marszałek, M., Lazebnik, S., Schmid, C.: Local features and kernels for classification of texture and object categories: A comprehensive study. International Journal of Computer Vision 73(2), 213–238 (2007) [58] Zhang, W., Surve, A., Fern, X., Dietterich, T.G.: Learning non-redundant codebooks for classifying complex objects. In: Proceedings of the 26th Annual International Conference on Machine Learning. pp. 1241–1248. ACM (2009)
28