capabilities, technologies that help analyzing and extracting useful information from ... ology, Vecna pot 111, Ljubljana, Slovenia, {helena.motaln, marko.petek ...
31st Annual International Conference of the IEEE EMBS Minneapolis, Minnesota, USA, September 2-6, 2009
Semantic Subgroup Discovery: Using Ontologies in Microarray Data Analysis Nada Lavraˇc, Petra Kralj Novak, Igor Mozetiˇc, Vid Podpeˇcan, Helena Motaln, Marko Petek, Kristina Gruden Abstract— A major challenge for next generation data mining systems is creative knowledge discovery from highly diverse and distributed data and knowledge sources. This paper presents an approach to information fusion and creative knowledge discovery from semantically annotated knowledge sources: by using ontology information as background knowledge for semantic subgroup discovery, rules are constructed that allow the expert to recognize gene groups that are differentially expressed in different types of tissues. The paper presents also current directions in creative knowledge discovery through bisociative data analysis, illustrated on a systems biology case study.
I. I NTRODUCTION Biologists collect large quantities of data from wet lab experiments and high-throughput platforms. Public biological databases, like Gene Ontology, Kyoto Encyclopedia of Genes and Genomes and ENTREZ, are some of the sources of biological knowledge. Since the growing amounts of available knowledge and data exceed human analytical capabilities, technologies that help analyzing and extracting useful information from such vast amounts of data need to be developed and used. This paper presents an approach to information fusion and semantic subgroup discovery, by using ontologies as background knowledge in microarray data analysis. Let us first explain the basic notions: information fusion, subgroup discovery, semantic subgroup discovery and bisociative reasoning which is at the heart of creative, accidental discovery (serendipity). Information Fusion: Information fusion can be defined as a study of efficient methods for automatically or semi-automatically transforming information from different sources and different points in time into a representation that provides effective support for human and automated decision making [1]. Recent investigations in using information fusion to support scientific decision making within bioinformatics include [2], [7]. Smirnov et al. [10] exploit the idea of formulating an ontology-based model of the problem to be solved by the user and interpreting it as a constraint satisfaction problem taking into account information from a dynamic environment. An approach to the integration of biological databases GO, KEGG and ENTREZ is implemented in the SEGS information fusion engine (Searching for Enriched Nada Lavraˇc, Petra Kralj Novak, Igor Mozetiˇc and Vid Podpeˇcan are with Joˇzef Stefan Institute, Jamova 39, Ljubljana, Slovenia. Nada Lavraˇc is also with University of Nova Gorica, Vipavska 13, 5000 Nova Gorica, Slovenia, {nada.lavrac, petra.kralj, igor.mozetic, vid.podpecan}@ijs.si. Helena Motaln, Marko Petek and Kristina Gruden are with National Institute of Biology, Veˇcna pot 111, Ljubljana, Slovenia, {helena.motaln, marko.petek, kristina.gruden}@nib.si.
978-1-4244-3296-7/09/$25.00 ©2009 IEEE
Gene Sets) [13]. Another, much larger, integrated annotated bioinformatics information resource is Biomine [9]. The later two approaches are used for information fusion in the methodology presented in this paper. Subgroup Discovery: Subgroup discovery techniques are used to generate explicit knowledge in the form of rules that allow the user to recognize important relationships in a set of class labeled training instances, describing the target property of interest. Consider two applications. In the first one, the induced subgroup describing rules suggest the general practitioner how to select individuals for population screening, concerning high risk for coronary heart disease (CHD) [3]. The rule below describes a group of overweight female patients older than 63 years: High CHD Risk ←
sex = female & age > 63 years & body mass index > 25 kgm−2
In the second application [4], subgroup describing rules suggest genes that are characteristic for a given cancer type (i.e., leukemia cancer) in an application of distinguishing among 14 different cancer types: leukemia, CNS, lung cancer, etc.: Leukemia ←
KIAA0128 is diff expressed & prostaglandin d2 synthase is not diff expressed
Semantic Subgroup Discovery: Semantic subgroup discovery refers to subgroup discovery, where semantically annotated knowledge sources (ontologies) are used as background knowledge in the data mining process. Using the technology of relational subgroup discovery (RSD) [14], we have developed an approach to information fusion and semantic data mining, enabling background knowledge in the form of ontologies to be used in relational machine learning. The relational subgroup discovery approach, which was successfully adapted and applied to mining of bioinformatics data [12], generates descriptive rules as conjunctions of ontology terms from the GO, KEGG and ENTREZ ontologies. For instance, an induced description of geneGroup(A) discovered by RSD for the CNS (central nervous system) cancer class in a problem of distinguishing between 14 cancer types, determines group of genes A differentially expressed in CNS as a conjunction of two relational features: fi (A) = interaction(A,B) & process(B,’phosphorylation’) and fk (A) = interaction(A,B) & process(B,’negative regulation of apoptosis’) & component(B,’intracellular membrane-bound organelle’). The RSD semantic subgroup discovery approach was further refined in the SEGS algorithm (Searching for Enriched Gene Sets) [13], which is used in the information fusion and
5613
semantic subgroup discovery technology described in this paper. Bisociative Reasoning: The concept of association is at the heart of many of today’s ICT technologies such as information retrieval and data mining. However, scientific discovery requires creative thinking to connect seemingly unrelated information, for example, by using metaphors or analogical reasoning. These modes of thinking allow the mixing of conceptual categories and contexts, which are normally separated. The functional basis for these modes is a mechanism called bisociation [6].1 Goals and Structure of the Paper: This paper investigates a special subgroup discovery task, i.e., the gene set enrichment analysis task, where gene set enrichment is defined as follows: A gene set is enriched if the genes that are members of the set are statistically significantly differentially expressed compared to the rest of the genes. This task is addressed by first performing semantic subgroup discovery with SEGS [13] (outlined in Section II-A), followed by link discovery and graph visualization using Biomine [9] (outlined in Section II-B). The methodology combining the two approaches, named SEGS+Biomine (described in Section III), has been applied to a problem of bisociative knowledge discovery from cell line microarray data (described in Section IV). II. BACKGROUND T ECHNOLOGIES : SEGS AND B IOMINE A. SEGS: Search for Enriched Gene Sets The goal of gene set enrichment analysis is to find groups of genes—gene sets—that are enriched, so that genes in the set are statistically significantly differentially expressed compared to the rest of the genes. Two methods for testing the enrichment of gene sets were previously developed: Gene Set Enrichment Analysis (GSEA, [11]) and Parametric Analysis of Gene Set Enrichment (PAGE, [5]). Originally, these methods take terms (gene sets) from the Gene Ontology (GO), the Kyoto Encyclopedia of Genes and Genomes (KEGG) and ENTREZ interactions, and test whether the genes that are annotated by a specific term are statistically significantly differentially expressed in the given dataset. The SEGS method [13] employs semantically annotated knowledge sources as background knowledge for semantic subgroup discovery. Data from three publicly available, semantically annotated biological repositories GO, KEGG and ENTREZ are used. Based on this background knowledge, SEGS automatically formulates biological hypotheses: rules which define groups of differentially expressed genes. Finally, it estimates the relevance/significance of the formulated hypotheses on experimental microarray data. Compared to GSEA and PAGE, the novelty of SEGS is that it does not only test existing gene sets (defined by individual GO or KEGG terms), but that it formulates and tests also new gene sets, constructed by the combination of GO terms, 1 Bisociative reasoning is at the heart of creative, accidental discovery (serendipity), and is focused on finding unexpected links between concepts of different contexts. Bisociation, as a basis of creative knowledge discovery, is investigated in EU project BISON (http://www.bisonet.eu/).
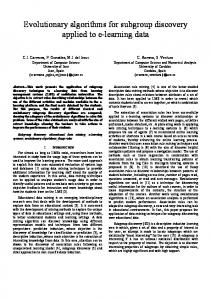
ENTREZ GO KEGG Microarray data Fig. 1.
Fisher Generation of gene sets
GSEA
Enriched gene sets
PAGE
Ranking of genes Schematic representation of the SEGS method.
KEGG terms, and by taking into account also the gene-gene interaction data from ENTREZ. Schematic workflow of the SEGS method (Figure 1) shows its main components: gene ranking, RSD-like hypothesis generation, and hypothesis evaluation (using one, or a combination of different evaluation methods). Consider a functional genomics case study. The data we analyzed with SEGS consists of a set of gene expression measurements (examples), each corresponding to a large number of measured expression values of genes (attributes). Each measurement was extracted from a tissue of a patient with a specific disease; this disease is the class for the given example. The domain, described in [4], [8] and used in our experiments, is a typical scientific discovery domain characterized by a large number of attributes compared to the number of available examples. As such, this domain is especially prone to overfitting, as it has two different cancer classes and few training examples, where the examples are described by thousands of attributes presenting gene expression values. While the standard goal of machine learning is to start from the labeled examples and construct models/classifiers that can successfully classify new, previously unseen examples, our main goal is to uncover interesting patterns/rules that can help to better understand the dependencies between classes (diseases) and attributes (gene expressions values). Table I shows sample top-ranked rules, induced by the SEGS semantic subgroup discovery engine, for two cancer types (ALL and AML), from gene expression profiles obtained by the Affymetrix HU6800 microarray chip, containing probes for 6817 genes, for 73 class-labeled samples of expression vectors. The rules are ranked according to the enrichment score (ES) which measures the enrichment of differential expression of a set of genes, annotated by the given conjunction of GO, KEGG and/or ENTREZ terms. B. Biomine In the Biomine project [9]2 data from several public biological databases were merged into a large graph and a method for link discovery between entities in queries was developed. Nodes in the Biomine graph correspond to entities and concepts (such as gene, protein, domain, phenotype, biological process, tissue), and semantically labeled edges connect the known, annotated relationships between the nodes. A link (a relation between two entities) is manifested as a path or a subgraph connecting the corresponding nodes. Currently, the Biomine graph consists of a total of 1,968,951
5614
2 http://www.cs.helsinki.fi/group/Biomine
Gene Set Description Enriched in ALL 1. ALL ← Func(’zinc ion binding’) & Comp(’chromosomal part’) & Proc(’interphase of mitotic cell cycle’) 2. ALL ← Proc(’DNA metabolism’) 3. ALL ← Func(’ATP binding’) & Comp(’chromosomal part’) & Proc(’DNA replication’) Enriched in AML 1. AML ← Func(’metal ion binding’) & Comp(’cell surface’) & Proc(’response to pest,pathogen,parasite’) 2. AML ← Comp(’lysosome’) 3. AML ← Proc(’inflammatory response’) & Comp(’cell surface’)
ES
1) Ranking of genes. In the first step, class-labeled microarray data is processed and analysed, resulting in a list of genes, ranked according to differential expression. 2) Ontology information fusion. A unified database, consisting of GO (processes, functions and components), KEGG (biological pathways) and ENTREZ (gene-gene interactions) terms and relationships is constructed. To this end, a set of scripts was written, to facilitate updating the integrated database. 3) Discovering groups of differentially expressed genes. The ranked list of genes is used as input to the SEGS algorithm [13]. The result is a list of most relevant gene group descriptions that semantically explain differential gene expression of group members in terms of gene functions, components and processes as annotated in biological ontologies. 4) Finding bisociative links between gene group elements. The elements of the discovered gene groups (individual GO and KEGG terms describing a gene set) are entered as queries to the Biomine crawler. Biomine computes most probable links between these elements in a number of its biological databases. These links help the experts to uncover unexpected bisociative relations and biological mechanisms potentially explaining the underlying biological processes. 5) Gene group visualization. Finally, in order to explore and visually explain the discovered relationships, the discovered links are visualized using the Biomine visualization engine.
0.60 0.59 0.55
0.54 0.53 0.51
TABLE I E NRICHED GENE SET DESCRIPTIONS FOUND IN THE ALL-AML DATA .
nodes and 7,008,607 edges. Some of the databases used in Biomine are summarized in Table II. Although this collection of data sets is not complete, it is sufficiently large and versatile for exploratory link discovery. Node Type Article Biological process Cellular component Molecular function Conserved domain Structural property Gene Entrez Gene cluster Homology group OMIM entry Protein Entrez
Source Database PubMed GO GO GO ENTREZ Domains ENTREZ Structure Gene UniGene HomoloGene OMIM Protein
Nodes 330,970 10,744 1,807 7,922 15,727 26,425 395,611 362,155 35,478 15,253 741,856
Degree 6.92 6.76 16.21 7.28 99.82 3.33 6.09 2.36 14.68 34.35 5.36
Biomine databases
TABLE II DATABASES INCLUDED IN B IOMINE .
SEGS rules
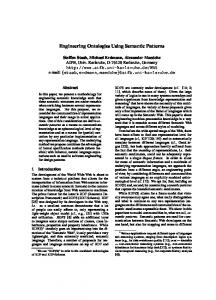
III. SEGS+B IOMINE M ETHODOLOGY FOR B ISOCIATIVE K NOWLEDGE D ISCOVERY The SEGS+Biomine method, aimed at exploratory analysis of differentially expressed gene sets, is performed through semantic subgroup discovery by SEGS, followed by link discovery and visualization by Biomine. The Biomine service is a valuable addition to SEGS, complementing our semantic subgroup discovery technology by additional explanatory potential due to additional link discovery and Biomine graph visualization. In our methodology, Biomine is used through its web interface which allows for querying via Biomine named entities, such as a set of GO terms, resulting in a Biomine (sub)graph, which can be visualized for exploration purposes. A sample Biomine graph is shown in Figure 3. The SEGS+Biomine methodology consists of the following ingredients: gene ranking, hypothesis generation by the SEGS method for enriched gene set construction, linking of the discovered gene set to related biomedical databases for bisociative link discovery with Biomine, and Biomine subgraph visualization. The workflow is depicted in Figure 2.
Enriched gene sets
Biomine graph crawler
Graph visualizer
Fig. 2. SEGS+Biomine wokflow (focusing on Biomine, as details of the SEGS workflow are shown in Figure 1).
IV. B ISOCIATIVE E XPLORATION : A S YSTEMS B IOLOGY U SE C ASE In systems biology, the goal is to help the expert to find biological interpretation of wet lab experimental results. We performed an experiment in bisociative knowledge discovery by merging two methods, SEGS and Biomine, that use publicly available biological knowledge for supporting the work of biologists. We combined the two methods in a novel way. First, for the given microarray experimental data, gene group descriptors were identified by the SEGS hypothesis construction and evaluation method, resulting in a list of enriched gene sets (described by conjunctions of GO and KEGG terms). The resulting gene groups are described by terms from different contexts (different ontologies). The
5615
SEGS results were then used as input to Biomine to find links between these terms, thus performing bisociative intercontext link discovery and visualization. We believe that by forming hypotheses with SEGS, constructed as conjunctions of terms from different ontologies, discovering links between them by Biomine, and visualizing the SEGS hypotheses and the discovered links by the Biomine graph visualization engine, the interpretation of the biological mechanisms underlying differential gene expression can be facilitated. In the given systems biology experiment, the task was to analyse microarray data in order to distinguish between fast and slowly growing cell lines. The aim of this study was to characterise slowly growing cell lines, possibly explaining the differences between the cases of fast and slowly growing cell lines through differential expression of gene sets, responsible for cell growth. Gene Set Description 1. SLOW-(vs-FAST) ← Proc(’DNA metabolic process’) & INTERACT(Comp(’cyclin-dependent protein kinase holoenzyme complex’)) 2. SLOW-(vs-FAST) ← Proc(’DNA replication’) & Comp(’nucleus’) & INTERACT(Path(’Cell cycle’)) 3. SLOW-(vs-FAST) ← . . .
lab are trying to get hints on new processes or phenomena observed. This may be especially true for situations when just knowing the final outcome one cannot explain the drug effect, organ function, or disesase satisfactory, since the gross, yet important characteristics of the cells (organ function) are hidden (do not affect visual morphology) or could not be recognized soon enough. An initial predisposition for this approach is wide accessibility and low costs of high throughput microarray analyses which generate appropriate data for in-silico analyses. V. ACKNOWLEDGMENT The work presented in this paper was supported by the Slovenian Research Agency grant Knowledge Technologies, and by the grant of the European Commission under the 7th Framework Programme FP7-ICT-2007-C FET-Open, contract no. BISON-211898. We thank Igor Trajkovski for his previous work on SEGS, and Hannu Toivonen and Kimmo Kulovesi for their help when using Biomine. R EFERENCES
TABLE III T OP SEGS RULES FOUND IN THE CELL GROWTH EXPERIMENT.
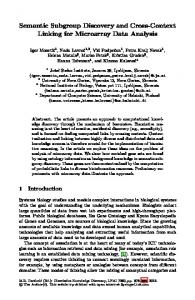
Table III gives the top ranked rules resulting from the SEGS search for enriched gene sets. Each rule describes a corresponding set of over-expressed genes from the experimental data. Figure 3 shows a part of the Biomine graph which links genes of a selected subset of the enriched gene set to the rest of the nodes in the Biomine graph.
Fig. 3. Biomine subgraph related to three genes from the enriched gene set constructed by SEGS. Note that some information is disguised, due to the restricted nature of the results of this study.
We believe that SEGS in combination with Biomine may give a wet lab scientist additional hints on what to focus on when comparing the expression data of cells. Additionally, such an in-silico analysis can considerably lower the costs of in-vitro experiments with which the researchers in the wet
[1] H. Bostrom et al. On the definition of information fusion as a field of research. Technical report, University of Sk¨ovde, School of Humanities and Informatics, 2007. [2] E. Dura, B. Gawronska, B. Olsson and B. Erlendsson, Towards Information Fusion in Pathway Evaluation: Encoding Relations in Biomedical Texts. Proc. of the 9th International Conference on Information Fusion, 2006. [3] D. Gamberger and N. Lavraˇc. Expert-Guided Subgroup Discovery: Methodology and Application. Journal of Artificial Intelligence Research 17:501–527, 2002. ˇ [4] D. Gamberger, N. Lavraˇc, F. Zelezn´ y, and J. Tolar. Induction of comprehensible models for gene expression datasets by the subgroup discovery methodology. Journal of Biomedical Informatics 37:269– 284, 2004. [5] S.Y. Kim and D.J. Volsky. PAGE: Parametric Analysis of Gene Set Enrichment. BMC Bioinformatics 6:144, 2005. [6] A. Koestler. The Act of Creation, The Macmillan Co, New York, 1964. [7] S. Racunas and C. Griffin, Logical data fusion for biological hypothesis evaluation. Proc. of the 8th International Conference on Information Fusion, 2005. [8] S. Ramaswamy et al. Multiclass cancer diagnosis using tumor gene expression signitures. In Proceedings of the National Academy of Science, USA, 98(26): 15149–15154, 2001. [9] P. Sevon, L. Eronen, P. Hintsanen, K. Kulovesi, and H. Toivonen. Link discovery in graphs derived from biological databases. In Proceedings of 3rd International Workshop on Data Integration in the Life Sciences, (DILS’06), July 2006. Springer. [10] Smirnov, M. Pashkin, N. Shilov, T. Levashova and A. Krizhanovsky, Intelligent Support for Distributed Operational Decision Making. In: Proceedings of the 9th International Conference on Information Fusion, 2006. [11] P. Subramanian, P. Tamayo, V.K. Mootha, S. Mukherjee, B.L. Ebert, M.A. Gillette, et al. Gene set enrichment analysis: A knowledge based approach for interpreting genome-wide expression profiles. In Proceedings of the National Academy of Science, USA, 102(43):15545– 15550, 2005. ˇ [12] I. Trajkovski, F. Zelezny, N. Lavraˇc, and J. Tolar. Learning relational descriptions of differentially expressed gene groups. IEEE Transactions of Systems, Man and Cybernetics C, special issue on Intelligent Computation for Bioinformatics, 38(1): 16–25, 2008a. [13] I. Trajkovski, N. Lavraˇc, and J. Tolar. SEGS: Search for enriched gene sets in microarray data. Journal of Biomedical Informatics, 41(4):588– 601, 2008b. ˇ [14] F. Zelezny and N. Lavraˇc. Propositionalization-based relational subgroup discovery with RSD. Machine Learning, 62(1–2): 33–63, 2007.
5616