Semantic Visualization of Biochemical Databases Esteban Zim´anyi and Sabri Skhiri dit Gabouje? Department of Informatics & Networks, Faculty of Engineering CP 165/15, Universit´e Libre de Bruxelles, 50 av. F.D. Roosevelt, 1050 Brussels, Belgium email:
[email protected],
[email protected]
Abstract. Extracting and visualizing information from biochemical databases is one of the most important challenges in biochemical research. The huge quantity and high complexity of the data available force the biologist to use sophisticated tools for extracting and interpreting accurately the information extracted from the database. These tools must define a graphical semantics associated to the data semantics in accordance with biologist usages. The aim of these tools is to display complex biochemical networks in a readable and understandable way. In this paper we define the notion of customizable representation model, which allows the biologist to change the graphical semantics associated to the data semantics. The approach is also generic since our graphical semantics is common to several kinds of biochemical networks. We also defined adaptive graph layout algorithms taking into account the particular semantics of biochemical networks. We show how we implemented these notions in the BioMaze project1 .
1
Introduction
Data visualization is an important research area in bioinformatics. The availability of the complete sequence from more than 50 genomes of organisms ranging from bacteria to human leads to huge biochemical databases, and this critical mass of data is still rapidly increasing. Biochemical databases typically contain information about biochemical entities such as compounds, genes, and polypeptides, as well as the interactions between them. There are two categories of interactions: (1) transformations, such as reactions (between compounds), expressions (of a gene that lead to synthesis of polypeptides), assembly-disassembly (between biochemical entities) and (2) control, like catalysis (a polypeptide catalyzes or inhibits one or more biochemical reactions), or activation-deactivation (turning on or off the biochemical function of a polypeptide). ? 1
This work was partially funded by the Wallonia Region under the BioMaze project. The partners of the Biomaze project (http://cs.ulb.ac.be/research/biomaze/) are Universit´e Libre de Bruxelles, Universit´e Catholique de Louvain-la-neuve and Facult´es Universitaires Notre-Dame de la Paix de Namur.
The term biochemical pathway or biochemical network regroups different families of networks. Metabolic pathways are networks of biochemical reactions catalyzed by polypeptides resulting from the expression of a gene. This expression is controlled by a set of parameters like transcription factors, activation, inhibition, etc. For this reason metabolic pathways are said to be genetically regulated. These regulatory actions are represented in metabolic regulation networks. Finally, signal transduction networks describe the information transfer from a cellular location, typically the extra cellular medium, to another, typically the cell nucleus.
L-Homoserine Succinyl-CoA
2.3.1.46 CoA
O-Succinyl-L-homoserine L-Cysteine 4.2.99.9 Succinate Cystathionine
4.4.1.8 Pyruvate NH3 L-Homocysteine 5-MethylTHF
2.1.1.13
2.1.1.14
THF
Tetrahydropteroyl tri-L-glutamate
5Methyltethrahydr opteroyltri-Lgutamate
L-Methionine
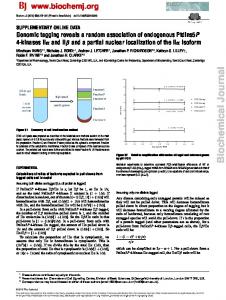
Fig. 1. Metabolic pathway of the methionine synthesis. The boxes represent the biochemical reactions and the arrows show the direction (from substrates to products).
As pointed out by [4] there is a great deal of variation in the structure of different biochemical databases, such as Swiss-Prot, GenBank, or BioCyc. We can distinguish two types of approaches: either the database aims to represent as much as possible our biological knowledge, or the contents of database is structured according to particular application objectives. As a consequence the quality of data extraction depends on the quality of the database structure.
Further, the quality of the analysis depends on the quality of the data extraction from the database. Finally, high-performance visualization tools are needed due to the huge amount of data. Biochemical databases are used in many different research areas. For example, the pharmaceutical industry can reduce the time and the cost of design of new drugs with what is called rational design: biochemical databases can be used to identify a drug target, to find metabolites involved in a particular pathway, or to find polypeptides that catalyze a specified reaction. In toxicology, these databases can be used for simulate in silico the introduction of a specific biochemical compound in the metabolism, asking all pathways implied by this introduction. Biochemical databases can also be used in bacteriology: the knowledge of the complete genome and the metabolic networks of bacteria can be useful for taking advantage of it (e.g., in bio-degradation) or for fighting it. Since visualization plays a key role in this kind of applications, it has to outline the semantics of data in a readable way. A representation model describes the graphical semantics associated to each element. For example, a reaction may be represented by a box having some width and height, the compound by a circle of some radius in which a particular icon is shown, etc. A representation model has to be chosen with care, because it determines the comprehension of the data semantics. This paper focuses on the visualization problem and the solutions proposed by the BioMaze project. The objective of the project is to develop tools for the storage, analysis, and visualization of biochemical pathways, in particular (1) metabolic pathways with genetic regulation, (2) signal transduction, and (3) interaction graphs describing all possible interactions between two biochemical entities. Section 2 describes the global context of the BioMaze project. In Section 3 we review the visualization problem and its implementation in popular biochemical databases, while Section 4 describes our solution to these visualization problems. Finally, in Section 5 we summarize our work and give further perspectives.
2
The BioMaze Project
A major challenge of the post-genomic era is to determine the functions of all the genes and gene products at the genome level. In order to improve the prediction of such functions it is important to take in account the information about the different organization levels of the living cell. In particular, it is necessary to consider the set of physical and functional interactions between genes and proteins. Such interactions form networks of cellular processes, called biochemical networks, which include metabolic networks, regulatory networks for gene expression, and signal transduction. The huge quantity of data available and its continuous growth, the need to integrate such information, as well as the necessity of sophisticated software tools for manipulating it represent true challenges for the research in bioinformatics. New tools for integrating, querying, extracting, analyzing, and visualizing
biochemical databases are essential for the pharmaceutical and biotechnology industry, in particular for the design of new drugs and vaccines. Such highly sophisticated tools must be designed by multi-disciplinary teams, and require recent results in computer science in areas such as operational research (graph algorithms, constraint logic programming, automatic learning, form recognition, etc.), databases (huge schema management, object-oriented interfaces, evolution, meta-data, etc.), and visualization (multi-resolution, multi-representation, complexity management, etc.). The aim of the BioMaze project is to develop a set of tools including: 1. an information system allowing to represent information about biochemical networks, and including functions for evolution management, generation, and documentation; 2. an open system of specialized software components to exploit biochemical data, including extraction, analysis, navigation, and visualization; and 3. a Web interface given access to the services providing by those specialized components. 2.1
The BioMaze Information System
Nowadays many companies in the pharmaceutical and biotechnology sectors use approaches at the genomic scale in the design of more specific drugs. This requires the characterization of both the function of individual genes or proteins as well as the physical and functional interactions in which they participate. Existing general databases, such as Swiss-Prot [2] and GenBank [1], may be used to certain extent for determining if a group of genes is implied in a particular cellular process (e.g., in a metabolic pathway). This approach is limited since the information contained in most databases is not appropriate for establishing functional relations between genes and their products. Further, these databases store their information mostly in text form, making difficult its computer analysis. For this reason, more specialized databases representing information on cellular processes and interactions were developed (e.g., EcoCyc [7]). However, most of these databases cope with only one type of biochemical networks (either protein-protein interactions, gene regulations, or signal transduction) and offer very restrictive analysis tools. The goal of the aMaze database [9], which underlies the BioMaze project, is to provide a rich source of information about different protein functions and cellular processes. In particular, aMaze allows to associate individual biological entities and interactions into large complex networks describing different types of cellular processes. The aMaze data model [13, 14] comprises three basic classes of objects: Biochemical Entity, Biochemical Interaction, and Process. A Biochemical Entity represents physical entities (such as protein, gene, compound, etc.) and their structural properties (e.g., gene position on the chromosome). A Biochemical Interaction represents molecular activities, which can be of several types. Entity Processing has Biochemical Entities as input and as output (such as chemical
reaction, and protein-protein interaction). On the other hand, Control has a Biochemical Entity as input and another Biochemical Interaction as output (e.g., a catalysis is an interaction between a protein and a reaction). Finally, Process represents a collection of interconnected elements. It allows to build graphs of biochemical pathways at various levels. They can be built at the enzyme and metabolite level by considering the chemical reactions as nodes and linking them through their inputs and outputs, or at the pathway level by considering whole pathways as nodes and linking those via common key metabolites. The aMaze model covers a large variety of activities (transcriptional regulation, attenuation, macromolecule processing, transport, etc.) and processes (metabolic regulation, signal transduction) and deals with spatial locations and compartments. These last two aspects are important for interactions, for example a transduction by phosphorylation in the nucleus cell can be differentiated from the same interaction in cytoplasmic medium. The aMaze database provides a rich description of the current state of our knowledge about biology and biochemical processes. However, since this knowledge evolves as new results from biological research become available, the database schema must also evolve for reflecting this knowledge. It is well-known that database evolution is a labor-intensive activity, since a modification of the database schema implies modifications of all related database components both at the schema level (e.g., tables, constraints, programs, forms, Web interfaces, etc.) and at the data level (e.g., migrating data from old structures to new structures). Thus, CASE tools are needed for ensuring the coherence of all such modifications. The BioMaze project uses DB-Main [5], a powerful CASE tool allowing forward and reverse engineering. The aMaze database is described in DB-Main using a generalized entity-relationship conceptual schema with inheritance, aggregation, etc. From this conceptual schema the logical and physical schemas of the database are generated. DB-Main copes with many logical models including relational, object-relational, and semi-structured (XML) models, as well as the physical models of many available DBMSs, in particular PostgreSQL on which the aMaze database is currently implemented. One of the objectives of the BioMaze project is to extend the DB-Main tool with sophisticated services for schema evolution. Such services include: (1) automatic documentation of the database addressed for both users and developpers of other tools, (2) code generation, allowing to produce schema definition (in SQL, Java, and XML) and mappings between these schemas, (3) management of the evolution, coping with the propagation of semantic modifications to the different schemas and mappings, and isolating the applicative components from such modifications. However, as we will se later, the other components of the BioMaze tool that manage annotation, retrieval, and visualization must also deal with the evolution of the underlying database.
2.2
Analysis Tools
In order to allow an efficient exploitation of biochemical databases, sophisticated analysis tools are needed. Such tools allow the user to select, search, and navigate complex biochemical networks. A common requirement is the search of specific paths into a particular network, for example (1) finding all processes transforming the compound A into B in less than X steps, where the term transform refers to a biochemical reaction or to a gene expression, or (2) finding all reactions catalyzed by a set of genes (sub-graph extraction). The search of similarities is another important requirement when analyzing biochemical networks. For example, it is necessary to compare the metabolic pathways of different organisms (in designing specific drugs) or of different tissues (in understanding diseases and treatment design). It is also necessary to determine common characteristics as well as differences between networks, and to predict missing elements. In the context of the project we are developing tools for discovering recurring topological patterns among biochemical networks, at different resolution levels. Such tools also allow to discover similarities and differences between such networks. These tools are developed using constraint logic programming on the Oz-Mozart platform [15]. They are based on methods coming from operational research and algorithmics, including artificial learning and statistical methods.
3
Visualization Issues
We describe next the problems raised by the visualization of biochemical networks. In this paper we consider that such networks are represented by bipartite graphs whose nodes are either biochemical entities or interactions. 3.1
Representation Model
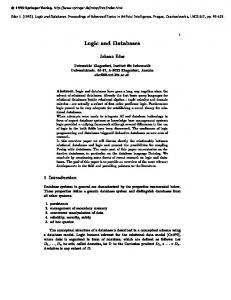
We call representation model the graphical semantics used to represent the data stored in a biochemical database, in particular the biochemical networks. Choosing a representation model is of paramount importance because it has to convey the semantics represented by the data. Although researchers in bioinformatics do not agree about which representation model to use, two schools emerge: one represents metabolic pathways as usual in biochemistry books, as in BioCyc [7], while the second one proposes more expressive models for such pathways, like the Khon model [8], the Cook model [3] or the Maimon and Broming model [10]. An example of the Kohn representation model is given in Figure 2. The problem with simple models is that they are sometimes ambiguous: e.g., an arrow in the Kegg model is used both for representing the input/output of a reaction but also in phosphorylation (i.e., the addition of a phosphate group), or in other cellular transport interactions. On the other hand, although the expressive models convey a rich semantics, the problem is that they are difficult to understand and to read.
Fig. 2. The Kohn representation model. This model represents the data semantics precisely but, sometimes, it is hard to read.
3.2
Database Evolution and Dynamic Diagram Generation
As already said, the database underlying BioMaze frequently evolves to reflect new knowledge resulting from research in cellular biology. Since the visualization tools have to deal with this evolution of data semantics, the diagrams must be generated dynamically, i.e., they are displayed upon user request. This contrasts with some biochemical representation tools, like Kegg [6], in which diagrams are realized manually. Therefore, given a graph representing a biochemical network, the visualization tools must compute the position of each graphical element and draw it without overlapping and minimizing edge crossing. This is a traditional problem of graph layout. In addition, the tool have to deal with the fact that the visualization of metabolic pathways differs from the visualization of interaction
graphs. Metabolic pathways follow a main direction outlining the process, while interaction graphs do not. In [13] is suggested to represent metabolic pathways horizontally (see Figure 1) and regulatory actions vertically. To resolve this problem we must introduce graphical constraints associated to particular subgraphs. 3.3
Signal Transduction Graphs
Signal transduction graphs represent the processes of information transfer from a cellular location to another, typically from the exterior of the cell to its nucleus. From the visualization point of view, signal transduction graphs must be understood as a particular case of general metabolic pathways in which the interactions are of specific type. One issue is to ensure that the graphical semantics stays coherent with the semantics used for metabolic pathways, unlike some biochemical tools. Another issue is to represent the cellular context (i.e., cellular locations and compartments) in which the interactions take place. 3.4
Interaction Graphs
An interaction graph represents all possible interactions between two entities of the same type (e.g., polypeptide-polypeptide or gene-gene) or of different type (e.g., gene-polypeptide). This kind of graph can contain up to 3000 nodes but, in general, the interesting interactions to visualize do not exceed 500 nodes. Such graphs are not visualized like metabolic pathways, since particular graphical constraints have to be adopted. Here we have two important issues: (1) how to display in a readable way huge graphs of many thousand nodes and (2) devising efficient mechanisms for filtering the graph and for allowing users to find set of interactions in which they are interested. 3.5
Navigation
An important visualization issue is the ability to navigate into the database from a graphical selection. Two types of navigation exist: (1) basic navigation allowing the user to obtain textual information about a graphical element, for example the name and other characteristics of a compound, and (2) an advanced navigation allowing to user to create queries from graphical selection, for example finding all pathways where two selected compounds are involved.
4
The Visual BioMaze Approach
This section describes our approach to the problem of visualizing biochemical networks. This approach has been implemented in the the BioMaze visualization module, called Visual BioMaze, resulting into an efficient and flexible visualization tool.
4.1
Customizable and Generic Representation Models
An innovative aspect of our approach is the definition of representation models that are both customizable and generic. These two aspects are explained next. As we have seen in Section 3.1, biologists do not agree on the representation model used for visualizing biochemical networks. Therefore, each tool implements a particular representation model. In order to provide a flexible visualization tool, instead of choosing a particular model we introduced the notion of customizable representation model. This means that the same biochemical network can be visualized with different representation models. The tool provides several predefined models but the users can also customize such models according to their research needs. Further, users may explore alternative representation models over the same biochemical network. As a consequence, this approach allows two new interesting possibilities: (1) users can devise or adapt a model to highlight particular aspects in which they are interested (2) if the database schema evolves and if the information about which entities has evolved is known, a new representation model expanded with these new entities can be (semi-)automatically generated. This latter feature provides an elegant solution for the problem of visualizing an evolving database. On the other hand, the Visual BioMaze tool aims at representing three types of networks: metabolic pathways, signal transduction networks, and interaction networks. The three types of networks are represented as graphs, where the nodes are either biochemical entities (compound, gene, polypeptide) or interactions (reaction, control, signal). Our approach to represent the three types of graphs in an integrated visualization tool is to define a general representation model. This model describes the graphical semantics associated to each entity and interaction node, regardless of the graph type. As a consequence, we can cope with graphs having mixed types. An example of a network composed of a signal transduction part and a metabolic part arrives when a liver’s cell receives the signal that the sugar rate increases in the blood (transduction) and its response in which the insulin acts (metabolic pathway). Since we allow typed subgraphs, the visualization module can recognize the different subgraphs and apply specific graphical constraints according to the subgraph type. 4.2
Implementation
We use XML for implementing representation models. Such models are based on an XML Schema definition that prescribes the correctness of the model and provides validation features. The current representation model defines two objects types, Element and Link corresponding, respectively, to nodes and edges of biochemical graphs. An element defines the graphical semantics associated to each possible interaction, control, and biochemical compound, while a link defines the graphical semantics for the edges between such elements. The code below, extracted from the Visual BioMaze default representation model, represents compounds by a circle
of radius 15 in which an icon compound.bmp is displayed; the identifier of the compound is shown outside the circle (see Figure 3). Compound 15 None None true ?ID Out true /image/compound.bmp true The different tags are as follows. Type defines the node type. Glyph defines the associated graphical semantics and is composed of the following elements. 1. Shape, defining the shape associated to the element, that can be Box, Circle, Ellipse, Arrow, and Tshape. The allowed shapes and their particular attributes are defined using XML Schema. 2. Text, defining the text associated to the element. As shown in Figure 3, the text associated to elements can be displayed outside the shapes (e.g., for compounds) or inside them (e.g., for reactions). This is defined by the Position tag. Further, the text can be either a generic text or a particular attribute of the represented object (e.g., its identifier). This is expressed by introducing a ? character (e.g., ?ID in the above example). 3. BorderColor and FillColor defining the colors of the border and the interior of the shape. 4. Icon, defining if an image must be shown in the shape. 5. BorderVisibility, defining if the shape border is visible. This provides an easy way to introduce new shapes to characterize an interaction. Indeed, if an interaction must be represented by a complex form that does not correspond to the predefined shapes, the user can introduce it as an icon and set the border visibility to false.
1.2.1.11
L-Aspartate 4-semialdehyde
Fig. 3. a) A compound is represented by a circle in which an icon is inserted, and b) A biochemical reaction is represented by a box.
The XML Schema code below defines the possible values for the Type tag of Element. If the database evolves and a new kind of element (i.e., interaction) appears, we can add it to the possible elements and define its link to the other types. The Link tag defines the graphical semantics associated to the edges between interaction types. The example below represents the links from catalysis to reactions by a line whose head is a circle of radius 18 in which is displayed the icon catalyze.jpg and the text +, and without tail (see Figure 4). Catalysis Reaction Continuous Black true 18 Black None true
+ In true /images/catalysis/catalyze.jpg true false 4 The different tags are defined as follows: 1. Between: defines the interactions for which the edge is defined. 2. Effect: describes the line style. 3. Head and Tail: defining the glyphs for the extremities. These glyphs can not be defined if the Present tag is set to false. The head and tail glyphs are important in biochemical network visualization, since some interactions such as inhibition or catalysis are represented by a specific form at the edge extremities.
L-Aspartate Expression
AspartoKinase
-
Catalysis
ATP
Inhibition +
Expression
2.3.1.46
Inhibitor X
ADP 4-Phospho-L-aspartate
Fig. 4. Example of a representation model. When representing links (e.g., from a catalysis to a reaction), graphical elements such as the head glyph, the line effect, the color, etc., are customizable by the representation model.
4.3
The Visual BioMaze Graph Layout Algorithm
Many research efforts have been realized for many years in the area of graph layout and efficient graph layout algorithms have been developed. However, such
algorithms are devised for general graphs and do not take into account semantic issues. These algorithms are inadequate for biochemical networks since these networks have associated particular semantics. For example, a metabolic pathway follows a main direction that the visualization has to outline to represent it efficiently; further the regulatory pathway associated to it cannot be distributed around the pathway but also follows a specific direction. The same observation can be made about transduction signal graphs where the visualization has to outline the message direction. Graph layout algorithms taking into account data semantics are currently a research domain, and there exists commercial tools that provide proprietary solutions. Our approach is to define a graph layout algorithm that is adaptive, adjusting itself to particular subgraph motifs. We are currently developing an algorithm capable of finding linear, cyclic, or hierarchical subgraphs, and locally applying a specialized graph layout. Further, we also provide interchangeable graph layout, giving the user the possibility to choose an existing algorithm, or to define his own. 4.4
The Visual BioMaze Prototype
BioMaze and aMaze are developed in Java under Eclipse [12], a powerful and extensible platform provided by IBM. Under this framework, BioMaze and the BioMaze visualization module, Visual BioMaze, are developed as plug-ins. Figure 5 shows a snapshot of the first Visual BioMaze prototype. It provides the following functions: 1. dynamic generation of a metabolic pathway with a simple graph layout algorithm, 2. the user can apply and define different representation models to the graph to be displayed (the default model is that described by van Helden in [13]), and 3. the user can implement his own graph layout algorithm and load it by the Visual BioMaze tool. The visualization module takes advantage of the extensibility features provided by Eclipse, thus allowing users to customize and extend it. For example, if the user wants to define his own graph layout algorithm, he can create a new plug-in that implements a predefined interface. When the user copies it into the plug-in Eclipse directory the new graph layout algorithm is available in the Visual BioMaze preference pages. If the user wants to distribute it, he only needs to provide the plug-in. In the current version, the user must write the whole graph layout algorithm, but a future version will modularize the different steps of the algorithm allowing the user to define individual steps of it. The following features will be addressed in the next version of the prototype: 1. Expand the representation model for signal transduction. Indeed, the current XML Schema definition cannot specify the graphical semantics associated to an interaction in a particular cellular location.
Fig. 5. The first Visual BioMaze prototype under the Eclipse platform.
2. Introduction of graphical constraints: e.g., in a metabolic pathway the main direction has to be outlined vertically and the regulation path horizontally. Graphical constraints will force the graph layout algorithm to consider these directions. The challenge is to find a trade-off between the expressivity of these constraints and their efficient implementation. 3. To implement a legend editor that provides a user-friendly interface for defining and customizing representation models. Instead of manipulating XML files, the user visually defines the representation model with appropriate dialog boxes. The editor will then automatically generate the corresponding XML file. 4. To implement an advanced navigation system allowing users to formulate queries when clicking on graphical elements. 5. Introduction of the concepts of multi-resolution and multi-representation. Multi-resolution provides the mechanisms for displaying the graph at different levels of detail. Multi-representation provides the mechanisms for considering a particular fact from different viewpoints. In the context of Geographical Information Systems, we have explored these two concepts in the project MurMur [11]. 6. Definition of filters for interaction networks to provide the user a mechanism for selecting the interactions in which he is interested.
5
Conclusion
Nowadays, visualization of biochemical networks is an important challenge in bioinformatics. With the increasing quantity of available information it is essential to use powerful tools for retrieving accurate information from biochemical databases and for visualizing it efficiently. The BioMaze project attempts to answer these needs. In this paper we described the overall objectives of the BioMaze project. Then we presented our approach for visualizing biochemical networks. It consists in defining customizable and generic representation models that provide a general framework where the user can define and apply any representation model on the graph to be visualized. Similarly, we defined adaptive and interchangeable graph layout algorithms taking into account the particular semantics of biochemical networks and allowing the user to define his own algorithm. We described how we implemented these notions in the first prototype of the Visual BioMaze tool using XML and the facilities provided by the Eclipse platform.
References [1] Benson D.A., Karsch-Mizrachi I., Lipman D.J., Ostell J., Wheeler D.L.: GenBank, Nucleic Acids Research, 31(1):23-27, 2003. [2] Boeckmann B., Bairoch A., Apweiler R., Blatter M.-C., Estreicher A., Gasteiger E., Martin L.J., Michoud K., O’Donovan C., Phan I., Pilbout S., Schneider M.: The Swiss-Prot protein sequence database and its supplement TrEMBL. Nucleic Acids Research, 31, 365–370, 2003. [3] Cook D.L., Farley J.F., Tapscott S.J.: A basis for visual language for describing, archiving and analyzing functional models of complex biochemical systems, Genome Biology, 2(4), research0012, 2001. [4] Deville Y., Gilbert D., van Helden J., Wodak S.: An overview of data models for the analysis of biochemical pathways, Briefings in Bioinformatics, 4(3): 246–259, 2003. [5] Englebert V., Hainaut J.-L.: DB-Main: A next generation meta-case, Information Systems, 24(2): 99–112, April 1999. [6] Kanehisa M., Goto S., Kawashima S., Nakaya A.: The Kegg database at GenomeNet, Nucleic acid research, 4(3): 246-259, 2003. [7] Karp P., Paley S., Romero P.: The pathway tools software, Bioinformatics, Vol. 18., Suppl. 1, pp. S225-S232, 2002. [8] Kohn K.W.: Molecular interaction Map of the Mammalian Cell Cycle Control and DNA Repair Systems, Molecular Biology of the Cell, Vol. 10, pp. 2703–2734, 1999. [9] Lemer C., Antezana E., Couche F., Fays F., Santolaria X., Janky R., Deville Y., Richelle J., Wodak S.J.: The aMAZE LightBench: a web interface to a relational database of cellular processes, Nucleic Acids Research, 32, D443-D44. [10] Maimon R., Browning S.: Diagrammatic Notation and Computational Structure of Gene Network. In Proc. of the 2nd Int. Conf. on Systems Biology, 2001. [11] Parent C., Spaccapietra S., Zim´ anyi E.: Murmur: Database management of multiple representations In Proc. of the AAAI-2000 Workshop on Spatial and Temporal Granularity, pp. 83-86, 2000.
[12] Shavor S., D’Anjou J., Fairbrother S., Kehn D., Kellerman J., McCarthy P., The Java Developer’s Guide to Eclipse, Addison-Wesley, 2003. [13] van Helden J., Naim A., Mancuso R., Eldridge M., Wernish L., Glibert D., Wodak S.: Representing and analysing molecular and cellular function in computer. Biol. Chem., 381(9–10):921–935. 2000. [14] van Helden, J., Naim, A., Lemer, C., Mancuso, R., Eldridge, M., Wodak, S.: ¿From molecular activities and processes to biological function. Briefings in Bioinformatics, 2(1): 81-93, 2001. [15] Van Roy P., Brand P., Duchier D., Haridi S., Henz M., Schulte, C.: Logic programming in the context of multiparadigm programming: The Oz experience, Theory and Practice of Logic Programming, 3(6):717–763, 2003.