Symbolic location of a user, like a store name in a mall, is essential for context-based ..... PHP script, and stored in a MySQL database. The sensor data from the ...
SensOrchestra: Collaborative Sensing for Symbolic Location Recognition Heng-Tze Cheng, Feng-Tso Sun, Senaka Buthpitiya, and Martin Griss Department of Electrical and Computer Engineering Carnegie Mellon University {hengtze.cheng,lucas.sun,senaka.buthpitiya,martin.griss}@sv.cmu.edu
Abstract. Symbolic location of a user, like a store name in a mall, is
essential for context-based mobile advertising. Existing fingerprintbased localization using only a single phone is susceptible to noise, and has a major limitation in that the phone has to be held in the hand at all times. In this paper, we present SensOrchestra, a collaborative sensing framework for symbolic location recognition that groups nearby phones to recognize ambient sounds and images of a location collaboratively. We investigated audio and image features, and designed a classifier fusion model to integrate estimates from different phones. We also evaluated the energy consumption, bandwidth, and response time of the system. Experimental results show that SensOrchestra achieved 87.7% recognition accuracy, which reduces the error rate of single-phone approach by 2X, and eliminates the limitations on how users carry their phones. We believe general location or activity recognition systems can all benefit from this collaborative framework. Key words: Collaborative sensing, mobile phone sensing, localization, contextawareness, context-based advertising
1 Introduction Context-based mobile advertising matches advertisement and e-coupons with potential customers according to their locations, activities, or interests [20, 21, 25]. Symbolic location of a user, such as a store name, is important since a user can get exclusive coupons based on their frequent visits, or receive product recommendations from similar shops. In this work, we focus on the problem of how to recognize the store (e.g. a caf´e, an electronics store, or a clothing store) that a user is in when the user is shopping at a mall with a variety of stores, using only microphones and cameras on mobile phones. GPS does not work in this scenario since most stores in malls are indoors. Although extensive work has been done in indoor localization [2, 16, 23, 15], most systems are still limited by infrastructure or specific hardware requirements, thus they are unlikely to be widely deployed in every store. Even with an indoor
2
Heng-Tze Cheng et al. Back-End Server
Mobile Phones Proximity Detection Ambient Sound
Images
Sensor Module Bluetooth Scan
Data Preprocessing Collaborative Sensor Data
Indoor Shopping Mall
Ad-Hoc Group Formation
Group Information
Audio Feature Extraction
Image Feature Extraction
Store Classification
Phone Position Detection
Classifier Fusion Estimated Store Visited Store Database
Context-based Mobile Advertising
Targeted Ads/Coupons
Fig. 1. The system architecture of SensOrchestra.
localization system with room-level accuracy, slight errors in coordinates often place a phone at the wrong side of a wall dividing two adjacent stores [1]. Recent research, SurroundSense [1], achieved promising results on symbolic location inference using mobile phones to fingerprint ambient sound, light, color, and motion signatures. However, in order to capture images and audio, a major limitation faced by SurroundSense is that the phone has to be held in the hand at all times, which may not be the way general users usually carry their phones. Simply putting a phone in one’s pocket renders the microphone muffled and the camera useless [17]. Since only one single phone is used to detect a user’s surroundings, if the phone is facing a source of noise, it is difficult to eliminate the influence of noise and recover from an incorrect inference. To address the challenges mentioned above, we have developed SensOrchestra, a multi-phone collaborative sensing framework for symbolic location recognition. Using Bluetooth-based proximity detection, SensOrchestra groups nearby phones to sense the ambience together, and then combines the correlated sensor data using a classifier fusion model for location inference. Using multiple phones implies concurrent sensing of the same environment from different positions, thus increasing the chance of getting more useful raw data for context inference and becoming less susceptible to ambient changes. This eliminates the major limitation that the phone has to be held in the hand at all times to recognize a location. Furthermore, SensOrchestra achieves promising results using only microphones and cameras, which are the basic sensors on most of today’s mobile phones, without the need of any custom-made hardware or specific infrastructure. A natural concern is that as the number of stores increases, the fingerprintbased approach seems impractical because it is unlikely that we can find unique audiovisual signatures for every store in a city. However, it should be noted that our approach does not need to be able to differentiate all the stores in distant locations. Although existing GPS or GSM-based positioning system was shown to be unable to identify different neighboring stores [1], it is accurate enough for determining locations in a macro-scale, such as the name or a specific part of a mall. Once the macro-location is known, the candidate symbolic locations can be confined to a limited set. The importance of fingerprint-based indoor localization
SensOrchestra: Collaborative Sensing for Symbolic Location Recognition
3
system is thus to discriminate the ambient signatures of the fine-grained symbolic locations in the same macro-location, such as several neighboring shops in the same part of a mall. The main contributions of this paper are: – The design, implementation, and evaluation of SensOrchestra, a collaborative symbolic location recognition system that combines sensor data from multiple nearby phones. – The design of a classifier fusion model to integrate estimates from multiple phones, and compensates the incorrect estimates caused by ambient noise. – The investigation of multiple audio and image features, and a complete experiment with realistic setting to compare the effect of different phone positions and multi-phone sensor data fusion. The paper is organized as follows. In Section 2, we discuss and compare related work. The system design and the method for collaborative location recognition are elaborated in Section 3, and the implementation details in Section 4. In Section 5 and 6 we discuss the dataset used for evaluation and the experimental results. Discussion and conclusion are elaborated in Section 7 and 8, respectively.
2 Related Work In the field of physical indoor localization [16], the Cricket system [23] achieved centimeter-scale localization using RF and ultrasound beacons installed in the surroundings. While effective for high-budget applications, this kind of system is unlikely to be widely installed in every store in a city. The RADAR [2] system achieved 5-meter accuracy using Wi-Fi fingerprinting, with a tradeoff that careful calibration of Wi-Fi signal strengths are needed at many physical positions in the building, which may not scale over wide areas. In SensOrchestra, we use only mobile phones that people already have. Therefore, our system is low-cost and can be applied to most stores, without the need for additional infrastructure or custom-made hardware. There has been an emerging interest in user context inference using mobile phones in recent years. While CenceMe [18] infers user activities and social context using microphone and accelerometer on mobile phones, SoundSense [17] achieves general sound classification (ambient sound, music, speech) with over 90% accuracy and learns new sound events in different users’ daily lifes. SurroundSense [1] incorprates more modalities, including microphone, camera, accelerometer, and Wi-Fi, to achieve ambience fingerprinting for symbolic localization. However, one common feature is that no benefit is gained when there is more than one phone nearby. Building on their ideas, we extend their work by introducing a multi-phone collaborative framework that removes the limitation on where users put their phones and lessens the susceptibility of a single phone to ambient noise.
4
Heng-Tze Cheng et al.
Similar to fingerprint-based localization, the notion of scene classification has been investigated extensively in the field of computer vision and audio recognition. In [5], probabilistic Latent Semantic Analysis (pLSA) is used to model the latent topics in the images, which are then classified into different scene categories like coast, mountain, or city. In [9, 11], both time- and frequencydomain features of audio are extracted to recognize high-level context like locations (street, home, office) or sound events (rain, thunder, train). A major difference is that these works focus mainly on novel statistical learning techniques, using high-quality audiovisual data recorded by standalone cameras or microphones. On the contrary, our work addresses real-world challenges when most phones are resource-limited and not in good positions to sense the environment. There has also been related work exploring the idea of collaborative or participatory sensing [3, 7, 19, 22]. The PIER system [19] uses participatory sensing to collect GPS traces and calculate personal environmental impact and exposure. In VUPoint [3], nearby phones are grouped together to collaboratively record video of social events triggered by ambient changes, but they did not use the recorded video to infer high-level user context. In addition, rather than prompting the user to actively record events or take sensor readings, SensOrchestra senses the ambience in the background without the need of user’s attention. This introduces additional challenges because the sensor data can be noisy and less informative. Different from them in terms of primary goal, sensor data type, and statistical learning methods, our work is one of the earliest attempts to use collaborative sensing for symbolic location recognition.
3 System Design and Method Given a set of audiovisual observations of the ambience sensed by multiple nearby phones, the goal of SensOrchestra is to estimate the symbolic location that a user is most likely at. The system architecture is shown in Figure 1. We describe each part of the system as follows. 3.1 Proximity Detection and Group Formation The purpose of proximity detection is to assign the phones in the same symbolic location to the same group for collaborative sensing. Among several candidate techniques, such as the acoustic grouping using short high-frequency chirps outside the audible frequency range [3], we adopt Bluetooth for proximity detection because it is simple and available for most devices without the need for additional processing. While Bluetooth signal can sometimes pass through walls, other state-of-the-art proximity detection techniques can be further incorporated to ensure that all the phones in a group are in the same store. Our approach works as follows. First, a phone performs a background Bluetooth scan and transmits a list of Bluetooth addresses of discovered devices to
SensOrchestra: Collaborative Sensing for Symbolic Location Recognition
5
MFCC Dimension
Papyrus (Books/Gifts)
Time (frame) MFCC Dimension
Abercrombie (Fashion)
Time (frame) MFCC Dimension
Starbucks (Cafe)
Time (frame)
Fig. 2. An example of MFCC features extracted from three stores. The color shows the feature value of each dimension at each time frame.
the server. The Bluetooth address for each device is a unique, 48-bit address (e.g. 00:12:d2:41:35:e4). After receiving the address list, the server clusters two devices in the same group if both of them appear in each other’s list. Since the range of Bluetooth is roughly 10 meters (32.8 feet), it is suitable for forming a group in a typical-size store. The reason why we do not use Bluetooth pairing is the concern of intrusiveness and time. If a mobile phone prompts a user to pair with another device every time a new device is found, it would be highly intrusive, time-consuming and thus undesirable. To preserve the privacy of other mobile phone users, the server discards the Bluetooth address coming from any device that is not running SensOrchestra. 3.2 Mobile Phone Sensing After an anonymous ad-hoc group is formed, each phone records audio at an 8 kHz sampling rate and take one image every 8 seconds. Each sensing session is 30 seconds. After a sensing session ends, the sensor data and the list of discovered Bluetooth addresses are transmitted to the server through 3G or Wi-Fi connection. 3.3 Feature Extraction Audio Feature Extraction For audio features, we adopt Mel-frequency cepstral coefficients (MFCC), one of the most important features for audio signal processing, speech recognition, and auditory scene analysis [9, 12]. MFCC describes the short-term power spectrum over frequency bands from 20 to 16000 Hz, with finer details in the bands to which human ears are sensitive. For each
Heng-Tze Cheng et al.
Value (Brightness)
Value (Brightness)
6
Sa
tur
ati
Hue
on
Starbucks (Cafe)
Sa
tur ati
on
Hue
Abercrombie (Fashion)
Fig. 3. Example of images taken from two stores and the corresponding dominant color distributions.
30-second audio, we extract MFCC using a window size of 256 samples (32 ms when the audio sampling rate is 8kHz). The resulting feature is a 13-dimensional vector for each time frame. We calculate mean and standard deviation of each dimension over the 30-second interval, resulting in a 26-dimensional feature vector (13 for mean, 13 for standard deviation) for each sensing session. Examples of MFCC features are shown in Figure 2, from which we can roughly observe that different stores have different signatures (e.g. high-frequency coffee machine sounds in a cafe) in each dimension of MFCC. Image Feature Extraction Since different stores differ in light and dominant colors, for image features we adopt the dominant color distribution [1, 10], a widely used feature for image classification. In each 30-second time frame, we first concatenate the 4 images taken in the session into one combined image, and convert the image from RGB into Hue-Saturation-Value (HSV) color space. The reason that we use HSV color space is because of its similarities to the way humans tend to perceive color, and it is less sensitive to shadow and shading [5]. Since the dimension of the combined image is very high, dimension reduction or a clustering algorithm is needed to extract the compact information for analysis while discarding the redundancy. Therefore, in each image we cluster all pixels by K-means clustering algorithm [13], so that the characteristics of each image can be represented by a small number of clusters. The resulting clusters roughly represents the dominant colors (e.g. red, brown, white, etc.) in a particular store. As shown in Figure 3, the images from the two stores differ in cluster centroid
SensOrchestra: Collaborative Sensing for Symbolic Location Recognition
Actual Store St
O1,t
Classifier1 w1
O2,t
Classifier2
...
... ON,t
7
w2
Estimated Store Classifier St* Fusion
wN
ClassifierN
Observed Features
Fig. 4. Classifier fusion model for multi-phone collaborative location recognition.
(HSV value of the dominant colors) and cluster size. In our implementation, K is empirically set to 5. To compare the similarity between the color distribution of two images, we adopt the notion of color similarity measure described in [10] and [1]. The intuition is that two images, I1 and I2 , are similar if they both have many pixels of similar colors. Let {C1,1 , C1,2 , ..., C1,K } and {C2,1 , C2,2 , ..., C2,K } represent the set of pixel clusters in image I1 and I2 , respectively. The intuition leads to the following definition of color similarity S: S(I1 , I2 ) =
X i,j
1 n(C1,i )n(C2,j ) δ(i, j) n(I1 )n(I2 )
(1)
where δ(i, j) denotes the Euclidean distance between the centroid of C1,i (the ith cluster of I1 ) and C2,j (the j th cluster of I2 ). n(·) represents the total number of pixels in a cluster or an image. In other words, if two images are similar, the color cluster centroids are close to each other in the HSV color space, and a large number of pixels belongs to the same dominant color cluster in both images. 3.4 Phone Position Detection In SensOrchestra, we do not constrain the positions of phones when they are sensing the ambience. Therefore, before using the audio and image features for location recognition, we first detect the information of phone position (inside or outside the pocket) to determine the reliability of sensor data from a certain phone. We use average audio energy and mean of image luminance as features. The intuition is that if the phone is in the pocket (or generally covered by clothing or bags), the images will be dark and the average audio volume recorded will be much lower. A two-class support vector machine (SVM) classifier [6] is trained to classify whether the phone is “in the pocket” or “outside the pocket.” The information is used in the next step for a final decision on location recognition.
8
Heng-Tze Cheng et al.
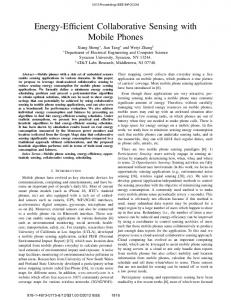
3.5 Classifier Fusion Model The classifier fusion model is shown in Figure 4. Suppose there are N users in store St at time t, observing features O1,t , O2,t , ..., ON,t , respectively. For each individual observation, we use a k-Nearest Neighbor (k-NN) classifier [4] to estimate the most likely store. Specifically, for each sample of testing audio or image features, we calculate the distance from each of the samples in the training set. For MFCC, Euclidean distance between two feature vectors is used. For color distribution features, the pair-wise distance is computed by the similarity measure defined in equation (1). After each classifier outputs an estimate, we use a weighted majority vote approach for classifier fusion. The weighting is trained by the relative classification accuracy using the data collected from ”inside-the-pocket” versus ”outside-thepocket.” The intuition is that if the data were sensed from a phone inside the pocket, the estimate based on the data is less reliable because the microphone was muffled. Thus, its vote is multiplied by a lower weight wpocket ; otherwise, the vote is multiplied by (1 − wpocket ). According to the experimental results, we set wpocket to 0.4. Finally, based on the weighted sum of votes from different phones, the store class with the most votes is the final estimate St∗ . After a sequence of estimates St∗ is produced, we apply a temporal-smoothing process to take temporal continuity into account. The intuition is that a user’s location trace is continuous in time and unlikely to switch swiftly between several stores. Specifically, using a moving window of the size of 3 consecutive estimates, ∗ the final smoothed store decision Ssmooth,t at each time t is defined as: ( ∗ ∗ ∗ ∗ St−1 if St−1 = St+1 and St∗ 6= St−1 ∗ (2) Ssmooth,t = otherwise St∗
4 Implementation The client-side program of SensOrchestra is implemented in Python for Symbian S60 [26] platform v1.4.5 on Nokia N95 phones. The background Bluetooth scanning part is implemented using the code from the Personal Distributed Information Store (PDIS) project [24] at Helsinki Institute for Information Technology. The audio is recorded in WAV format with a sampling frequency of 8 kHz, and the images are stored in 640 × 480 JPEG format. The sensor data and the timestamp information are transmitted to an Apache Server, handled by a PHP script, and stored in a MySQL database. The sensor data from the phones within the same group are analyzed by the classifier fusion model implemented in MATLAB, and then the phones retrieve the recognition result from the server. The Support Vector Machine classifier used in phone position detection is implemented using LIBSVM [8].
SensOrchestra: Collaborative Sensing for Symbolic Location Recognition
9
Table 1. The effect of phone positions (inside pocket vs. outside pocket) on store classification accuracy. Phone Positioin
Inside Pocket Outside Pocket
Classification Acc. 59.5%
79.8%
Table 2. Comparison of store classification accuracy using single phone vs. multi-phone collaborative sensing. Single-Phone Approach Feature
Collaborative Sensing
Phone1 Phone2 Phone3 Phone4 Avg. 4-Phones
Color Distribution 68.8% 62.5% 59.4% 51.2% 60.3% Audio MFCC 75.6% 73.6% 82.6% 70.7% 74.9%
70.1% 84.8%
+Temporal 73.0% 87.7%
5 Dataset We evaluated SensOrchestra on a dataset containing 536 sensing sessions. The dataset was collected in 10 different stores at the Stanford shopping mall. Six graduate students from Carnegie Mellon University and Stanford University participated in the data collection and annotation tasks at different times (daytime and evenings on both weekdays and weekends). Four different Nokia N95 phones are used, each running the client-side sensing program of SensOrchestra. Each session consists of a 30-second audio and four images. To facilitate future research in the related field, we will make our dataset available on our website. Throughout the experiment, there were 4 users visiting one store at the same time, each carrying one phone, browsing items in the store like other customers. To simulate a realistic situation, the users were asked to generally keep their phones in their pockets, and occasionally take out their phones for a while. The users holding their phones were asked to mimic general customers’ phone usages, e.g. making phone calls or reading messages. After each sensing session, the user annotated the phone position and the store name, which serve as ground-truth labels in experiments. Due to the realistic settings, most of the data are low quality images caused by motion blur, non-informative views (e.g. other customers or a close-up view of a wall), and unusual camera angles. In addition, most of the audio are recorded when the phones are put in the users’ pocket, resulting in muffled sounds and loss of acoustic details of the surroundings. However, the results show that our approach is reasonably robust to overcome these difficulties.
Heng-Tze Cheng et al.
Accuracy (%)
10
Number of collaborating phones Fig. 5. The effect of the number of collaborators on store classification accuracy using audio features.
6 Evaluation Given each sample (audio and image features extracted from one sensing session), the system classifies the sample as one of the stores in the training set. The results are validated using 10-fold cross-validation. The classification accuracy metric used in this section is calculated by: accuracy =
# correctly classif ied samples # total samples
(3)
6.1 Phone Position Detection Results We first validate the hypothesis that two classes of phone positions (either ”inside-the-pocket” or ”outside-the-pocket”) can be accurately detected. Experimental results shows that either audio energy or mean image luminance is discriminative enough to detect the phone position with 92% and 99% accuracy, respectively. In the classifier fusion step, we determine the weighting of each phone based on the phone position detected by image luminance. 6.2 Impact of Phone Position on Classification Results Next, we investigate how the store classification accuracy will be affected by where users put their phones. We divided the dataset into two subsets depending on whether a sample is sensed by a phone inside or outside the pocket, and ran a store classification experiment on each subset. Only the result using audio features is available since the images are all dark when cameras are put in pockets. The result in Table 1 shows that putting a phone in the pocket severely degrades the classification accuracy since the microphone is muffled. The result also supports our claim that using only one phone can result in poor performance if the user keeps the phone in the pocket most of the times, which suggests the solution of collaborative sensing.
SensOrchestra: Collaborative Sensing for Symbolic Location Recognition
11
Table 3. Confusion matrix of store classification results (shown in percentage) using collaborative sensing and audio features only. Classification Results (Classified As) Ground Truth
Cafe
Body
Cafe Body Care Electronics Men Fashion Women Fashion Books Home Decor Dining
88.8 0 0 4.4 4.2 0 0 2.0
0 88.2 9.7 0 4.2 0 6.9 0
Electr. M.Fash. W.Fash. 0 7.4 61.3 0 12.5 0 5.2 0
0 0 0 95.6 0 0 0 0.7
0 2.9 6.4 0 75.0 5.3 0 0
Books
Home
Dining
0 1.5 3.2 0 4.2 94.7 22.4 0
0 0 19.4 0 0 1.3 63.8 0
11.2 0 0 0 0 0 1.7 97.8
6.3 Collaborative Store Classification Results In this section, we validate our main hypothesis that the collaborative sensing approach of SensOrchestra can improve store classification accuracy over the single-phone approach. For the single-phone approach, we ran experiments by switching the testing set among data from the four phones carried by four users (Phone1 to Phone4). For the collaborative sensing approach, each sample is connected with other samples that were sensed at the same time but from different nearby phones. The individual estimates are aggregated using the classifier fusion approach, which generates the final classification decision. 10-fold cross-validation was applied to both cases. As shown in Table 2, image features (dominant color distribution) yield lower accuracy, probably caused by the low quality of images in the dataset because there was no limitation on phone positions or orientations when the pictures were taken. When using the single-phone approach with only audio features (MFCC) for classification, each phone achieved different performance, with an average accuracy of 75%. Using the 4-phone collaborative sensing approach, we improved the average accuracy to 85%. The result supports our hypothesis that sensor data from different phones actually complement each other. Some errors caused by ambient noise can be compensated if the majority of classification estimates are correct. After the temporal-smoothing process, we achieved 87.7% accuracy using only audio features, which is similar to the accuracy reported in [1] using 4 modalities (audio, image, motion, Wi-Fi), but we do not require the phones to be held in the hand at all times. Also, we used fewer modalities, which implies substantial saving on energy consumed by sensors. We also compare the results using different numbers of collaborators. As shown in Figure 5, while accuracy gradually increases as more phones’ estimates are combined, even adding only one collaborator can improve the accuracy by 6%. More insights can be drawn from the confusion matrix shown in Table 3. The system is effective in recognizing caf´e and the dining restaurant, but can
12
Heng-Tze Cheng et al.
2.5 Audio+Image Audio
Power (W) Power (W)
2 2.5 1.5
Audio+Image Audio
2 1 1.5 0.5 1 0
0
10
20
30
40
50
60
70
Operation Labels
(e)
0 1000
10
(a)
20
(f) 30
(b)
40
50
Time (s)
(c)
60
(d)
70
80 Audio+Image Audio
80
CPU UsageCPU (%) Usage (%)
80
Time (s)
0.5
100 60
Audio+Image Audio
80 40 60 20 40 0
0
10
20
30
0
40
50
60
70
80
50
60
70
80
Time (s)
20
0
10
20
30
40
Time (s)
Fig. 6. The power and CPU usage of the Nokia N95 phone when running SensOrchestra phone sensing software. The operations performed on the phone are labeled as follows: (a) Bluetooth scanning; (b) Microphone/Camera sensing; (c) Sensor data transmission (audio only); (d) Location recognition result reception; (e) One shot of the camera; (f) Sensor data transmission (audio and image).
still misclassify one as the other sometimes because of the high similarity of these two kinds of store. Another example is that the electronics store (Sony Style) is frequently misclassified as the home decoration store (Brookstone). A possible reason is that Brookstone actually has a section selling home appliances and electronics, probably resulting in images and sound signatures similar to Sony Style. 6.4 Energy and CPU Measurements In addition to store classification performance, we now evaluate the energy consumption and CPU usage of SensOrchestra when running on the Nokia N95 phone. The measurements are collected using the Nokia Energy Profiler toolkit [14], with a sampling rate of 4 measurements per second. Figure 6 shows the power and CPU usage during one sensing interval. Two configurations are tested for comparison: 1) Both microphone and camera are turned on to sense and transmit audiovisual data; 2) Only the microphone is turned on and the audio is transmitted. When the program starts, it takes 10 seconds on average to perform the Bluetooth scan for proximity detection, with power consumption of 0.5 W on average. Although slightly increasing the need
SensOrchestra: Collaborative Sensing for Symbolic Location Recognition
13
of power and CPU, Bluetooth scan is essential for ad-hoc group formation for collaborative sensing. Then, the phone starts to capture audio and image for 30 seconds. If using only microphone to record audio, the energy consumption rate is 0.3 W. While audiovisual data provide more information for context inference, camera shots consume more than 0.9 W, which is three times as much as the power consumed by audio recording. Also, audio features are shown to be more robust than image features in Section 6.3. Therefore, to reduce energy consumption, a possible solution would be turning off the camera or adopting state-of-the-art duty cycle management techniques [27]. Sensor data transmission between the phone and the server is also a powerconsuming operation, which increases the CPU usage to over 80%, and drains 1.2 W in average. One solution is moving the feature extraction part to the phone to save bandwidth in data transmission, with a tradeoff of increasing the computational burden on the phone.
7 Discussion 7.1 Transmission Bandwidth We first discuss the bandwidth required for data transmission. For the current implementation, a 30-second WAV file is 472 kB, and a JPEG image is about 60 kB each on average. Each Bluetooth address in the discovered address list is only 48 bit, so the additional overhead is negligible. Therefore, the total amount needed for transfer is approximately 472 kB + 4 × 60 kB = 712 kB, which takes about 10 seconds in average to upload with Wi-Fi or 3G connection. If only audio data are used, the data size for transmission can be reduced by 33%. 7.2 Response Time Response time is also an important factor for a location recognition system, since context-based advertisement or coupons may need to be delivered to the user in a timely fashion. We define response time as the interval from the time that sensor data are collected, to the time that location recognition result is received. As shown in Figure 6, after the sensor data are collected, the system response time is about 10 to 15 seconds (operation (c) and (d)), depending on the network connection and the transmitted data size. Considering the whole sensing and inference interval, the system can update the user’s location once every minute. While this can be improved by reducing the sensing period, we believe it is timely enough for symbolic location recognition since most customers are unlikely to switch from store to store every minute. Extracting features locally on the phone can further improve the response time by reducing the data size for transmission. 7.3 Applications to Mobile Advertising We now discuss the potential of applying the system to context-based advertising. On the user’s side, SensOrchestra is a realistic solution since most of the
14
Heng-Tze Cheng et al.
time there is more than one person shopping in a store and carrying his/her mobile phone. A user can simply opt out if there is any privacy concern. On the advertisement provider’s side, SensOrchestra is low-cost and scalable enough to be deployed to a wide variety of stores since it requires only a reasonable amount of audio/image samples (less than 70 sensing sessions for each store in our experiments) provided by each store for training, without the need for additional infrastructure. Furthermore, our multi-phone sensing framework enables the opportunity of mobile group advertising. Since customers in proximity are grouped together, the advertisement provider can send group-targeted coupons (e.g., Three users in the same store may receive a ”buy-two-get-one-free” coupon for them even if they do not know each other). Leveraging the strength of such social connections or incorporating other context information can be interesting directions for mobile context-based advertising.
8 Conclusion and Future Work In this paper, we have presented the design and evaluation of SensOrchestra, a collaborative sensing framework for symbolic location recognition that leverages multiple nearby mobile phones. We showed that using only a single phone is not robust enough to overcome muffling and ambient noise. Experimental results validate our hypothesis that recognition accuracy improves as more phones collaborate. Using the proposed classifier fusion approach to combine correlated estimates from different phones, we are able to achieve 87.7% accuracy with only audio features and without any assumption on how users carry their phones during the sensing process. Our ongoing work is to balance the tradeoff between energy consumption, transmission bandwidth, and accuracy. Improving the reliability of proximity detection is another important issue. We are also applying the collaborative sensing framework to group activity recognition, which provides richer information for context-based mobile advertising.
9 Acknowledgments This research is supported by a grant from Nokia Research Center and by the CyLab Mobility Research Center at Carnegie Mellon under grant DAAD19-02-10389 from Army Research Office. The views and conclusions contained here are those of the authors and should not be interpreted as necessarily representing the official policies or endorsements, either express or implied, of Army Research Office, Carnegie Mellon University, or the U.S. Government or any of its agencies. We appreciate the advice of Asim Smailagic, Pei Zhang, Ying Zhang, and Patricia Collins.
SensOrchestra: Collaborative Sensing for Symbolic Location Recognition
15
References 1. M. Azizyan, I. Constandache, and R. Roy Choudhury. SurroundSense: mobile phone localization via ambience fingerprinting. In Proceedings of the 15th annual international conference on Mobile computing and networking, pages 261–272. ACM, 2009. 2. P. Bahl and V. N. Padmanabhan. RADAR: an in-building RF-based user location and tracking system. In INFOCOM 2000. Nineteenth Annual Joint Conference of the IEEE Computer and Communications Societies. Proceedings. IEEE, volume 2, pages 775–784, 2000. 3. X. Bao and R. R. Choudhury. VUPoints: Collaborative Sensing and Video Recording through Mobile Phones. In Proceedings of The First ACM SIGCOMM Workshop on Networking, Systems, and Applications on Mobile Handhelds, pages 7–12, 2009. 4. C. M. Bishop. Pattern Recognition and Machine Learning (Information Science and Statistics). Springer-Verlag New York, Inc., Secaucus, NJ, USA, 2006. 5. A. Bosch, A. Zisserman, and X. Munoz. Scene classification using a hybrid generative/discriminative approach. IEEE Transactions on Pattern Analysis and Machine Intelligence, 30:712–727, 2008. 6. C. J. Burges. A tutorial on support vector machines for pattern recognition. Data Mining and Knowledge Discovery, 2:121–167, 1998. 7. J. Burke, D. Estrin, M. Hansen, A. Parker, N. Ramanathan, S. Reddy, and M. B. Srivastava. Participatory sensing. In Workshop on World-Sensor-Web (WSW06): Mobile Device Centric Sensor Networks and Applications, pages 117–134, 2006. 8. C.-C. Chang and C.-J. Lin. LIBSVM: a library for support vector machines, 2001. Software available at http://www.csie.ntu.edu.tw/~cjlin/libsvm. 9. S. Chu, S. Narayanan, and C.-C. J. Kuo. Environmental sound recognition with time-frequency audio features. IEEE Transactions on Audio, Speech and Language Processing, 17(6):1142–1158, 2009. 10. Y. Deng, B. S. Manjunath, C. Kenney, M. S. Moore, S. Member, and H. Shin. An efficient color representation for image retrieval. IEEE Transactions on Image Processing, 10:140–147, 2001. 11. A. Eronen, V. Peltonen, J. Tuomi, A. Klapuri, S. Fagerlund, T. Sorsa, G. Lorho, and J. Huopaniemi. Audio-based context recognition. Audio, Speech, and Language Processing, IEEE Transactions on, 14(1):321 – 329, Jan. 2006. 12. Z. Fang, Z. Guoliang, and S. Zhanjiang. Comparison of different implementations of MFCC. Journal of Computer Science and Technology, 16(6):582–589, 2001. 13. T. Kanungo, D. M. Mount, N. S. Netanyahu, C. D. Piatko, R. Silverman, and A. Y. Wu. An efficient k-means clustering algorithm: Analysis and implementation. IEEE Transactions on Pattern Analysis and Machine Intelligence, 24:881–892, 2002. 14. M. Kuulusa and G. Bosch. Nokia Energy Profiler Version 1.2, 2009. Software available at http://www.forum.nokia.com/Library/Tools_and_downloads/ Other/Nokia_Energy_Profiler/. 15. H. Lin, Y. Zhang, M. Griss, and I. Landa. Wasp: An enhanced indoor locationing algorithm for a congested wi-fi environment. In R. Fuller and X. D. Koutsoukos, editors, The 2nd International Workshop on Mobile Entity Localization and Tracking in GPS-less Environnments, pages 183–196, 2009. 16. H. Liu, H. Darabi, P. Banerjee, and J. Liu. Survey of wireless indoor positioning techniques and systems. IEEE Transactions on Systems, Man and Cybernetics, Part C (Applications and Reviews), 37(6):1067–1080, November 2007.
16
Heng-Tze Cheng et al.
17. H. Lu, W. Pan, N. Lane, T. Choudhury, and A. Campbell. SoundSense: scalable sound sensing for people-centric applications on mobile phones. In Proceedings of the 7th international conference on Mobile systems, applications, and services, pages 165–178. ACM New York, NY, USA, 2009. 18. E. Miluzzo, N. D. Lane, K. Fodor, R. Peterson, H. Lu, M. Musolesi, S. B. Eisenman, X. Zheng, and A. T. Campbell. Sensing meets mobile social networks: the design, implementation and evaluation of the cenceme application. In SenSys ’08: Proceedings of the 6th ACM conference on Embedded network sensor systems, pages 337–350. ACM, 2008. 19. M. Mun, P. Boda, S. Reddy, K. Shilton, N. Yau, J. Burke, D. Estrin, M. Hansen, E. Howard, and R. West. PEIR, the personal environmental impact report, as a platform for participatory sensing systems research. Proceedings of the 7th international conference on Mobile systems, applications, and services, pages 55–68, 2009. 20. C. Narayanaswami, D. Coffman, M. C. Lee, Y. S. Moon, J. H. Han, H. K. Jang, S. McFaddin, Y. S. Paik, J. H. Kim, J. K. Lee, J. W. Park, and D. Soroker. Pervasive symbiotic advertising. In HotMobile ’08: Proceedings of the 9th workshop on Mobile computing systems and applications, pages 80–85. ACM, 2008. 21. K. Partridge, B. Begole, P. Alto, and C. H. Road. Activity-based Advertising: Techniques and Challenges. In Proceedings of the 1st Workshop on Pervasive Advertising, pages 2–5, 2009. 22. M. Paxton and S. Benford. Experiences of participatory sensing in the wild. In Ubicomp ’09: Proceedings of the 11th international conference on Ubiquitous computing, pages 265–274. ACM, 2009. 23. N. B. Priyantha, A. Chakraborty, and H. Balakrishnan. The cricket locationsupport system. In Proceedings of ACM International Conference on Mobile Computing and Networking, pages 32–43, 2000. 24. K. Rimey. Personal Distributed Information Store (PDIS) Project, 2004. Software available at http://pdis.hiit.fi/pdis/download/. 25. M. Sala, K. Partridge, L. Jacobson, and J. Begole. An exploration into activityinformed physical advertising using pest. In Pervasive Computing, pages 73–90. Springer, 2007. 26. J. Scheible and V. Tuulos. Mobile Python: Rapid prototyping of applications on the mobile platform. Wiley Publishing, 2007. 27. Y. Wang, J. Lin, M. Annavaram, Q. A. Jacobson, J. Hong, B. Krishnamachari, and N. Sadeh. A framework of energy efficient mobile sensing for automatic user state recognition. In MobiSys ’09: Proceedings of the 7th international conference on Mobile systems, applications, and services, pages 179–192. ACM, 2009.