MAP + RatSLAM: Appearance-based SLAM for Multiple Times of. Day," presented at International Conference on Robotics and.
SeqSLAM: Visual Route-Based Navigation for Sunny Summer Days and Stormy Winter Nights Michael J. Milford, Member, IEEE, Gordon. F. Wyeth, Member, IEEE
Abstract— Learning and then recognizing a route, whether travelled during the day or at night, in clear or inclement weather, and in summer or winter is a challenging task for state of the art algorithms in computer vision and robotics. In this paper, we present a new approach to visual navigation under changing conditions dubbed SeqSLAM. Instead of calculating the single location most likely given a current image, our approach calculates the best candidate matching location within every local navigation sequence. Localization is then achieved by recognizing coherent sequences of these “local best matches”. This approach removes the need for global matching performance by the vision front-end – instead it must only pick the best match within any short sequence of images. The approach is applicable over environment changes that render traditional feature-based techniques ineffective. Using two car-mounted camera datasets we demonstrate the effectiveness of the algorithm and compare it to one of the most successful feature-based SLAM algorithms, FAB-MAP. The perceptual change in the datasets is extreme; repeated traverses through environments during the day and then in the middle of the night, at times separated by months or years and in opposite seasons, and in clear weather and extremely heavy rain. While the feature-based method fails, the sequence-based algorithm is able to match trajectory segments at 100% precision with recall rates of up to 60%.
V
I. INTRODUCTION
isual recognition of places and place sequences in the field of robotic navigation has advanced rapidly in recent years, with several techniques [1-5] now being competitive with laser range-based techniques. Vision has been successfully used as the primary sensory modality for learning and recognizing places along journeys of up to 1000 km [1]. The primary goal of much of this research has been to map the largest possible environments with the best possible accuracy. The problem of visual place recognition across time has received far less attention, with relatively few attempts to address the problem [6, 7], including high dynamic range approaches [8]. Even this research has only addressed relatively minor issues of perceptual change caused by sun movement during the day, or relatively constrained changes inside an office building environment. Many place recognition techniques rely on feature-finding algorithms such as SIFT [9] and SURF [10] which, despite their impressive rotation and scale invariant properties, are inherently unsuitable when dealing with extreme perceptual M.J. Milford and G.F. Wyeth are with the School of Electrical Engineering and Computer Science at the Queensland University of Technology, Brisbane, Australia,
[email protected]. This work was supported by an Australian Research Council Fellowship DE120100995 to MM.
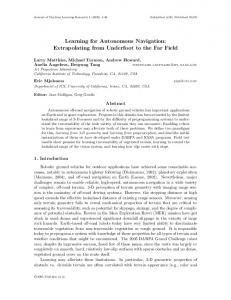
change [11], such as occurs when moving from daytime to nighttime, season to season, or from clear weather to rain. Fig. 1 illustrates the challenge of matching locations visually across time and the problems that a feature-based matching technique faces. The images A and A’ look very different but represent the same place, whereas images A and B look very similar, on both a feature and whole image basis, but correspond to different places. The SeqSLAM approach presented here matches A and A’ but not A and B. In this paper, we present a set of algorithms for visual recognition of sequences of places that are robust to extreme perceptual change. Instead of calculating the single location most likely given a current image, our approach calculates the best candidate matching location within every local navigation sequence. Localization is then achieved by recognizing coherent sequences of these “local best matches”. We demonstrate the algorithm using multi-season in-car videos of 44 km of driving around the Nurburgring racing circuit in Germany and 16 km of day and night journeys around a suburb of Brisbane. We also compare the performance with the state of the art feature-based system FAB-MAP 1.0. Despite extreme perceptual changes due to shifts in season, the weather and transitions from day to night, the algorithms are able to recognize places with performance as high as 60% recall at 100% precision, where the feature-based method fails. To the best of our knowledge, this is the first time vision-based localization has been demonstrated across extreme environmental change as illustrated in Fig. 1. The paper proceeds as follows. Section 2 provides a brief background on attempts to improve the robustness of visionbased localization and navigation techniques to perceptual change. In Section 3 we describe the key SeqSLAM algorithms. Section 4 presents the experimental methodology and datasets. In Section 5 we present several sets of results including sample image matches, precisionrecall curves and ground truth plots. The paper concludes in Section 6 with a discussion of the results and future work. II. BACKGROUND Much of the work in visual place recognition has occurred under the banner of Simultaneous Localization And Mapping (SLAM) research [12], which focuses on enabling robots to create maps of the environment, while simultaneously using those maps to work out where they are (localize). Vision has been successfully used as the primary sensory modality for learning and recognizing places along
Fig. 1 – The problem of perceptual change. Place A and B are different places, yet appear much more similar than Place A does to itself during a rainy night (A'), both on a whole image and individual feature basis. Our approach uses local matching within sequences to successfully match A to A’, but not A to B.
journeys of up to 1000 km [1]. Environment size and accuracy have been the dominant benchmarks thus far. There have been attempts to increase the robustness of visual techniques to environment change by performing sensor fusion with lasers at the level of landmarks [13] or dense depth maps [14]. However, these approaches require sensor-sensor calibration to ensure features are represented in a common reference frame, and are unsuitable in unstructured environments or changing conditions where geometry or features are not reliable cues. Improved sensing hardware and high dynamic range techniques [8] can go some way towards addressing illumination change, but there are limitations to what can be achieved with cheap sensors and on rapidly moving platforms. One promising step [15] towards reducing the reliance on consistent feature detection uses the self-similarity of objects within a frame or video sequence to robustly recognize objects under varying conditions. However, even this approach fails when the environmental change is so great that objects exhibit no consistent self-similarity, as in the transition from day to night in which an off street light becomes a bright flare, or a textured tree becomes a dark uniform blob. The approach taken in this work is partly inspired by the author’s previous work in vision-based mapping in RatSLAM [16-18]. RatSLAM has been demonstrated visually mapping a suburban road network [17] and in a long term delivery robot experiment [18]. The significance of the RatSLAM results is that by localizing over sequences, rather than individual places, the requirement for perfect data association or feature detection is removed. Indeed, significant experimental results were achieved using only low resolution visual sensory input (typically around 1000 pixels [19]) and lightweight pre-processing techniques such as image intensity profiles, without performing traditional feature extraction [17]. However, despite its successes, RatSLAM lacks versatility like other current visual navigation systems. A road network mapped during the day is not recognized by the system at night. Outside of RatSLAM, the use of sequences, albeit with a feature-based method, was proposed in [20]. In that approach, 128D vectors of SIFT descriptors were used to
perform loop closure, combined with additional algorithms to address visual ambiguity caused by repetitive foliage or architecture features. Our approach also uses sequences but forgoes the use of features, instead using a whole of image, local best match approach, as described in the next section. III. SEQSLAM In this section we describe SeqSLAM, which has local best match and sequence recognition components. The choice of frame comparison method is flexible – in Section IV we describe the method used for this work. A. Local Best Match
Fig. 2: Contrast enhancement of the original image difference vectors increases the number of strongly matching templates. Darker shading = smaller image difference = stronger match.
The first key innovation is to frame the image recognition problem not as one of finding the single template that best matches the current image (global best match), but rather as one of finding all the templates within local neighborhoods that are the best match for the current image (local best match). Towards this aim, we apply a local contrast enhancement (analogous to a 1D version of patch normalization) process to each element i in the image difference vector D to produce a contrast enhanced image ˆ: difference vector D
D Dl Dˆ i i
l
(1)
where D l is the local mean and σl is the local standard deviation, in a range of Rwindow templates around template i. Fig. 2 shows a schematic of the local contrast enhancement ˆ vectors calculated at process operating on a number of D different times. B. Localized Sequence Recognition Localized image template matching produces a number of candidate template matches at each time step. To recognize familiar place sequences, a search is performed through the space M of recent image difference vectors: T d ˆ ˆ T d 1 D ˆT (2) M D ,D where ds determines how far back in time the search goes, and T is the current time. We make the assumption that velocities (in terms of templates learned per second) on repeated traverses of a path are approximately repeatable (within 40% for these experiments). The search projects a number of trajectories representing different possible ˆ T d . Fig. 3 velocities, starting from each element in D shows trajectory lines for various speeds originating from a single template – for clarity reasons searches originating from the other templates are not shown. A difference score S is calculated for each trajectory line based on the difference values the line passes through in travelling from time T-ds to the current time T: s
s
s
T
S
After all the trajectory scores have been evaluated, the minimum scoring (i.e. best matching) trajectory for each template is placed in vector S. If the minimum scoring trajectory within a sliding window of range Rwindow is a factor of µ smaller than any of the trajectory scores outside the window, that trajectory is deemed to be a match (Fig. 4).
Dkt
(3)
t T d s
where k is the particular difference value the trajectory passes through at time t: k s V d s T t (4) where s is the template number the trajectory originated in, and V is the trajectory velocity which is varied between Vmin and Vmax in steps of Vstep. Trajectory searches are performed from every template except for recently learned templates within Rrecent of the current template, in order to avoid matching the current trajectory.
Fig. 3: Searching for coherent matching sequences within the space of recent image difference vectors.
Fig. 4: A trajectory within the sliding window is deemed a match if its difference score is significantly lower than the lowest difference score outside the sliding window.
IV. EXPERIMENTAL SETUP In this section we describe the datasets used, ground truth measures, image pre-processing and parameter values. A. Datasets Two datasets were obtained, each dataset comprising two “runs” along the same route in an environment. All videos are available at https://wiki.qut.edu.au/display/cyphy/ Michael+Milford+Datasets+and+Downloads. Both datasets involved varying traffic, stoppages and additional perceptual changes due to infrastructure changes and the movement of parked cars. The first dataset comprised two in-car camera videos from a lap of the famous 22 km Nurburgring racing circuit in Germany (Fig. 6a). The videos were unrelated and consisted of footage taken onboard two different cars (referred to from here as the “Evo” and “Vectra” datasets) racing the circuit at different times of year, using different cameras. The raw videos were downloaded and converted to a standard .avi container format with Xvid encoding at a frame rate of 30 frames per second. A single rectangular crop was performed on each video to achieve an approximately corresponding field of view (see Fig. 7), and resized to 640×480 pixels. No undistortion was performed, as is evident in Fig. 7a. The second dataset comprised two 8 km journeys through the suburb of Alderley in Brisbane, Australia (Fig. 6b). The first run was gathered in the middle of the night during a severe storm with very heavy rain and low visibility. The second run was gathered during a bright clear morning. A Panasonic Lumix DMC-TZ7 digital snapshot camera was used, recording 720p video at a frame rate of 50 frames per second. The video was cropped and resized to 640×256 pixels, as shown in Fig. 7. Each pair of runs from the same environment was concatenated to form one video representing two sequential passes along the same route. To increase the length of the route and add the challenge of avoiding false positive trajectory matches outside of the core two runs, we also added a number of additional datasets from similar in-car
footage. The additional datasets consisted of footage gathered from driving around another Brisbane suburb and another area of the Alderley suburb. These additional datasets were cropped to produce approximately corresponding fields of view, and then added to the beginning of the combined videos. The addition of the extra datasets approximately doubled the path length the algorithms had to process for both environments and created the test datasets shown in Fig. 5.
reduced, patch-normalized images (see Section C). Differences, D, between the current image at time t and each learnt image template i were calculated using a normalized sum of pixel intensity differences: Di
1 Rx R y
Rx
Ry
p x 0 y 0
i x, y
p x, y
(5)
where Rx and Ry are the dimensions of the resolution reduced image, and p are the pixel intensity values. At each time t, the current image frame was compared to every learned template to produce a vector of image differences Dt, which can be seen in the left side of Fig. 2. Note that Dt consists of image differences, the lower (more negative) the value, the better the match.
Fig. 5: Composition of the final test (a) Nurburgring and (b) Alderley datasets.
B. Ground Truth Two of the datasets were sourced from online videos, and GPS was not reliable enough to be gathered during acquisition of the Alderley dataset. Consequently, to obtain ground truth, all videos were manually parsed frame by frame and key frames had their latitude and longitude tagged using a combination of Google Maps, Google Street View, and NearMaps. Points were selected based on video frames that showed prominent, unambiguous features and transition points (such as the car stopping and starting at traffic lights). 236 locations were tagged over the two datasets in the Nurburgring, while 182 locations were tagged in the two Alderley datasets. These locations were then placed on a Bezier curve overlaying the exact path of the camera, and intermediate frame locations were calculated using linear interpolation between tagged locations along the Bezier curve. C. Image Pre-Processing and Comparison The cropped full resolution images were first converted to grayscale, then down sampled to a total resolution of 2048 (Alderley) and 1024 (Nurburgring) pixels, using the pixel area resampling technique provided in OpenCV to avoid Moire interference patterns. The approximate aspect ratio of the original video frames was maintained. After down sampling, the image was divided into smaller square regions with side length P, which were then patch normalized, as shown in Fig. 7e. D. Frame Comparison Method As stated in Section III, the choice of image comparison method is flexible as long as it is capable of generally picking the best image match from short image sequences. For this set of experiments, we used a Sum of Absolute Differences (SAD) matcher operating on the resolution
Fig. 6: Aerial photos and camera paths for the (a) Nurburgring and (b) Alderley datasets. Source: Google Maps and NearMaps.
E. Template Learning New visual templates were learned at a fixed rate of Vav templates per frame processed. For the experiments described in this paper, we found a value of Vav = 0.5 gave good results – the only tradeoff being compute speed. Due to significant image redundancy, we only processed one in every four original video frames, so a template was learned every 8 original video frames. To reduce the number of templates learned when the camera is stationary, frames were only processed when the camera was moving significantly. Stationary camera periods were detected by applying the frame comparison algorithm to the current frame and a frame from flag frames previously. F. OpenFABMAP We applied the open source version of FAB-MAP openFABMAP (available at http://code.google.com /p/openfabmap/) to the datasets. For the Nurburgring test, we used a training dataset consisting of similar car-based footage. For the Alderley test, we used a training dataset consisting of both day and night car footage taken from similar suburban locations in the same general area. We sub sampled the Nurburgring test dataset by a factor 20 and the Alderley test dataset by a factor of 30 to improve FAB-MAP performance. Beyond frame sub sampling, changing other parameters did not appear to help performance in any significant way, so the default openFABMAP parameters were used. It should be noted that, on top of the great change in feature appearance in these datasets, the low quality and
relatively low effective resolution of the videos is not the type of data FAB-MAP was primarily designed to deal with. We include comparison for the purposes of rigor and to demonstrate the challenges a state of the art feature-based visual mapping technique faces when environments change. G. Parameters Table I provides the values of the critical parameters used in these experiments. Most of the parameters were common to the two dataset environments and have been used successfully in a number of other environments as well. TABLE I PARAMETER LIST Parameter
Value
Description
Rx, Ry
64, 32 32, 24
Reduced image size, Alderley dataset Reduced image size, Nurburgring dataset Stationary detector frame interval Local template neighborhood range Recent template range Trajectory length in number of frames
Rx, Ry flag Rwindow Rrecent ds Vav Vmin Vmax Vstep P µ
30 frames 10 templates 20 templates 320 frames 0.5 templates / frame 0.6Vav 1.48Vav 0.04Vav 8 pixels Varied
experiments, computation was performed at real-time speed or faster on a standard Intel Core i5 PC. A. Sample Image Sequence Matches To visualize matched trajectories, we extracted the matched frames at five points equally distributed along the ds frames of a matched trajectory. For human interpretation purposes, we show the original images, rather than the resolution reduced patch normalized images that SeqSLAM actually used. The attached video shows the full range of matched trajectories for both environments. Fig. 8 shows corresponding frames from matched trajectories in the Nurburgring dataset. The sequence was matched despite different weather and seasons, as shown by the color differences and loss of leaves on the trees. Furthermore, there is some invariance to differences in the racing line taken, as shown by the top pair of images.
Average templates learned per frame Minimum trajectory speed Maximum trajectory speed Trajectory speed step-size Patch normalization patch side length Trajectory uniqueness parameter
Fig. 8: Corresponding frames from a matched sequence in the Nurburgring dataset.
Fig. 9 shows the corresponding frames from a matching sequence in the day and night Alderley datasets. As can be seen from the frames, there are virtually no features that are recognizable both during the day and at night. The only possible ways to match individual frames for a human is to use semantic information (for example the “yellow” street sign in the last row).
Fig. 7: Video gathering and pre-processing for the Nurburgring dataset for the (a) Evo and (b) Vectra video, and for the (c-d) Alderley dataset. Note the distortion in the Nurburgring video (a). (e) Patch normalization over a fixed patch grid of the down sampled images produces a contrast enhanced image. (f) The lack of information in parts of the Alderley dataset is revealed by a histogram equalized frame (e).
V. RESULTS In this section we present results showing sample trajectory matches, precision-recall curves, and ground truth classification plots. The accompanying video shows SeqSLAM operating on both datasets presented here. The current implementation has no optimization built in, so compute scales linearly with the length of the dataset. For all
Fig. 9: Corresponding frames from an Alderley sequence match.
B. Precision-Recall Curves Precision-recall curves were generated by varying the trajectory uniqueness parameter µ. For every learned trajectory sequence that was matched to the current trajectory sequence, the ground truth location corresponding to the midpoint of the recognized sequence was compared to the ground truth location of the current trajectory midpoint. Metric errors of more than 40 meters were designated as false positives for both datasets. It should be noted that it was impossible for the sequence-based method to achieve 100% recall, as the first and last ds / 2 frames in the video were not part of complete sequences (this is why the precision recall curves stop at 95% and 88% recall). FABMAP precision recall curves were generated by varying the threshold at which a location probability reported by openFABMAP was considered a match.
should be noted that there is no repetition within either the day or nighttime segments, so there were no “easy” matching opportunities, perhaps explaining the very low precision achieved even at low recall rates. C. Ground Truth Plots Figs 12 and 13 show the ground truth plots for the Nurburgring and Alderley datasets at a precision level of 100% for SeqSLAM, and at the optimal recall-precision point for openFABMAP. Some of the SeqSLAM false negatives are probably caused by the lack of a motion model and the assumption of constant speed over trajectory segments. OpenFABMAP produces few true positives and a large number of false positives.
Fig. 10: Precision-recall curves for Nurburgring dataset comparing performance to openFABMAP.
Fig. 12: Ground truth plots for the Nurburgring dataset using (a) openFABMAP and (b) SeqSLAM. The large black circle and medium red cross markers are true (TP) and false positives (FP), respectively, and the small blue dots are false negatives (FN). Grey lines connect false positives to the erroneous location match, but only for false positive matches to locations within this part of the dataset. Fig. 11: Precision-recall curves for Alderley dataset comparing performance to openFABMAP.
Fig. 10 shows the precision-recall curve for the Nurburgring dataset. A precision level of 100% is achieved up to a recall rate of 60%, after which precision drops steadily to 87% at a recall rate of 95% (solid line). OpenFABMAP performs poorly, matching at no better than 11% precision up to a maximum recall rate of 100%. For the more challenging Alderley clear day-rainy night dataset, SeqSLAM achieved a recall rate of 33% at 100% precision (solid line). Precision remained high at 98% up to 45% recall, after which precision dropped steadily to 65% precision at 88% recall. The feature-based method struggled to recall any but a few frames correctly at any recall level. It
Fig. 13: Ground truth plots for the Alderley dataset using (a) openFABMAP and (b) SeqSLAM. Markers as in Fig. 12
VI. DISCUSSION AND FUTURE WORK In this section, we discuss the insights gained, limiting assumptions, and future work. First and foremost, the results demonstrate that, given certain assumptions, it is possible to visually learn and recall route-based journeys through environments that have undergone drastic perceptual change due to day changing to night, weather, and seasonal change. Rather than attempting to find visual features that are invariant across such extreme changes (a challenge with no immediate prospects of being addressed), we instead rely on recognizing local best match sequences. Specifically, we have shown that the challenging route recognition problem can be reduced to two much simpler problems, that of finding the best place match within local image sequences rather than globally, and finding coherent sequences of these local place matches. To make this work practicable, we have made a number of assumptions. We have assumed that the speed of the camera is similar on repeated journeys through each part of a route. We allowed for a variation of about 40% in speed in these results. In combination with a simple “no-motion” detector, this speed range appeared sufficient for this range of datasets. The Alderley dataset in particular was gathered during a normal day and night with traffic and traffic light stoppages that varied significantly between the two runs. We have also successfully applied the algorithms to video footage from downhill mountain biking, stunt course airplane flying, handheld camera and computer game screen footage datasets. Future work will investigate the addition of a locally repeatable visual odometry system. To enable matching with significantly different velocities, the system requires an odometry system that generates speed measures that are consistent in any particular part of the environment (regardless of conditions), but which do not have to be globally consistent. This requirement is orthogonal to the more typical demands of globally accurate odometry, and avoids some of the associated difficulties, especially under changing environmental conditions. We will investigate the use of Dynamic Time Warping Techniques (DTW) to achieve this aim. The algorithms appeared to work best when no image offset tolerance was used in the frame comparison method. We speculate this is because comparing images over a range of offsets would undermine the effectiveness of the local matching process, by reducing the difference in image comparison scores for templates learned at similar times. This insight ties in with the other major assumption – that the path travelled on repeated journeys was similar in Cartesian space. Future work will look at ways to introduce geometric invariance without reducing the effectiveness of the algorithms. For example, it may be possible to compare large pixel patches in much the same way that patch-based constellation methods work. We will also study the effect of parameters such as sequence length. With a more sophisticated odometry model, it will be easier to efficiently
search non-linear trajectories, enabling more effective use of longer sequences. ACKNOWLEDGMENT We thank Arren Glover for his help in implementing openFABMAP. REFERENCES [1] M. Cummins and P. Newman, "Highly scalable appearance-only SLAM - FAB-MAP 2.0," presented at Robotics: Science and Systems, Seattle, United States, 2009. [2] A. J. Davison, I. D. Reid, N. D. Molton, and O. Stasse, "MonoSLAM: Real-Time Single Camera SLAM," IEEE Transactions on Pattern Analysis and Machine Intelligence, vol. 29, pp. 1052-1067, 2007. [3] H. Andreasson, T. Duckett, and A. Lilienthal, "A Minimalistic Approach to Appearance-Based Visual SLAM," IEEE Transactions on Robotics, vol. 24, pp. 1-11, 2008. [4] L. M. Paz, P. Pinies, J. D. Tardos, and J. Neira, "Large-Scale 6-DOF SLAM With Stereo-in-Hand," IEEE Transactions on Robotics, vol. 24, pp. 946-957, 2008. [5] K. Konolige and M. Agrawal, "FrameSLAM: From Bundle Adjustment to Real-Time Visual Mapping," IEEE Transactions on Robotics, vol. 24, pp. 1066-1077, 2008. [6] A. J. Glover, W. P. Maddern, M. J. Milford, and G. F. Wyeth, "FABMAP + RatSLAM: Appearance-based SLAM for Multiple Times of Day," presented at International Conference on Robotics and Automation, Anchorage, United States, 2010. [7] P. Biber and T. Duckett, "Dynamic Maps for Long-Term Operation of Mobile Service Robots," presented at Robotics: Science and Systems, Cambridge, United States, 2005. [8] I. Kiyoshi, Y. Tomoaki, and T. Masahiro, "A High Dynamic Range Vision Approach to Outdoor Localization," presented at International Conference on Robotics and Automation, Shanghai, China, 2011. [9] D. G. Lowe, "Object recognition from local scale-invariant features," presented at International Conference on Computer Vision, Kerkyra, Greence, 1999. [10] H. Bay, T. Tuytelaars, and L. Van Gool, "SURF: Speeded Up Robust Features," in Computer Vision – ECCV 2006, 2006, pp. 404-417. [11] S. Nuske, J. Robert, and G. Wyeth, "Robust outdoor visual localization using a three-dimensional-edge map," Journal of Field Robotics, vol. 26, pp. 728-756, 2009. [12] G. Dissanayake, P. M. Newman, S. Clark, H. Durrant-Whyte, and M. Csorba, "A solution to the simultaneous localisation and map building (SLAM) problem," IEEE Transactions on Robotics and Automation, vol. 17, pp. 229-241, 2001. [13] J. A. Castellanos, J. Neira, and J. D. Tardós, "Multisensor fusion for simultaneous localization and map building," IEEE Transactions on Robotics and Automation, vol. 17, pp. 908-914, 2002. [14] J. S. Gutmann and K. Konolige, "Incremental mapping of large cyclic environments," presented at Conference on Intelligent Robots and Applications, 1999. [15] E. Shechtman and M. Irani, "Matching local self-similarities across images and videos," presented at IEEE Conference on Computer Vision, Minneapolis, United States, 2007. [16] M. J. Milford, G. Wyeth, and D. Prasser, "RatSLAM: A Hippocampal Model for Simultaneous Localization and Mapping," presented at IEEE International Conference on Robotics and Automation, New Orleans, USA, 2004. [17] M. Milford and G. Wyeth, "Mapping a Suburb with a Single Camera using a Biologically Inspired SLAM System," IEEE Transactions on Robotics, vol. 24, pp. 1038-1053, 2008. [18] M. Milford and G. Wyeth, "Persistent Navigation and Mapping using a Biologically Inspired SLAM System," International Journal of Robotics Research, vol. 29, pp. 1131-1153, 2010. [19] M. Milford, F. Schill, P. Corke, R. Mahony, and G. Wyeth, "Aerial SLAM with a Single Camera Using Visual Expectation," presented at International Conference on Robotics and Automation, Shanghai, China, 2011. [20] P. Newman, D. Cole, and K. Ho, "Outdoor SLAM using Visual Appearance and Laser Ranging," presented at International Conference on Robotics and Automation, Florida, United States, 2006.