Nov 1, 2015 - [10] Y. Kishimoto and K. Oguri. A modeling method for ... [16] Shun Taguchi, Shogo Sekizawa, Shinkichi Inagaki, and Tatsuya Suzuki. Stochas-.
Sequence Prediction of Driving Behaviour Using Double Articulation Analyser Tadahiro Taniguchi, Shogo Nagasaka, Kentarou Hitomi, Naiwala P. Chandrasiri, Takashi Bando, and Kazuhito Takenaka November 1, 2015 Abstract A sequence prediction method for driving behaviour data is proposed in this paper. The proposed method can predict a longer latent state sequence of driving behaviour data than conventional sequence prediction methods. The proposed method is derived by focusing on the double articulation structure latently embedded in driving behaviour data. The double articulation structure is a two-layer hierarchical structure originally found in spoken language, i.e. a sentence is a sequence of words and a word is a sequence of letters. Analogously, we assume that driving behaviour data comprise a sequence of driving words and a driving word is a sequence of driving letters. The sequence prediction method is obtained by extending a nonparametric Bayesian unsupervised morphological analyzer using a nested Pitman-Yor language model (NPYLM), which was originally proposed in the natural language processing field. This extension allows the proposed method to analyse incomplete sequences of latent states of driving behaviour and to predict subsequent latent states on the basis of a maximum a posteriori (MAP) criterion. The extension requires a marginalization technique over an infinite number of possible driving words. We derived such a technique on the basis of several characteristics of the NPYLM. We evaluated this proposed sequence prediction method using three types of data: synthetic data, data from test drives around a driving course at a factory and data from drives on a public thoroughfare. The results showed that the proposed method made better long-term predictions than did the previous methods.
1 INTRODUCTION Long-term prediction of a driver’s behaviour has been considered a difficult but important task in the area of developing future advanced driver assistance systems (ADASs). The accurate recognition and long-term prediction of driving behaviour time series data will allow a future intelligent vehicle to provide helpful information, e.g. better driving plans, driving maneuvers and risk evaluations, to assist the driver. If an intelligent vehicle can model the driving behaviour data and find the latent structure of the data, it will be able to predict automatically future scenarios in the long-term.
1
Will you turn right at the next intersection? The street is congested now.
Hmm..... I'll change my route.
Observed driving behaviour
Unobserved future driving behaviour
Following a leading vehicle Going straight
Parking a car
Passing a pedestrian
Going straight
Parking a car Turning left Following a leading vehicle
Following a leading vehicle
Turning right
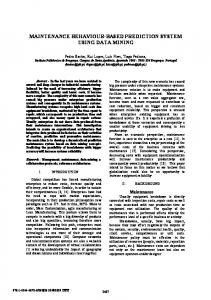
Figure 1: Hypothetical scenario of an interaction between a driver and a robotic interface that can predict a sequence of his/her future driving behaviour. Figure 1 shows a possible scenario of an interaction between a driver and a driving agent that can predict future scenarios and provide a driver with helpful information. In the figure, a driving agent asks whether the driver will turn right at the next intersection and gives the driver information that the street is congested on the basis of the prediction of the driver’s future behaviour. In this example, the driver changes his course according to the agent’s recommendation. So that the driving agent can proactively offer such information to the driver appropriately, it has to predict a future possible scenario on the basis of appropriate recognition of the current driving context and the driver’s intention. In the bottom box in Figure 1, each ellipse represents a typical driving behavior pattern, i.e. a meaningful chunk of driving behaviour, and each arrow represents a possible transition between the chunks. The broad arrows show the most probable path that is estimated or predicted by the driving agent. If a driving agent can segment observed driving behaviour data into meaningful chunks in an unsupervised manner and if it learns transition rules between the chunks, it will be able to predict the most probable future scenario and provide the driver with helpful information. The purpose of this research is to develop a fundamental unsupervised learning method that allows an intelligent vehicle to model driving behaviour data as a sequence of meaningful chunks and predict the most probable posterior latent state sequence of future driving behaviour. To achieve this, we focus on the double articulation structures embedded in driving behaviour data. Figure 2 illustrates a double articulation structure in driving behaviour time series data. Unsegmented driving behaviour can be semantically differentiated into several chunks, such as ‘start’, ‘waiting at a pedestrian crossing’ and ‘turning right’. These labels for chunks cannot be inferred through unsupervised learning. However, we attempt to segment the driving behaviour data into such chunks in an unsu2
Chunk
Start Waiting at a pedestrian crossing
Following a leading vehicle
Turning right
(Semantic unit)
Segment (Physical unit)
Images from vehicle video Driving behaviour data 12
17
22
27
32
37
42
Figure 2: Latent double articulation structure embedded in driving behaviour. The top panel explains each chunk of driving behaviour. The middle panel shows a view from an in-vehicle camera. The bottom panel shows driving behaviour time series data, e.g. steering angle, brake pressure and accelerator pedal position. pervised manner. Each chunk cannot always be represented by a physically elemental driving behaviour, but rather frequently consists of several. For example, when a driver ‘turns right’, he/she has to step on the accelerator, turn the steering wheel to the right, lift his/her foot off the accelerator pedal slightly to check the condition of the street onto which he/she turns, step on the accelerator pedal again, turn the steering wheel to the middle and adjust the steering and the acceleration to turn on to the next street. Semantically elemental behaviour often consists of several physically simple behaviour units. In our approach, we explicitly take this two-layer hierarchy, called double articulation structure, into consideration for unsupervised modelling and prediction of driving behaviour data. In this paper, we propose a sequence prediction method based on double articulation structures embedded in driving behaviour data. The proposed method is an extension of a double articulation analyzer (DAA), which consists of a sticky hierarchical Dirichlet process-hidden Markov model (HDP-HMM) and an unsupervised morphological analyzer using a nested Pitman-Yor language model (NPYLM). We describe the theoretical derivation of the sequence prediction method and evaluate the proposed method using three experiments. The main contributions are as follows. • We developed a novel sequence prediction method named NPYLM with prediction that can predict subsequent latent states of driving behaviour having a double articulation structure by extending an unsupervised morphological analyzer using the NPYLM proposed by Mochihashi [1]. • We showed that the NPYLM with prediction increases the length of latent state sequence predictions of driving behaviour data compared with conventional methods, e.g. bigram model and a sequence memoizer, through several experiments. In the experiments, we applied the proposed method and comparative methods to synthetic data, to short driving behaviour data recorded on a course at a factory and complex long driving behaviour data recorded on a public thoroughfare including urban streets, downtown areas and highways. The remainder of this paper is organized as follows. In Section 2, the background of our research is described. In Section 3, the DAA previously proposed for modelling 3
driving behaviour data [2] is explained. In Section 4, our proposed sequence prediction method named NPYLM with prediction is presented. In Section 5, we demonstrate the effectiveness of NPYLM with predictions on synthetic dataset and on two actual driving behaviour datasets. Section 6 concludes this paper.
2 BACKGROUND 2.1 Statistical approach to prediction of driving behaviour Recently, data-driven intelligent transportation systems (D2 ITS) have been gaining attention [3]. A modern vehicle is able to observe many kinds of driving behaviour data through control area network (CAN) and various other sensors. The utilization of such driving behaviour data has become an important issue in the field of intelligent vehicles. A wide range of methods modeling observed driving behaviour data has been studied, e.g. system identification methods [4, 5], statistical methods [6–17], and rule-based methods [18]. A wide range of statistical prediction methods has been developed on the basis of such modeling methods. One of the objectives of the prediction task was to lengthen the time period over which a driving assistance system can make accurate predictions. Recently, the statistical approach has been gaining attention. For example, Wiest et al. proposed using a Gaussian mixture model (GMM) to predict a vehicle’s trajectory [6]. The growing hidden Markov model (HMM) proposed by Vasquez et al. can build its model structure incrementally using a topological mapping technique. They showed the method is effective for trajectory and goal prediction [7]. Angkititrakul et al. proposed using a GMM for generating lane departure warnings [8]. For predicting directly the incoming measured variables of driving behaviour, e.g. the angle of the accelerator pedal, steering angle and brake pressure, many kinds of latent variable models have been widely used for modelling driving behaviour, e.g. hidden Markov models (HMM), Gaussian mixture models (GMM) and hybrid dynamical systems (HDS). Takano et al. applied an HMM to driving behaviour data [9]. Various HDSs, including the stochastic switched autoregressive exogenous system, the autoregressive hidden Markov model [10], the piecewise autoregressive exogenous model (PWARX) and the probability-weighted ARX model have also been applied to driving behaviour data [11–13]. HDS is a class of dynamical latent variable models that have a set of discrete states corresponding to the physical element of dynamics. Hamada et al. used the beta process autoregressive HMM (BP-AR-HMM) and hierarchical Dirichlet process autoregressive HMM (HDP-AR-HMM) models for predicting driving behaviour data [14]. However, long-term prediction has been found to be difficult. Takano et al. reported that their HMM could predict only very short-term driving behaviour [9]. Angkitirakul et al. reported that the short-term prediction performance of GMM and PWARX is almost the same [15]. These studies show that directly predicting measured variables of driving behaviour is inevitably difficult. However, the direct prediction of measured driving behaviour data is not always necessary for developing a driving support system. For example, in Figure 1, the driv-
4
ing agent predicts the driver’s behaviour as a sequence of abstract chunks of driving behaviours and gives helpful information to the driver. Dorst pointed out that abstraction of driving behaviour is important for representing a trip, and proposed a rule-based automated abstraction mechanism [19]. If a driving agent can infer and predict a sequence of latent states representing meaningful abstract chunks of driving behaviour in an unsupervised manner, as shown in Figures 1 and 2, the driving agent will be able to provide the driver with helpful information and assist his/her driving behaviour by referring to stored knowledge. Such meaningful chunks of driving behaviour which correspond to ellipses shown in Figure 1 can be extracted using a DAA in an unsupervised manner. Therefore, in this paper, we focus on an unsupervised machine learning method that models driving behaviour as a sequence of abstract meaningful chunks and predicts future scenarios of driving behaviour as a sequence of abstract states on the basis of the DAA.
2.2 Double articulation structure and prediction Many latent variable models, including HMM, GMM and HDS, have been used for modelling driving behaviour. However, they assume Markov transitions between physically elemental driving behaviours, e.g. ‘stepping on the accelerator’, ‘stepping on the brake’ and ‘turning the steering wheel to the left’. As a result, the models cannot utilize a context longer than one physically elemental behaviour. Generally, drivers’ physically simple behaviour units have more contextual dependency. A semantically meaningful behaviour unit consists of a sequence of physically simple behaviour units. For example, when a driver turns right at an intersection, he/she ‘steps on the brake’, ‘turns the steering wheel to the right’, ‘steps on the accelerator’, ‘turns the steering wheel back to centre’ and ‘steps on the accelerator’ again as a sequence of physically elemental driving behaviours. Figure 2 illustrates a double articulation structure in driving behaviour. Unsegmented driving behaviour can be semantically differentiated into several chunks, such as ‘start’, ‘waiting at a pedestrian crossing’ and ‘turning right’. Each chunk consists of a number of physically elemental driving behaviours. A problem of such an approach that considers a hierarchical structure is that obtaining a complete list of stereotypical driving behaviours, e.g, ‘start’, ‘waiting at a pedestrian crossing’ and ‘turning right’, is difficult or even impossible. A fully unsupervised learning method that can automatically find a list of stereotypical driving behaviours from observed driving behaviour data is required. The DAA is an unsupervised learning method originally proposed by Taniguchi et al. for modelling and segmenting human bodily motion [20]. Takenaka et al. proposed using a DAA for modelling driving behaviour and segmenting continuous driving behaviour into meaningful chunks by focusing on the structural similarity between driving behaviour data and spoken language [2]. The DAA can extract a stereotypical driving behaviour as a sequence of hidden states. We call a sequence of hidden states a driving word and it corresponds to a stereotypical driving behaviour. Takenaka et al. proposed a video summarization method on the basis of the DAA [21]. In addition, Nagasaka et al. used the DAA to extract robust chunks of driving behaviour and obtained some qualitative results [22]. Bando et al. proposed a topic modelling method for driving behaviour data using the DAA [23]. They also developed a drive annotation 5
method based on the topic modelling method [24]. These studies show that the DAA model is able to model driving behaviour data and segment it into meaningful chunks appropriately. They showed that driving behaviour subsequences extracted by the DAA correspond to meaningfully organized chunks. However, the original DAA is assumed to be used off-line, although a future sequence has to be predicted from the current data on-line in a prediction task. The restriction that DAA can only be used off-line is a problem. This problem is due to the use of a nonparametric Bayesian unsupervised morphological analyzer that is used in the DAA. It presumes that a sentence, which correspond to a latent state sequence of driving behaviour data, is terminated with a period, i.e. a special state representing an end of a state sequence. To overcome this problem, in this paper, we extend the Bayesian unsupervised morphological analyzer and obtain an NPYLM with prediction that can be used on-line. On the basis of the NPYLM with prediction, we develop a DAA with sequence prediction capability. In this paper, we propose a sequence prediction method on the basis of the double articulation structure by developing an NPYLM with prediction and evaluate its effectiveness through three experiments. A brief description and preliminary results were presented in a previous paper [25] and a prediction method for contextual changing points was developed on the basis of the work [26]. In this paper, we present a complete theoretical derivation and experimental evaluation. In addition to the preliminary results shown in [25], the NPYLM with prediction is evaluated by using complex long driving behaviour data recorded on a public thoroughfare including urban streets, downtown areas and highways in this paper. The NPYLM with prediction is also compared with the sequence memoizer, i.e. ∞-gram model, through the three experiments, and shown that it is better than the sequence memoizer from the viewpoints of memory efficiency and of prediction performance.
3 DOUBLE ARTICULATION ANALYSER 3.1 Overview Taniguchi et al. originally developed a DAA that allows a robot to segment and imitate unsegmented human motion data [20]. The method automatically analyses a latent double articulation structure embedded in time series data. Figure 3 illustrates what is meant by double articulation. Double articulation structures are well known in semiotics and linguistics. In particular, spoken languages have a double articulation structure and automatic speech recognition methods usually assume the structure for recognizing human speech signals. In the context of driving behaviour modelling, the DAA assumes the following twolayer hierarchical structure [2]. The DAA assumes that driving behaviour time series data are generated from a sequence of driving words (‘e’, ‘da’, ‘abc’, etc., in Figure 3). Each driving word consists of a sequence of driving letters (‘b’, ‘c’, ‘e’, etc., shown in Figure 3), which correspond to phonemes in human speech signals. Here, we note that meanings of each driving word are unknown a priori. Each letter, e.g. ‘a’, ‘b’ and ‘c’, is simply an index of a hidden variable.
6
L anguage model
da cba
fd
?
e
abc
Unkown word
Driving words
abc
e
da
cba
e
Sequence prediction
Driving letters
a b c e c b a d a e a ? ? ? Driving behaviour data
Time Segment Chunk
Figure 3: Double articulation structure and on-line sequence prediction of hidden driving letters using DAA. Usually, a phoneme does not convey any meaning in communication, whereas a word does in a human speech signal. This is an interesting characteristic of language from the viewpoint of semiotics. Analogously, the DAA assumes that a driving letter represents only physically elemental behaviour, but a driving word represents semantically elemental behaviour. The language model has a set of driving words and transition probabilities between driving words. From the viewpoint of generative models, the process of generating data that have a double articulation structure is as follows. A language model generates a sequence of driving words, each of which consists of several driving letters. Each driving letter emits feature vectors representing observed data for a certain period and then transits to the next driving letter. We assume that driving behaviour data potentially have many short segments on the basis of their distribution in feature space. We call these short-term behaviours segments (see Figure 3). A segment corresponds to a physically elemental behaviour unit. A segment is considered to be generated by a driving letter, which is almost the same as a hidden state of a dynamical latent variable model, such as HMM and HDS. The segments are chunked into longer meaningful units. We call the meaningful unit a chunk (see Figure 3). A chunk is considered to be generated by a driving word, which corresponds to a word in spoken language. A chunk corresponds to a semantically meaningful elemental driving behaviour. The DAA analyses observed data by using sticky HDP-HMM and NPYLM without any labelled data or a preexisting dictionary [20]. First, sticky HDP-HMM is used to segment and model the time-series data on the basis of the spatial distribution of the observed data [27]. The sticky HDP-HMM also estimates the number of hidden states that corresponds to the number of driving letters. Second, an unsupervised morphological analyzer using NPYLM is used to chunk the driving letter sequences on the basis of the contextual information of the sequence data [1]. The NPYLM is used to turn sequences of driving letters into driving words. The combined use of sticky HDPHMM and NPYLM enables us to extract the double articulation structure, i.e. segments
7
k πk
∞
z1
z2
z3
䈈
zT’
y1
y2
y3
䈈
yT’
k
∞
Figure 4: Graphical model of sticky HDP-HMM [27]. and chunks, from the continuous time series of observed data. The DAA can encode observed driving behaviour data into sequences of driving words in an unsupervised manner.
3.2 Sticky HDP-HMM for segmentation [27] In general, HMMs can convert time series data to discrete hidden state sequences through unsupervised learning. However, when we use conventional HMMs, we have to determine the number of hidden states in advance. To overcome this problem, Beal et al. proposed an infinite hidden Markov model (iHMM); this is the first nonparametric Bayesian statistical model that can be used on behalf of a conventional HMM [28]. Through its inference process, the iHMM can adaptively infer the number of latent states depending on the complexity of the observed data. To provide an adequate generative model for iHMM, Teh et al. proposed a hierarchical Dirichlet process-HMM (HDP-HMM) in which a hierarchical Dirichlet process mixture is extended [29]. However, a straightforward application of HDP-HMM tends to increase the frequency of transitions among hidden states, and thus, it is unsuitable for modelling real-world time series data. Fox et al. extended HDP-HMM to sticky HDP-HMM by introducing a self-transition bias, which decreases the probability of a transition between different states [27]. Figure 4 shows a graphical model of the sticky HDP-HMM. The model is useful for modelling and segmenting continuous real-world time series data. Fox et al. introduced an efficient numerical computation algorithm using a blocked Gibbs sampler as well [27]. In spite of the approximation, the sampling algorithm effectively analyses real-world time series data. In a DAA, first, the sticky HDP-HMM is applied to the observed time series data. After the learning phase, the sticky HDP-HMM encodes observed data y1:T ′ into sequences of discrete latent states z1:T ′ , where T ′ is a length of yt ∈ Rm and zt ∈ Z, m is the dimension of observed data and Z is a set of indices of latent states. z1:T ′ contains many repetitive state sequences. Gibbs sampler is a probabilistic sampling procedure. Therefore, the results change depending on the sampling steps. However, usually, z1:T ′ can be inferred almost consistently for real driving data after the posterior distribution locally converges appropriately. As an example, 100 samples of boundaries of latent states z1:T ′ estimated from driving behaviour data used in Experiment 2 are shown in Fig. 5. This figure shows that z1:T ′ were consistently sampled after the local convergence. Therefore, Gibbs sampler is simply employed for encoding y1:T ′ into z1:T ′ . 8
Samples 0
500
1000
Frame
Figure 5: Example of sampled boundaries of latent states z1:T ′ after the Gibbs sampler has locally converged. After a subsequence of the latent states has been compressed into a driving letter, e.g. from z1:T ′ = (1, 1, 1, 1, 1, 1, 5, 4, 4, 4, 4, 4, 3, 3) into l1:T = (1, 5, 4, 3), where T is a length of the driving letter sequence, the inferred driving letter sequence l1:T is given to the following chunking procedure.
3.3 Unsupervised morphological analyzer for chunking [1] Having obtained sequences of driving letters from recorded driving behaviour data, the DAA employs an unsupervised morphological analyzer using nonparametric Bayesian language models to chunk sequences of driving letters into sequences of driving words [1, 30]. In natural language processing, one of the main tasks of a morphological analyzer is to chunk sequences of letters into sequences of words. Such a task usually utilises a dictionary, i.e. a set of known words, as previous knowledge. In contrast, a set of driving words are usually unknown. Therefore, the unsupervised morphological analyzer plays an important role in chunking sequences of driving letters into driving words. Mochihashi et al. developed an unsupervised morphological analysis method based on the NPYLM [1]. The NPYLM consists of a letter n-gram model (a word model) and a word n-gram model (a language model). Both of these n-gram models are hierarchical Pitman-Yor language models (HPYLM). An HPYLM employs a hierarchical PitmanYor (HPY) process for smoothing the n-gram probability. An HPYLM calculates the n-gram transition probability of driving words by using its probability when shorter context information is given. The probability of a driving word w appearing after a context λ = wt−n+1 . . . wt−1 , which is a contextual driving word sequence prior to wt , is calculated as P(wt |λ ) =
c(wt |λ ) − d · tλ wt θ + d · tλ + P(wt |λ ′ ), θ + c(λ ) θ + c(λ )
(1)
where λ ′ = wt−n+2 . . . wt−1 is a shorter context than λ . The count of w after λ is c(w|λ ) and the sum of all driving words’ counts after λ is c(λ ). For example, a driving word w corresponds to ‘turn left’ and a context λ corresponds to ‘go straight’ and ‘stop in front of a traffic light’. In such a case, P(w|λ ) is a probability that a car turns to the left after going straight and stops in front of a traffic light. P(w|λ ′ ) becomes the base measure of P(w|λ ). This means a recursive calculation gives an n-gram probability. In HPYLM, each word has a context from which the word is generated. The context is inferred through the Gibbs sampling procedure. tλ w is a table count in which w is 9
generated from the context of λ and tλ is the sum of tλ w with respect to w. HPYLM has two hyper parameters: a discount parameter d and a concentration parameter θ . The n-gram probability of any words, including unknown words, can be calculated by using this equation recursively. When P(w|λ ) is unigram, a base measure G0 is used instead of P(w|λ ′ ). The base measure is called the zero-gram probability. The NPYLM calculates the zero-gram probability on the basis of a letter n-gram model, called a word model. An HPYLM is also used for the word model. In this study, we use bigram models for the language model and the word model. As a result, NPYLM can give a non-zero probability to all of the driving words, including unobserved ones. This enables us to use the blocked Gibbs sampler and probabilistic dynamic programming for chunking driving letter sequences without incurring too heavy a computational cost. We assume that the bigram assumption for the language model and the word model is appropriate. Mochihashi et al. compared the bigram and trigram language models and showed that the trigram assumption hardly improved the segmentation performance although computational cost and complexity increased [1]. In contrast to the language model, the word model only gives adequate initial probability to unobserved words in NPYLM. Therefore, we infer that the order of n of the word model rarely affects the overall segmentation performance. In the preliminary experiments on the segmentation of driving behaviour data, we compared the bigram word model and the longer n-gram word model. We could not find significant differences between the results. Therefore, it is reasonable to suppose that our bigram assumption is appropriate. In order to chunk given sequences of letters into words, a blocked Gibbs sampler with a forward filtering-backward sampling is proposed [1]. First, the forward probability of a letter sequence At,k is calculated recursively. t−k
At,k =
∑ P(lt−k+1:t | lt−k− j+1:t−k )At−k, j ,
(2)
j=1
where A0,0 = 0 and ls:t is a sequence of letters (ls , . . . , lt ). The memorized forward probability At,k represents the probability that the last k letters of a letter sequence (l1 , . . . , lt ) become a chunk, i.e. a driving word. After Equation 2 is performed recursively and all of the At,k are calculated, the backward sampling procedure is executed. From the tail of the sequence, i.e. t = T , lengths of driving words k are sampled sequentially as follows. 1 (3) k ∼ ∑ P(w | lt−k′ +1:t )At,k′ δ (k′ , k), Z k′ t where Zt is a normalization term, and δ is a Kronecker’s delta. For calculating Zt , the maximum length of a driving word is usually given1 . The variable w is a previously sampled subsequent driving word. Before forward filtering is executed for a target sentence selected from all the sequences in the training dataset, previously sampled driving words corresponding to the sentence are removed from the language model. After the backward sampling procedure, new samples, i.e. driving words, are added to the language model and twh , th , cwh and ch are updated. The blocked Gibbs sampling 1 Even if we set the maximum length of driving words as infinite, the normalization term k becomes no longer than the maximum length of the observed letter sequences.
10
time
1) Segmentation with sticky HDP-HMM
a b c e a b c d b e a 2) Unsupervised morphological analysis for incomplete sentence with extended NPYLM
a b c e a b c d b e a 3) MAP estimation of subsequent words
a b c e a b c d b e a b c e
Figure 6: Overview of the prediction algorithm. procedure with forward filtering-backward sampling is executed iteratively. Finally, we obtain a sample of a sequence of driving words (w1 , w2 , . . . , wS ) for each sequence of driving letters (l1 , l2 , . . . , lT ) corresponding to a sequence of observed time series data y1:T ′ where S represents the number of inferred words for the target driving letter sequence. We also obtain a driving word n-gram model. For more details, please refer to the original paper, in which the NPYLM and Bayesian unsupervised morphological analyzer were introduced [1].
4 SEQUENCE PREDICTION METHOD 4.1 Overview We developed a sequence prediction method named NPYLM with prediction by exploiting the language model obtained by the DAA. An overview of our proposed prediction algorithm is shown in Figure 6. In contrast to the off-line segmentation task, in the prediction task the observed sequence is not completed, i.e. the driving behaviour data are not complete and the driver is still driving the car on a road. Therefore, we cannot assume that the driving letter sequence is completed as is a written sentence. The hidden sequence that potentially exists behind driving behaviour data does not usually reach a special latent state representing an end of a sentence, i.e. EOS in natural language processing. To enable the DAA to predict subsequent driving letters, we extended the morphological analyzer using NPYLM so that it can handle incomplete sentences. If we can analyse an incomplete sentence with NPYLM, we can estimate the subsequent letters from the maximum a posteriori probability (MAP). An overview of the prediction algorithm is shown in Figure 6.
4.2 Unsupervised morphological analyzer for incomplete sentences While the driver is driving a car, the intelligent vehicle observes driving behaviour data as multivariate time-series data from various sensors. The time-series data, however, are incomplete until the driver stops the car and turns off the ignition. This means that 11
the latent sequence of driving letters is an incomplete sentence when the prediction method is used. Figure 3 shows a situation in which an incomplete sentence the last word of which is an incomplete word is given to a sequence prediction method. To chunk incomplete sentences appropriately, an extended morphological analyzer for incomplete data should be developed, because the previous unsupervised morphological analyzer is intended for complete sentences. For illustrative purposes, let us take ‘howmuchist’, which is an incomplete letter sequence of ‘how much is this’, as an example. If we directly apply an unsupervised morphological analyzer to ‘howmuchist’, it will output a poor result because it cannot give an appropriate probability for the last letter ‘t’, which is an incomplete spelling of ‘this’. To analyse such an incomplete letter sequence that probably includes an incomplete word on its tail, the incomplete word must be given a theoretically appropriate probability. The language model must calculate an appropriate probability for all possible last incomplete words ‘t’, ‘st’, ‘ist’ or some other suffix of the sentence that does not have adequate spaces for unsupervised morphological analysis. In most cases, incomplete words are not added to the language model even if the original complete words have already been registered in the dictionary. To calculate the probability of an incomplete word theoretically, we propose marginalizing over the distribution of an infinite number of possible words for an incomplete word. HPYLM theoretically assumes there is an infinite number of words. Therefore, the marginalization presents some difficulty in terms of the summation of an infinite number of terms. However, we can analytically perform the marginalizing process over an infinite number of possible words by utilizing the bigram property of the word model, which is involved in the NPYLM. Here, the prefix relationship between two strings is represented using the symbol ⊐. w2 ⊐ w1 means w1 is a prefix of w2 , e.g. ‘xyzw’ ⊐ ‘xy’ and ‘145145’ ⊐ ‘14’. Using this symbol, the n-gram probability of an incomplete driving word v can be calculated by marginalizing the n-gram probabilities of an infinite number of possible complete driving words. P(v|λ ) = ∑ P(w|λ ) (4) ∀w⊐v
The right side of the equation shows the infinite sum of probability of the possible subsequent words w including v as their prefix. For example, if v =‘14’, all of w including ‘14’ as their prefix, e.g. ‘143’, ‘1465’, and ‘141421’, are taken into consideration. The infinite sum on the right hand side of Equation 4 seems intractable at first glance. We have to consider an infinite number of possible driving words that have the incomplete driving word v at their head to calculate the sum. However, the nonparametric Bayesian characteristics of NPYLM and the bigram assumption of the word model make it com-
12
putable. We derive Observed driving word
z }| { ∑∀w⊐v {c(w|λ ) − d · tλ w } ∑ P(w|λ ) = θ + c(λ ) ∀w⊐v +
θ + d · tλ ∑ P(w|λ ′ ) θ + c(λ ) ∀w⊐v
(5)
using Equation 1. The first term on the right hand side addresses driving words that have non-zero counts, i.e. w is observed more than once after a context λ . The operation of the first term must be tractable. The second term is also calculated for the observed driving word w. Therefore, P(v|λ ) can be calculated for the observed driving words by recursively applying Equation 5. This means that we have to consider only the observed driving words. For example, when driving letters v represent ‘step on the accelerator’, w corresponding to observed driving behaviours that start with stepping on the accelerator, e.g. ‘start from parking’, ‘start at traffic light and turn left’ and ‘passing a pedestrian by speeding up’, should be considered. However, when the length of the context λ reaches 0, we have to consider the base measure of the unigram model P(w|λ ) where λ = 0/ , i.e. there is no context information. An infinite number of driving words having v as a prefix have to be taken into consideration. In NPYLM, G0 is given by its driving letter n-gram model. Here, we must pay attention to the difference between an incomplete driving word v = (l1 , l2 , . . . , lm ) and a complete driving word w = (l1 , l2 , . . . , lm ). Although a complete driving word w has a special letter for the end of the driving word, i.e. EOW in natural language processing, an incomplete driving word v does not. Thus, we have to put EOW at the end of an incomplete driving word v = (l1 , l2 , . . . , lm ) to obtain a complete driving word. If we denote EOW explicitly, w becomes w = (l1 , l2 , . . . , lm , lm+1 = EOW ). As a result, the 0-gram probability of an incomplete driving word can be calculated by marginalizing all possible complete driving words as follows. Unobserved driving word
z
∑
}| { G0 (w)
∀w⊐v
=
∑
Pletter (w)
∀w⊐v
∑
= Pletter (v)
Pletter (w/v|λ = v)
(6) (7)
∀w⊐v
= Pletter (v) ∑ Pletter (w′ |λ = v)
(8)
= Pletter (v).
(9)
∀w′
where Pletter is the word model, i.e. a driving letter n-gram model, and w/v is a substring that remains after subtracting a substring v from the head of w. The equations show that the sum of the probability of an infinite number of incomplete words can be easily computed by using the word model, i.e. the driving letter n-gram model, which is a base measure of the language model. This means that an unsupervised morphological analyzer can be extended to analyse incoming incomplete sentences by giving an incomplete word an appropriate probability. 13
The forward probability for an incomplete letter sequence at T can be calculated as follows. t−k
AT,k =
incomplete | lt−k− j+1:t−k )At−k, j , ∑ P(lt−k+1:t
(10)
j=1
incomplete where lt−k+1:t is a driving letter sequence that is considered an incomplete driving incomplete | lt−k− j+1:t−k ) can be calculated using Equation 4. word. The probability P(lt−k+1:t On the basis of the forward probability of an incomplete letter sequence, the backward sampling procedure samples driving words (w1 , w2 , . . . , wS−1 , vS ) in the same way as the unsupervised morphological analyzer for an complete sentence, where vS is an incomplete driving word at the end of the sequence.
4.3 Sequence prediction of subsequent latent letters The sequence prediction is performed after the DAA produces a chunked incomplete sentence and an incomplete last word, such as the last ‘a’ in Figure 6-2. The last complete word and subsequent words are estimated on the basis of a MAP criterion, such as ‘abc’ and ‘e’ in Figure 6-3, respectively. First, the algorithm obtains the result of the morphological analyzer after a sufficient number of iterations of the blocked Gibbs sampler, as described in the previous subsection. The result is (w1 , w2 , . . . , wS−1 , vS ) (11) where vS is an incomplete word. Second, the sequence prediction method takes a complete word wˆ S that has the estimated incomplete word as its prefix and the highest posterior probability based on the sampled chunks and the language model. wˆ S = argmax P(wS |wS−1 ) ∀wS ⊐vS
(12)
Third, it infers subsequent words wˆ k (k > S) that have the highest posterior probability on the basis of the estimated language model, recursively. wˆ k = argmax P(wk |wˆ k−1 ) ∀wk
(13)
Finally, the sequence prediction method outputs a predicted driving word sequence as follows. (w1 , w2 , . . . , wS−1 , wˆ S , wˆ S+1 , wˆ S+2 , . . .) (14) The predicted driving letter sequence corresponding to the driving word sequence is also obtained at the same time.
5 EXPERIMENTS We evaluated our sequence prediction method in three experiments. We tested our method on a synthetic data and real driving data recorded on a course at a factory and on a public thoroughfare. 14
5.1 Experiment 1: Synthetic data The experiment using synthetic data was used to evaluate the theoretical consistency and ideal performance of the algorithm. Since our method presumes that the target data have a double articulation structure, we prepared synthetic symbolic data having such a structure and applied our method to it. 5.1.1 Conditions We presumed that the numbers of driving words and driving letters were fixed but unknown. To prepare synthetic data potentially having a double articulation structure, we used a synthetic word model and a synthetic language model, both of which are bigram models. The transition probability was drawn from a Dirichlet distribution:
πs st+1
∼ Dir( ∼ πst
c(1 − γ ) c(1 − γ ) ,··· , , γ) N N
(15) (16)
where π is a state-dependent categorical distribution over N states and a special state, EOW or EOS. For the word model, we set the number of letters as Nletter = 5, c = 10 and γ = 0.2. Nword = 10 words were generated with the constraint that the word length had to be shorter than five letters. For the language model, we set γ = 0.0 and generated word sequences until they reached 30 words. We prepared 20 letter sequences. The constant c was set to 10. We employed a leave-one-out procedure to evaluate the performance of the sequence prediction method. A test datum was removed from the dataset and the other data were used as a training data set for the sequence prediction method. We prepared incomplete letter sequences for the test data by cutting the last part of the generated complete letter sequences. The last {10, 15, 20, 25, 30} letters were deleted in each experiment. The sequence prediction method then tried to predict the subsequent erased letters. We compared NPYLM with prediction with three baseline methods: a letter-based bigram model, a simple NPYLM and a sequence memoizer. The letter-based bigram model predicts the next letter on the basis of the present letter. The simple NPYLM was the morphological analyzer proposed by Mochihashi [1]. It does not take the incompleteness of the sequential data into consideration, analyses the given sentence as a complete sentence and predicts the MAP subsequent words. Conventional unsupervised learning approaches to driving behaviour analysis have often used HMM and HDS, which assume that the transition model of its hidden states has a Markovian property, i.e. a letter-based bigram model. In addition, we should compare our model with a higher-order Markov model, i.e. the n-gram model. An adequately smoothed higher-order n-gram model should be able to predict a longer letter sequence. We used a sequence memoizer, which is an ∞-gram model, as a comparative model2 . The sequence memoizer was proposed by Wood et al. It models sequence data by memorizing all sequence data with a special HPY smoothing [31] and does not terminate its context, 2 We used the sequence memoizer C++ package libplump-0.1 provided by Jan Gasthaus at http://www.sequencememoizer.com/ in this experiment.
15
unlike conventional n-gram models that terminate contexts longer than n states. The sequence memoizer was reported to outperform many n-gram models in a sequence prediction task of natural language. 5.1.2 Results The average length for which each model can predict subsequent letters is shown in Figure 7. The figure shows how many subsequent letters can be correctly estimated by each method. The results show that the sequence memoizer and the NPYLM with prediction outperformed the other methods. Figure 8 shows a histogram of the lengths the sequence prediction methods could predict. The length correctly predicted by the bigram model decays exponentially, whereas NPYLM with prediction predicts much longer letter sequences. This result is due to the contextual information that the DAA could utilize and the knowledge of driving words acquired from the dataset in an unsupervised manner. Let us explain why the performance of the sequence memoizer was almost the same as that of NPYLM with prediction. In contrast to NPYLM with prediction, which estimates chunks and a set of words explicitly, the sequence memoizer memorizes all contextual information. The word-level bigram prediction requires only its previous word information. In this case, a letter n-gram model the order of which is higher than the maximum length of two words can have almost the same information as NPYLM with prediction. The synthetic data were purely generated from the word n-gram model without any disturbance. This means the performance of the two methods was almost the same. In contrast to their prediction performances, the memory requirements of the two methods differed greatly. We performed an additional experiment to compare the memory efficiency of NPYLM and the sequence memoizer. Ten synthetic datasets were prepared for each experimental setting. We set Nletter = Nword = 5 and the number of sentences as 10. Setting the lengths of the sentence as 5, 10, 20 or 40, we learned the sequence memoizer and NPYLM the target sentences. Figure 9 shows the number of nodes in the language model, i.e. the required memory size. The NPYLM and the sequence memoizer dynamically allocate memories in their language model represented by a tree structure. The number of nodes represents the memory size that each language model uses. NPYLM with prediction keeps the number of nodes in the language model relatively unchanged, while the sequence memoizer increases the number of nodes almost in proportion to the size of the dataset.
5.2 Experiment 2: Driving data on a factory course Next we evaluated the performance of NPYLM with prediction using real-world driving data. Through this experiment, we also investigated whether driving behaviour does in fact have a double articulation structure.
16
Number of predicted letters 0.5 1.0 1.5 2.0 2.5 3.0 0.0
Bigram
NPYLM
NPYLM with prediction
Squence memoizer
0.6 0.3 8 13 Bigram
18
Letters 0
4
8 13 NPYLM
18
0.3
0.6
4
0.0
Letters 0
Letters 0 4 8 13 18 NPYLM with prediction
0.0
Probability 0.0 0.3 0.6
Probability 0.0 0.3 0.6
Figure 7: Average length the sequence prediction method could predict.
Letters 0 4 8 13 18 Sequence memoizer
Figure 8: Histogram of lengths the sequence prediction methods could predict. The horizontal axis shows length of predicted letters.
17
1500 500 0
Number of nodes
2500
Sequence memoizer NPYLM with prediction
0
10
20
30
40
Length of a sentence
Figure 9: Number of nodes generated for modelling sequential data.
Parking
Course A
Course B
Figure 10: Map of the two courses in the experiment. A participant drove a car five times on each course.
Figure 11: Example of the view from the driver’s seat.
18
5.2.1 Conditions The target dataset for this experiment was obtained as follows. A participant drove a car along two different courses around a factory, as illustrated in Figure 10. At the start, the car was parked in the parking lot. The driver drove one lap, returned to the start position and stopped. The same participant drove each course five times and we collected a total of ten driving behaviour time series datasets. Both courses constituted five laps. Several disturbances occurred in each lap. For example, a pedestrian walked across a road or sometimes there was a vehicle in front of the car. Figure 11 shows an example of the view from the driver’s seat. Driving behaviour data were recorded through CAN. The data consisted of the accelerator pedal position, brake pressure, steering angle and velocity of the car. Sixdimensional driving behaviour time series datasets were obtained by adding temporal difference in velocities and in steering angles to these four-dimensional datasets as dynamic features. Sequences of driving letters were obtained by applying a sticky HDP-HMM to the six-dimensional driving behaviour data3 . Four prediction methods were applied to the resulting label sequences. The procedure of the experiment was same as in experiment 1. 5.2.2 Results Figure 12 shows the relationship between the position on the course and inferred segments and chunks. Inferred segments are shown as coloured lines and the borders of chunks are shown as grey lines4 . The sticky HDP-HMM frequently encoded physically similar behaviours into the same driving letter sequences. As the asterisks in Figure 12 indicate, the lower right and lower left corners in the seventh lap have a chunk with the same letter sequence, i.e. 6 → 28 → 14. In Figure 13 the average lengths of the sequences predicted by each method are plotted, and in Figure 14 the histograms of the predicted lengths are plotted. These results show that our method outperformed the bigram model, the simple NPYLM and the sequence memoizer. We also present the averaged prediction lengths and their standard deviation in the time domain in Table 1. In this experiment, a segment took 2.9 sec on average. Although the sequence memoizer and NPYLM with prediction showed almost the same performance as in experiment 1, our method outperformed the sequence memoizer in this experiment using real driving behaviour data. This suggests that the sequence memoizer overfitted the latent sequence data in each training dataset. When HMM-based recognition methods including the sticky HDP-HMM try to encode driving behaviour time series data into a driving letter sequence, a certain number of recognition errors are unavoidable. Such recognition errors will contaminate the subsequent process, i.e. the unsupervised morphological analysis and prediction. However, this result shows that the DAA could model and predict the driving behavioural sequence 3 The hyperparameters of sticky HDP-HMM were α = 0.1, γ = 1.0, κ = 0.9, d = 1.0 and d = 0.1. The s f definition of the variables of hyperparameters follows those in [32]. 4 The position on the map was calculated from the encoder’s data; i.e. the trajectories were not accurately reproduced.
19
Figure 12: Inferred segments and chunks (top) in the second lap and (bottom) in the seventh lap shown on the estimated two-dimensional map. in spite of such contamination, in contrast to the sequence memoizer. Interestingly, the NPYLM with prediction could predict more than 10 subsequent letters; in contrast, the bigram model can predict no more than five subsequent letters, except in the case of one sample. The results of this experiment show that driving behaviour is predicted better by a DAA than by a conventional one-layer Markov model, i.e. n-gram models. This also suggests that driving behaviour potentially has a double articulation structure. Thus, the experimental results support our working hypothesis.
5.3 Experiment 3: Driving data on a public thoroughfare The dataset treated in the previous experiment was still organized as compared with our daily driving behaviour data. The dataset was recorded on factory courses, which were laid out artificially. For that reason, we also tested our method on a dataset recorded on a public thoroughfare. In this experiment, we applied NPYLM with prediction to actual driving behaviour data recorded in real traffic situations.
20
6 Number of predicted letters 1 2 3 4 5 0
Bigram
NPYLM
NPYLM with prediction
Squence memoizer
Figure 13: Average length over which the sequence prediction method could predict.
Table 1: Length in time domain over which the sequence prediction method could predict. Method Average (SD)
Bigram 3.9 sec (6.5)
NPYLM 3.4 sec (10.7)
NPYLM with prediction 17.0 sec (19.8)
Squence memoizer 8.4 sec (10.2)
5.3.1 Conditions The dataset was recorded while a driver drove a car along a public thoroughfare including urban streets, downtown areas and highways. Ten driving behavioural time-series datasets were recorded. Each driving behaviour was recorded from the start to the goal. The courses are shown in Figure 15 5 . Each course took about 50 mins on average. All the other conditions were the same as those in experiment 2. Figure 16 shows various views obtained by the vehicle’s video system. This dataset contained various situations and driving behaviours. Therefore, the time-series data contained in the dataset were more difficult to predict. 5.3.2 Results The prediction performance was evaluated as in the first two experiments. Figure 17 shows the average lengths of sequences predicted by each method. Figure 18 shows a histogram that the sequence prediction methods could predict. These results show that NPYLM with prediction outperformed the other methods. In this case, the sequence memoizer gave relatively poor results. In this experiment, a sequence of driving data had 2,000 segments on average. This corresponds to a sentence consisting of 2,000 words in natural language, much longer than normal sentences. On the other 5 The
positions in the map are plotted from GPS data.
21
0.4 6 9 13 Bigram
Letters 0
3
6 9 13 NPYLM
Letters 0 3 6 9 13 NPYLM with prediction
0.0
0.2
0.4
3
0.0
0.2
Probability 0.2 0.4 0.0 Probability 0.2 0.4 0.0
Letters 0
Letters 0 3 6 9 13 Sequence memoizer
Figure 14: Histogram of lengths the sequences prediction methods could predict. The horizontal axis shows the length of predicted letters.
hand, there were only 10 sentences in this experiment. It is possible that this caused overfitting and degraded the sequence memoizer’s performance. In this experiment, a segment lasted 16.1 sec on average. Because the dataset recorded on a public thoroughfare contained many kinds of driving situations, the prediction task was difficult. No prediction method could predict longer than eight driving letters. However, the proposed method performed better than the other methods. Improvement in the prediction performance for a public thoroughfare, treating various driving situations, e.g. urban streets, downtown and highways, adequately remains for our future work. Further, we present the averaged prediction lengths and their standard deviation in the time domain in Table 2. In the time domain, the bigram performed better than the NPYLM with prediction. However, particularly in the case of public thoroughfare, the duration of a driving letter varies dynamically and fair evaluation in the time domain becomes difficult. For example, a driving letter representing driving at constant speed on a highway continued for longer than a minute in the experiment; in contrast, that representing a breaking behaviour or an avoiding pedestrian behaviour in the downtown continued for only about a second in many cases. Obviously, predicting 60 driving letters, each of which persists for a second, is more difficult and more important than predicting a driving letter representing a simple behaviour that persists for 60 s in the scenario shown in Figure 1. To establish a more appropriate evaluation criterion is also one of our future works. Table 3 shows the number of nodes in the suffix tree of the resulting language models. The number of nodes represents the size of the required memory. This shows that NPYLM could model latent sequences of driving behaviour more efficiently than the sequence memoizer from the viewpoint of memory in the same manner as with synthetic data.
22
Figure 15: Courses in experiment 3.
Figure 16: Scenes in experiment 3.
6 CONCLUSIONS We developed a new sequence prediction method named NPYLM with prediction by extending a DAA for predicting driving behaviour data. In particular, we extended the unsupervised morphological analyzer proposed by Mochihashi et al. [1], which is a component of a DAA, so that it could analyse incomplete symbolic sequential data. This extension enables the DAA to handle incoming time-series data on-line. The extension was derived by marginalizing an infinite number of possible driving words by exploiting certain properties of the letter n-gram model, which is a base measure for the word n-gram model in NPYLM (see Equation 6 to 9). Our evaluation using a synthetic dataset proved that NPYLM with prediction outperformed the conventional Markov model, a simple NPYLM that did not consider the incompleteness of the observed sentence and a sequence memoizer, which is an ∞-gram model. We applied it to a real driving behaviour dataset recorded by driving a car on various test courses. In the experiment, NPYLM with prediction outperformed the baseline methods. It was also proved that NPYLM with prediction models driving data more efficiently than does the sequence memoizer. Although the NPYLM with prediction outperformed the other methods in the three
23
Number of predicted letters 0.0 0.2 0.4 0.6 0.8 1.0 1.2 1.4
Bigram
NPYLM
NPYLM with prediction
Squence memoizer
0.4 0.2 4
8 13 Bigram
18
Letters 4
8 13 NPYLM
18
0.4
0
0.2 Letters 0 4 8 13 18 NPYLM with prediction
0.0
0.0
0.0
Letters 0
Probability 0.2 0.4
0.0
Probability 0.2 0.4
Figure 17: Average length the sequence prediction method could predict.
Letters 0 4 8 13 18 Sequence memoizer
Figure 18: Histogram of lengths the sequence prediction methods could predict. The horizontal axis shows the length of predicted letters.
experiments, the relative performances were different, i.e. the sequence memoizer had the almost same performance as the NPYLM with prediction in experiment 1, and the bigram exhibited good performance in experiment 3. The recognition error, i.e. encoding error by the sticky HDP-HMM, and the repeated structure of latently embedded chunks are considered to be the main causes of the differences, as shown in Table 4. When the sticky HDP-HMM encodes real driving behaviour data to driving letter sequences, it inevitably produces a small number of errors. In the absence of such recognition errors, i.e. in experiment 1, the sequence memoizer worked well. However, the performance of the sequence memoizer was affected by the errors because it takes the entire past context into consideration when it predicts a future sequence. On the other hand, the NPYLM with prediction cuts its past context when this context is longer than a driving word. It is considered that the cutoff of a very long context on the basis of an assumption that only the current driving word affects the next driving word prevented the deterioration of the prediction performance by the recognition errors. The NPYLM
24
Table 2: Length in time domain over which the sequence prediction method could predict. Method Average (SD)
Bigram 11.7 sec (26.9)
NPYLM 3.5 sec (14.8)
NPYLM with prediction 8.9 sec (22.5)
Squence memoizer 2.3 sec (10.4)
Table 3: Number of nodes generated for modelling sequential data Method The number of nodes
Sequence memoizer
NPYLM with prediction
31273
401
with prediction presumed that the target dataset potentially has a repeated structure of latently embedded chunks. Therefore, if the dataset does not contain a sufficient number of repeated chunks and transition patterns between chunks, the performance of the NPYLM with prediction becomes relatively worse. As shown in Figure 14, unlike in experiment 2, where the same course was driven through five times, in experiment 3, the same course was not driven through even twice. This must have reduced the difference between the NPYLM with prediction and the bigram, as shown in Fig. 17. However, experiment 3 shows that the proposed method still outperformed the conventional methods. The comparison between results in experiment 2 and experiment 3 suggests that if the driving situation is roughly determined a priori to be one of several situations, e.g. highway, downtown, factory, or commuting road, and the predictor can be switched on the basis of this situation, the prediction performance of the proposed method might be improved. In the experiments, we compared the NPYLM with prediction with other baseline methods from the viewpoint of a predicted letter sequence based on the MAP estimation. Although the NPYLM with prediction is a Bayesian probabilistic prediction method, such a prediction task could not evaluate the probabilistic nature of the pro-
Table 4: Differences among the three experiments Experiment 1 Existence of recognition errors Degree of repeated structure of latently embedded chunks
Extremely high
25
Experiment 2
Experiment 3
✓
✓
High
Low
posed method. We could not evaluate the methods from the viewpoint of likelihood or posterior probability in this study because a fair comparison between the letter-based n-gram models, i.e. the bigram model and the sequence memoizer, and the word-based n-gram models, i.e. the NPYLM and the NPYLM with prediction, is difficult. To evaluate the probabilistic nature of the proposed method, and to make use of the advantage that the NPYLM with prediction can predict subsequent driving letters as a probabilistic mixture of subsequent driving words are some of our future works. To model and predict actual temporal information is also important. We have already extended the proposed method and developed a prediction method that models temporal duration distribution and considers all possible subsequent words explicitly. Preliminary results of the method are reported in [26]. However, to develop a more sophisticate prediction method that can take temporal and probabilistic information of driving behaviour into account is also a direction of our future work. In this paper, we focussed on the basic six-dimensional driving behaviour data, e.g. accelerator, brake, and velocity, that are controlled by drivers almost directly. We suggested that the time series data have a double articulation structure and developed a sequence prediction method. Of course, considering GPS as well as other visual information, e.g. traffic lights, pedestrians, and cars, is also important to model driving behaviour more precisely and improve prediction performance. However, the characteristics of these data are different from the basic driving behaviour data on which we focussed in this paper. To incorporate such data with DAA, Bando et al. have already proposed the DAA with multimodal latent Dirichlet allocation [24]. To develop a prediction method incorporating such outside information is another aim of our future work. The conventional approaches of driver assistance systems, e.g. obstacle avoidance and lane-keeping assistance systems, are usually based on the short-term prediction of observable variables. Long-term prediction of latent variables, i.e. driving letters and driving words, will allow an intelligent vehicle to give assistive information to the driver and prepare the next assistance service on the basis of a predicted scenario corresponding to a predicted sequence of driving letters and driving words. An example scenario is shown in Figure 1. However, thus far the proposed method does not suffice to allow us to develop a driving agent that helps drivers proactively, as shown in Figure 1. We obtained good results in the experiments. The method allows the driving agent to predict the most probable scenario, i.e. ‘which driving word the driver is doing now’ and ‘which driving word the driver will do next’. However, the agent cannot understand what each driving word in fact represents because DAA and NPYLM with prediction are fully unsupervised learning methods. Additional learning methods that allow the driving agent to infer ‘what does the driving word mean?’ and answer ‘what kind of information should I give to the driver?’ are required for developing a driving agent, as shown in Figure 1. Recently, Bando et al. introduced an automatic annotation method based on the DAA and the multimodal latent topic model [24,33]. The development of an unsupervised learning method based on such research studies that allows a driving agent to infer the meaning of chunks, i.e. driving words, is our future work. In this paper, we proposed a fundamental prediction method for general purpose. The development of practical applications of the proposed method is also our future 26
work.
References [1] D. Mochihashi, T. Yamada, and N. Ueda. Bayesian unsupervised word segmentation with nested Pitman-Yor language modeling. In the Joint Conference of the 47th Annual Meeting of the ACL and the 4th International Joint Conference on Natural Language (AFNLP), pages 100–108, 2009. [2] Kazuhito Takenaka, Takashi Bando, Shogo Nagasaka, Tadahiro Taniguchi, and Kentaro Hitomi. Contextual scene segmentation of driving behavior based on double articulation analyzer. In IEEE/RSJ International Conference on Intelligent Robots and Systems (IROS), pages 4847–4852, 2012. [3] Junping Zhang, Fei-Yue Wang, Kunfeng Wang, Wei-Hua Lin, Xin Xu, and Cheng Chen. Data-driven intelligent transportation systems: A survey. IEEE Transactions on Intelligent Transportation Systems, 12(4):1624–1639, 2011. [4] T. Pilutti and A.G. Ulsoy. Identification of driver state for lane-keeping tasks. IEEE Transactions on Systems, Man, and Cybernetics, Part A: Systems and Humans, 29(5):486–502, 1999. [5] Steven D Keen and David J Cole. Bias-free identification of a linear modelpredictive steering controller from measured driver steering behavior. IEEE Transactions on Systems, Man, and Cybernetics. Part B: Cybernetics, 42(2):434– 43, 2012. [6] J¨urgen Wiest, M Hoffken, Ulrich Kresel, and Klaus Dietmayer. Probabilistic trajectory prediction with gaussian mixture models. In IEEE Intelligent Vehicles Symposium (IV), pages 141–146, 2012. [7] Dizan Vasquez, Thierry Fraichard, and Christian Laugier. Incremental Learning of Statistical Motion Patterns With Growing Hidden Markov Models. IEEE Transactions on Intelligent Transportation Systems, 10(3):403–416, 2009. [8] Pongtep Angkititrakul, Ryuta Terashima, and Toshihiro Wakita. On the Use of Stochastic Driver Behavior Model in Lane Departure Warning. IEEE Transactions on Intelligent Transportation Systems, 12(1):174–183, 2011. [9] W. Takano, A. Matsushita, K. Iwao, and Y. Nakamura. Recognition of human driving behaviors based on stochastic symbolization of time series signal. In IEEE/RSJ International Conference on Intelligent Robots and Systems (IROS), pages 167–172, 2008. [10] Y. Kishimoto and K. Oguri. A modeling method for predicting driving behavior concerning with driver’s past movements. In IEEE International Conference on Vehicular Electronics and Safety (ICVES), pages 132–136, 2008.
27
[11] S. Sekizawa, S. Inagaki, T. Suzuki, S. Hayakawa, N. Tsuchida, T. Tsuda, and H. Fujinami. Modeling and recognition of driving behavior based on stochastic switched arx model. IEEE Transactions on Intelligent Transportation Systems,, 8(4):593–606, 2007. [12] H. Okuda, T. Suzuki, A. Nakano, S. Inagaki, and S. Hayakawa. MultiHierarchical Modeling of Driving Behavior Using Dynamics-Based Mode Segmentation. IEICE TRANSACTIONS on Fundamentals of Electronics, Communications and Computer Sciences, 92(11):2763–2771, 2009. [13] H. Okuda, N. Ikami, T. Suzuki, Y. Tazaki, and K. Takeda. Modeling and Analysis of Driving Behavior Based on a Probability-Weighted ARX Model. IEEE Transactions on Intelligent Transportation Systems, 14(1):98 – 112, 2013. [14] Ryunosuke Hamada, Takatomi Kubo, Kazushi Ikeda, Zujie Zhang, Takashi Bando, and Masumi Egawa. A comparative study of time series modeling for driving behavior towards prediction. In Asia-Pacific Signal and Information Processing Association Annual Summit and Conference (APSIPA), pages 1–4. IEEE, 2013. [15] P. Angkititrakul, T. Ryuta, T. Wakita, K. Takeda, C. Miyajima, and T. Suzuki. Evaluation of driver-behavior models in real-world car-following task. In IEEE International Conference on Vehicular Electronics and Safety (ICVES), pages 113–118, 2010. [16] Shun Taguchi, Shogo Sekizawa, Shinkichi Inagaki, and Tatsuya Suzuki. Stochastic modeling and analysis of drivers ’decision making. In 2007 IEEE International Conference on Systems, Man and Cybernetics, pages 587–592, 2007. [17] J.-H. Kim, S. Hayakawa, T. Suzuki, K. Hayashi, S. Okuma, N. Tsuchida, M. Shimizu, and S. Kido. Modeling of Driver’s Collision Avoidance Maneuver Based on Controller Switching Model. IEEE Transactions on Systems, Man and Cybernetics, Part B: Cybernetics, 35(6):1131–1143, 2005. [18] Guozhen Zhao and Changxu Wu. Mathematical modeling of driver speed control with individual differences. IEEE Transactions on Systems, Man, and Cybernetics: Systems, 43(5):1091–1104, 2013. [19] Leo Dorst. Analyzing the Behaviors of a Car : A Study in Abstraction of GoalDirected Motions. IEEE Transactions on Systems, Man and Cybernetics, Part A: Systems and Humans, 28(6):811–822, 1998. [20] T. Taniguchi and S. Nagasaka. Double Articulation Analyzer for Unsegmented Human Motion using Pitman-Yor Language Model and Infinite Hidden Markov Model. In IEEE/SICE International Symposium on System Integration (SII), 2011. [21] Kazuhito Takenaka, Takashi Bando, Shogo Nagasaka, and Tadahiro Taniguchi. Drive video summarization based on double articulation structure of driving behavior. In Proceedings of the 2012 ACM Multimedia Conference, pages 1169– 1172, 2012. 28
[22] Shogo Nagasaka, Tadahiro Taniguchi, Genki Yamashita, Kentarou Hitomi, and Takashi Bando. Finding meaningful robust chunks from driving behavior based on double articulation analyzer. In IEEE/SICE Intl Symposium on System Integration (SII), pages 535–540, 2012. [23] Takashi Bando, Kazuhito Takenaka, Shogo Nagasaka, and Tadairo Taniguchi. Unsupervised drive topic finding from driving behavioral data. In IEEE Intelligent Vehicles Symposium (IV), pages 177–182, 2013. [24] Takashi Bando, Kazuhito Takenaka, Shogo Nagasaka, and Tadahiro Taniguchi. Automatic drive annotation via multimodal latent topic model. In IEEE/RSJ International Conference on Intelligent Robots and Systems (IROS), pages 2744– 2749, 2013. [25] Tadahiro Taniguchi, Shogo Nagasaka, Kentarou Hitomi, Naiwala P Chandrasiri, and Takashi Bando. Semiotic prediction of driving behavior using unsupervised double articulation analyzer. In IEEE Intelligent Vehicles Symposium (IV), pages 849–854, 2012. [26] Shogo Nagasaka, Tadahiro Taniguchi, Kentarou Hitomi, Kazuhito Takenaka, and Takashi Bando. Prediction of next contextual changing point of driving behavior using unsupervised bayesian double articulation analyzer. In IEEE Intelligent Vehicles Symposium (IV), pages 924–931, 2014. [27] E. B. Fox, E. B. Sudderth, M. I. Jordan, and A. S. Willsky. The Sticky HDPHMM: Bayesian Nonparametric Hidden Markov Models with Persistent States. Technical Report 2777, MIT Laboratory for Information and Decision Systems, 2007. [28] M.J. Beal, Z. Ghahramani, and C.E. Rasmussen. The infinite hidden Markov model. Advances in Neural Information Processing Systems, 1:577–584, 2002. [29] Y.W. Teh, M.I. Jordan, M.J. Beal, and D.M. Blei. Hierarchical dirichlet processes. Journal of the American Statistical Association, 101(476):1566–1581, 2006. [30] Y.W. Teh. A hierarchical Bayesian language model based on Pitman-Yor processes. In Proceedings of the 21st International Conference on Computational Linguistics and the 44th annual meeting of the Association for Computational Linguistics (ACL), pages 985–992, 2006. [31] Frank Wood, Jan Gasthaus, and Lancelot James. A Stochastic Memoizer for Sequence Data. In International Conference on Machine Learning (ICML), 2009. [32] Tadahiro Tagniguchi, Keita Hamahata, and Naoto Iwahashi. Unsupervised segmentation of human motion data using sticky HDP-HMM and MDL-based chunking method for imitation learning. Advanced Robotics, 25(17):2143–2172, 2011.
29
[33] Takashi Bando, Kazuhito Takenaka, Shogo Nagasaka, and Tadahiro Taniguchi. Generating contextual description from driving behavioral data. In IEEE Intelligent Vehicles Symposium (IV), 2014.
30