Sequence World: A Genetics Database in Virtual Reality I. Rojdestvenski Dept. of Plant Physiology Umeå University, Sweden
D. Modjeska Dept. of Computer Science University of Toronto, Canada
F. Pettersson, M. Rojdestvenskaia, P. Gustafsson Dept. of Plant Physiology Umeå University, Sweden
[email protected]
Abstract Proper information visualization has always been viewed as an important tool for research. Traditionally, however, it was regarded as only a tool, with information content and visualization analogous to an object and its representation, respectively. These days, visualization is increasingly seen as an integral part of information content, without which data collections may lose significant value. This paper is devoted to applying a new visualization scheme – SequenceWorld – to a genetics database. We view a collection of EST sequences as a browsable virtual world. Sequences cluster according to their homologies. Their relative position, color and shape codings offer direct visual perception of a significant amount of information, which would otherwise be available only via extensive analysis of numerical and textual data. We discuss the usability of SequenceWorld for completing traditional and novel genetic database search tasks, particularly since a holistic view of a complete genome has recently become possible.
1. Introduction We are currently witnessing an explosive growth of scientific information, which strongly manifests itself in every research field, and in molecular biology in particular. A key development of modern molecular biology is towards the creation and use of genetic databases and data banks (GDBs). GDBs contain information about DNA sequences, the proteins encoded by them, and the homologies between different genes. Such GDBs result from joint efforts by many research teams and institutions. Numerous GDBs are accessible via the Internet. The various GDBs available for public access constitute an emerging informa-
tion medium, which is shared by medicine, biology, biotechnology, physiology, etc. The development of GDBs leads to new problems, whose solutions could facilitate the use of GDBs in research. Emphasis is slowly moving towards a new constellation of related problems [1,2], one of them being that of an efficient and convenient user interface (UI) for a GDB. In recent years, information visualization has become a significant research and industrial endeavor. Two frequent visualization problems are the need to trade off intelligently between overview and detail, while also allowing for customized (filtered) views of information for different situations and users. To date, these problems have been solved mainly for special cases [3]. With the advent of cheaper and more powerful computer graphics hardware and software, virtual reality has made significant inroads into engineering and architectural design, as well as popular entertainment and communication. VR has a huge potential for scientific visualization, which is only beginning to be realized. While incorporating many of the advantages of two- and three-dimensional visualization, in the best case, VR offers potential solutions to many of their problems. Moreover, scientific visualization can take advantage of existing developments in engineering and entertainment VR, while applying these features to new domains [4]. Evident advantages of using VR are sketched below [5-8]. • Subconscious orientation. Each human being possesses a well-developed apparatus for subconscious spatial orientation. By applying this apparatus to database structure that is visualized as a landscape, one might more easily navigate through a database, given a good visualization design. This approach seems to offer advantages over traditional textual browsing, where the only way of orientation is by successive linear reading, and deciding at each point how to proceed. • A compromise between overview and detail. When a user is focused on a certain neighborhood, the location
is displayed in a detailed view. Via peripheral vision, however, one can perceive other parts of the data structure, presented as geographical areas. This approach enables the user to recognize both the entire structure and his/her location in it. • Cross-reference visualization. There is much potential for visualizing cross-references relevant to a database item. Indeed, any object in three dimensions has 6 degrees of freedom (3 spatial coordinates and 3 orientation coordinates). These coordinates, along with the color, shape and texture used to code objects, may be valuable for showing homologies and other relationships between database entries. For example, spatial proximity in VR might represent compartmentalization of gene products in an organelle. Here, spatial proximity in VR would signify spatial proximity in the real organism. • Memorizing search results. Studies [9] have shown that people with exceptional memory often learn by linking concepts to objects (e.g., trees, fences) in a specific imaginary "landscape". The act of remembering seems to resemble browsing in an information system (here a mental landscape) composed of these objects. A similar process may be applied to a VR landscape used as a framework for memory. • Creation of customized virtual worlds, containing only relevant project data. For example, one might have the opportunity to save database queries as virtual neighborhoods. This tool might be convenient for monitoring a research project: the complete collection of queries could be seen as a unity, and inspection of a specific query could occur via a walk in virtual space. The aim of this paper is to discuss the visualization of a genetics database as an organized collection of objects in a virtual landscape.
2. Genetics databases: Why Virtual Reality? Genetic databases in general have the following characteristics: • A vast amount of data. Genetic databases vary in size, but efficient representation of a living organism’s genome generally requires thousands of data entries. For example, a complete human genome is estimated to contain about 3 billion base pairs [2]. • Complex data representation patterns. Data is represented in mixed graphical and textual form, each part of which is essential for efficient work. • Many classes of data. In addition to gene sequences, the database contains descriptions of proteins encoded by genes; gene location and function in an organism; and gene homologies.
• A significant amount of cross-referencing and hidden similarities. Genes can be linked in several ways, including the following: ◊ ◊ ◊ ◊ ◊ ◊
spatial proximity of their products' locations in an organism (e.g., genes of the thylakoid membrane proteins in plant cells); functional similarities of their products in different parts of an organism (e.g., genes of different carboanhydrases in plants and animals); internal homologies within the gene or protein sequences; similarities in activation/deactivation patterns; representation of parts of the same pathway (e.g., genes of the Calvin cycle enzymes); joint membership in a particular adaptation/acclimation mechanism (e.g., genes of freezing tolerance proteins and other cold acclimation enzymes);
Given such a complicated structure for data and crossreferencing, adequate data representation is essential for successful and efficient work. Traditionally, a user works with database information by browsing through a system of menus: these menus allow a user to form queries and obtain results as lists. This representation, however, has certain limitations: • There is a realistic limit to the amount of data that a researcher can perceive at one time. • The data is presented in the form of lists. This representation is effectively one-dimensional, so that browsing individual list elements is the only way to inspect the data. • The cross-linking and similarities patterns form a multidimensional topological network, which conflicts with the usual one-dimensional representation. The above limitations make the GDB a promising candidate for a 3D visualization technique, whose advantages may help to overcome these limitations.
3. SequenceWorld: A prototype virtual reality representation of a genetics database. Concept. The SequenceWorld project is aimed at applying the power of sensori-motor perception and spatial navigation to working with a genetics database. The goal of this prototype version is as follows: to develop and test a new approach to analyzing data in a GDB, using elements of VR technology and philosophy - a virtual “knowledge” landscape. This landscape could offer new insights into the structure of data relationships, help to organize individual research information, and make navigation through large databases easy and informative. Two working demos of SequenceWorld – “Colors and Shapes”
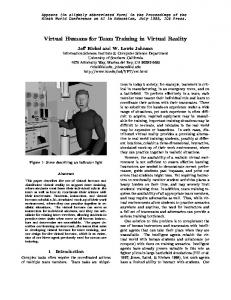
and “Fading Annotations” can be found on the Web at http://130.239.110.70. (The prototypes were implemented in Virtual Reality Modeling Language (VRML), which can be displayed by utilities in WWW browsers.) Data source. The database entries represent a small subset of Populus DB, that is, 1106 EST-sequences from the poplar genome. This data was obtained within the framework of the Populus project [12], which was began in 1996 in the Swedish University of Agricultural Sciences in Umeå (SLU), in collaboration with the Department of Plant Physiology at Umeå University. The sequences are annotated according to best homologous entry from the SwissProt database, which links the poplar sequences with sequences from other organisms. Data landscape. The data landscape was designed as a 2D plane in 3D space. Of course, topologically speaking, 3D spaces offer more freedom for positioning objects than do 2D planes. However, the human experience of living with gravity restricts our built-in navigation abilities to a more or less two-dimensional layer on the ground. For this reason, though a SequenceWorld user has full mobility in the upper 3D half-space, data objects' positions are restricted to a 2D square, which represents "the ground." Data positioning. We clusterized database entries according to similarity (as defined by the BLAST algorithm [12]), using a Monte-Carlo simulated annealing algorithm in 2D space [13]. Within the framework of this algorithm, we treated database objects as particles in 2D space, with a pair interaction function depending, for each pair of particles, on mutual homology. When the “temperature” of such a system is decreased, the particles “condense” into clusters. Each cluster is formed by the particles (data entries, sequences) with the highest mutual homology. Colors and Shapes. In the “Colors and Shapes” version of SequenceWorld, we selected appropriate shape and color coding for objects representing database entries. To keep the representation consistent, the design was based on annotation, with shape and color being reserved for the function of the corresponding (best homologous) SwissProt [13] entry and its organismal origin, respectively. Such design decisions, as well as concrete implementation, are not unique to this project: for another database (or research task with the same database), similar choices could be made according to individual requirements. A screen shot of “Colors and Shapes” is shown in Figure 1. Navigation and search. A user navigates in SequenceWorld via a VRML viewer toolbar. The user can ascend and descend, thus varying the level of detail in the field of view; the user can also turn right and left, and go backward and forward, to inspect regions of interest. A
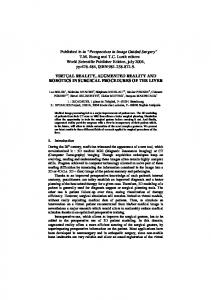
Fig. 1. A screen shot of “Colors and Shapes” viewer tool allows a user to jump directly to a predefined viewpoint, by choosing the target viewpoint from a dropdown menu. This feature was used in a simple search engine for SequenceWorld. Search requests can be submitted either by sequence name or by keyword. A search by sequence name creates a viewpoint (listed on a pull-down menu) for a searched sequence, which the user can access via SequenceWorld controls. A keyword search presents the database entries, annotations of which contain a given word or a phrase, marked by white rings on appropriate virtual objects. A keyword search also creates up to 50 viewpoints for sequences matching the search criterion. Using transparency and the third dimension. In a close-up view, a homologies stem appears above each shape within a certain spatial range. The homologies stem represents a set of up to 10 closest homologies from SwissProt DB. Each homology is represented by a section of the stem. The longer and more opaque is the section, the higher is the homology, calculated as a ratio of the SwissProt DB BLAST score and the sequence represented by the object under the stem, divided by the sequence's selfscore. The sections are arranged by descending homology, i.e., the lowest homology is shown in the lowest section of the stem. Clicking on a section will invoke a hyperlink to SwissProt DB with a description of this homology. More transparency – Fading Annotations. Another version of SequenceWorld is called “Fading Annotations “ (See Figure 2). It is based on the "Colors and Shapes" approach and data structures, and it represents a visual automatic annotation system. The main idea is to use transparency coding to assess the measure of confidence in automatically obtained annotations. The annotations are taken from the best homologue in the SwissProt database.
For each EST sequence, j, credibility factor, σ j is calculated as
σj =
BLAST _ SCORE ( j , λ )
BLAST _ SCORE ( j , j )BLAST _ SCORE (λ , λ )
where λ is the best homologue from SwissProt. The values of σ j are between 0 and 1: 0 represents a situation in which no automatic annotation is available; 1 represents a 100% coincidence in sequences, and hence in annotations. Each database object in the landscape is now represented by a combination of two shapes: a white ball and a colored cube. The cube's transparency corresponds to the value of σj for the sequence it represents. Thus, for σj close to 0 (poor annotation credibility), the object is shown as a white sphere. If annotation credibility is relatively high, a colored cube begins to appear, becoming more opaque as confidence grows. This visual assessment of annotation credibility is surprisingly sensitive, and one can test it by clicking on a shape to see the credibility factor.
Fig. 2. A screen shot of “Fading Annotations”
4. Conclusions It is difficult to appreciate the features of SequenceWorld without navigating in the prototype. At first glance, the concept seems rather unusual. However, when one becomes accustomed to the navigation controls, and learns color and shape codings, the informational journey becomes quite interesting. We shall attempt to summarize the advantages of this novel genetic data representation:
Richness of information. SequenceWorld is very rich in information, as is immediately apparent, relative to a traditional "read and reason" paradigm. For example, upon seeing a red cube in the prototype demonstration, one easily associates it with a certain enzyme from Arabidopsis thaliana - merely because of geometrical form. Tall stems represent well-defined sequences, while sequences with short stems hint at further work needed for proper annotation. Furthermore, SequenceWorld gives one an opportunity to perceive the GDB as a whole, and when navigating it, to maintain a view at an appropriate level of detail. New knowledge. Paradoxically, SequenceWorld creates new knowledge. The cluster structure would require significant effort to perceive by normal browsing methods. In principle, one could diligently study mutual BLAST scores of different sequences, and reach a conclusion that a particular set of sequences belongs to the same "family." However, for N sequences, it would take approximately N2/2 operations to identify such clustering. In SequenceWorld, one glance at the landscape conveys a sense of this structure in an efficient, visual style. Objectivity. SequenceWorld is objective. Once color and shape codings are determined, and a procedure is chosen for defining the "semantic proximity" of entries (i.e., an algorithm for assigning a real number to each sequences pair), further spatial ordering is done algorithmically; the researcher need only wait to view the result. The exact positioning of each object is not preserved in a MonteCarlo-based procedure; the overall features of clusterization, however are as well defined as in computational statistical physics, which models critical phenomena such as liquid condensation or magnetic phase transitions. Flexibility in clustering algorithms. We based our proximity algorithm on the traditional BLAST search program. However, with the advent of new and more powerful homology-seeking techniques, simple BLAST search could easily be replaced by a more up-to-date technique, without requiring dramatic changes to our general approach. By employing several definitions of the “semantic proximity” of database entries, one would have the opportunity to inspect different versions of SequenceWorld, each having its own clusterization pattern. Aesthetics and serendipity. SequenceWorld, while a fully functional database, also has an aesthetic quality, which could enrich analysis work relative to traditional methods. The new technique provides a holistic view, which at the same time offers the detailed views as needed. At this stage, it is difficult to predict the research utility of SequenceWorld and similar concepts. Nevertheless, they may prove effective for answering traditional questions posed to GDBs, such as ascribing annotations; the techniques may also prove effective for new, serendipitous tasks arising with the advent of systemic studies of full organismal genomes.
In conclusion, SequenceWorld offers a new and promising way to look at a genetics database. The new technique provides a holistic view, which at the same time allows opportunities to inspect detail as necessary. SequenceWorld may be used for performing traditional tasks; but it is hoped that the visual representation of genetics data may lead to new tasks and new ways of working, which grow out of acquiring knowledge via direct visual perception.
5. References [1] S. F. Altschul, M. S. Boguski, W. Gish, J.C. Wootton, "Issues in searching molecular sequence databases", Nat Genet 6, p. 119 (1994) [2] M. S. Boguski, "The Turning Point in Genome Research", Trends in Biochemical Sciences 20, p.295 (1995) [3] D. Modjeska, Technical Report of the Computer Science Research Institute of the University of Toronto, Toronto: University of Toronto (1997) [4] C. Chen, Information Visualisation and Virtual Environments, Springer, London (1999)
[5] J. Waterworth, in 3D on the Internet: Information, Images and Interaction (eds Earnshaw, R. & Vince, J.) p. 97, Academic Press, New York (1996) [6] J. Waterworth, "Creativity and Sensation: The case for 'Synaesthetic Media", Leonardo 30, p.327 (1997) [7] J. Waterworth, “A Pattern of Islands: Exploring Public Information Space in a Private Vehicle”in Multimedia, Hypermedia and Virtual Reality (eds Brusilovsky, P, Kommers, P and Streitz, N), Springer Verlag Lecture Notes in Computer Science (1996) [8] D. Modjeska, "Parallel Worlds: Spatial and Textual Representations of Information Structure", in Workshop on Personalised and Social Navigation in Information Space, Swedish Institute of Computer Science, Stockholm (1998) [9] F.A. Yates, The Art of Memory, Routledge and Kegan Paul, London (1984) [10] F. Sterky et al, ”Gene discovery in the wood-forming tissue of poplar: Analysis of 5,692 expressed sequence tags”, Proc. Natl. Acad. Sci. USA 95, pp.13330-13335 (1998) [11] E. Aarts, J. Korst, Simulated Annealing and Boltzmann Machines, eds Graham, R.L., Lenstra, J.K. and Tarjan R.E., John Wiley & Sons (1990) [12] S.F. Altschul, W. Gish, W. Miller, E. W. Myers, D.J. Lipman, "Basic local alignment search tool", J Mol Biol 215, p. 403 (1990) [13] SwissProt Database WWW Gateway, http://www.expasy.ch