Sequential Monte Carlo scheme for Bayesian estimation in the presence of data outliers ...... 23 C. Musso, N. Oudjane, and F. LeGland, in Sequential Monte.
PHYSICAL REVIEW E 75, 056705 共2007兲
Sequential Monte Carlo scheme for Bayesian estimation in the presence of data outliers 1
Liang Huang1 and Ying-Cheng Lai1,2
Department of Electrical Engineering, Arizona State University, Tempe, Arizona 85287, USA Department of Physics and Astronomy, Arizona State University, Tempe, Arizona 85287, USA 共Received 25 September 2006; revised manuscript received 16 February 2007; published 21 May 2007兲 2
Bayesian inference has been used widely in physics, biology, and engineering for a variety of experiment- or observation-based estimation problems. Sequential Monte Carlo simulations are effective for realizing Bayesian estimations when the system and observational processes are nonlinear. In realistic applications, large disturbances in the observation, or outliers, may be present. We develop a theory and practical strategy to suppress the effect of outliers in the experimental observation and provide numerical support. DOI: 10.1103/PhysRevE.75.056705
PACS number共s兲: 02.70.Uu, 05.40.Ca, 05.45.Tp
I. INTRODUCTION
The problem of estimating the time-varying state of a system based on experimental measurements or observations finds many applications in physics, biology, and engineering. Examples include quantum-state reconstruction and purity estimation 关1,2兴, noise reduction and state reconstruction in chaotic dynamical systems 关3,4兴, estimation of bounds on isocurvature perturbations in the Universe and on cosmic strings from cosmic microwave background and large-scale structure data 关5,6兴, gravitational-wave signal analysis 关7,8兴, macromolecular structure determination 关9,10兴, prediction of protein-protein interactions from genomic data 关11兴, tracking and positioning problems 关12兴, etc. In general, a system model that evolves the state vector 共x兲 in time is needed, so is an observational model that relates an observation vector 共y兲 to the state vector. In any realistic application both noise and model uncertainties exist, rendering necessary a probabilistic treatment of the estimation problem. That is, one can evolve x according to the system model and make corrections to or update x based on the available y. The quantity of interest is the posterior probability density function 共PDF兲 p共x 兩 y兲, given all available observations y. The standard approach to addressing this problem is Bayesian inference 关13兴, which leads to the classical Kalman filter when both the system and the observational models are linear. For nonlinear problems, a viable approach is sequential Monte Carlo simulation 共or particle filter兲 关14–16兴, which uses a set of random samples to approximate the posterior PDF p共x 兩 y兲. The approximated PDF evolves and is corrected by the observation based on the Bayes rule. If the number of samples is sufficiently large, the approximation approaches the optimal Bayesian estimate. Due to the constant improvement of modern computing technology, the sequential Monte Carlo approach has begun to find significant applications in science and engineering 关15–17兴. A fundamental question in sequential Monte Carlo simulations is how the precision of the estimated state vector depends on noise in the system and in the observation. Another issue of significant practical interest is how to deal with occasional but large disturbances, or outliers, in the observation. The aim of this paper is to address these two related problems. In particular, we shall derive and verify a selfconsistent equation that relates the covariance matrix of the 1539-3755/2007/75共5兲/056705共6兲
samples, which determines the precision of the state estimate, to the covariance matrices of the system noise and of the observational noise. We then propose a robust sequential Monte Carlo scheme to overcome the effect of outliers. In this regard, a previous approach includes using a heavytailed error distribution to improve the state-space models so that they react quite flexibly to changes in points or edges, but still provide smooth fits in other regions 关18兴. Leavek-out diagnostics is used to detect a series of consecutive outliers for a linear state-space model 关19兴. It uses all residual observations in the time span to check whether a series of consecutive observations are jointly outlying, and thus it is actually “off line.” Our idea is to detect the outliers from the previous knowledge about the system and then to eliminate them in the sequential Monte Carlo implementation. Simulations using a precise positioning problem demonstrate the power of our scheme. We expect our results to have significant impact on problems where the underlying system and/or experimental observations are subject to outliers. For example, the observation of a star or a galaxy may be corrupted by the drastic activity of another celestial body in a short period. In biological physics, macromolecular structure is inferred indirectly from various measurements—e.g., nuclear magnetic resonance spectra, x-ray reflections, or homology-derived restraints—which can easily contain outliers 关9兴. In global positioning system- 共GPS-兲 based precise positioning problems, GPS signals may be disturbed by sudden and large jamming. In Sec. II, we outline the basic steps of the sequential Monte Carlo method. A self-consistent equation governing the dependence of the estimation error on noise is derived in Sec. III. Our robust sequential Monte Carlo scheme for mitigating the effect of measurement or observational outliers is presented in Sec. IV. Numerical support for the self-consistent equation and for our robust scheme is provided in Sec. V. Concluding remarks are presented in Sec. VI. II. SEQUENTIAL MONTE CARLO METHOD
Let y共0 : t兲 = 兵y共t⬘兲 , t⬘ = t0共=0兲 , t1 , t2 , . . . , tk共=t兲其 be the observations from time 0 to time t, which are not necessarily equidistant in time. We seek to obtain the posterior PDF p关x共t兲 兩 y共0 : t兲兴. The state and observational equations are
056705-1
x共t兲 = f关x共tk−1兲, v共tk−1兲兴,
共1兲
©2007 The American Physical Society
PHYSICAL REVIEW E 75, 056705 共2007兲
LIANG HUANG AND YING-CHENG LAI
y共t兲 = g关x共t兲,e共t兲兴.
共2兲
Equation 共1兲 describes the evolution of the state, and Eq. 共2兲 maps the state to the observational vector; f and g can be nonlinear functions. The processes v共t兲 and e共t兲 represent random fluctuations 共e.g., noise, uncertainties, outliers, etc.兲 in the system and in the observation, respectively. Often, in an application the distribution of the initial state can be obtained by considering the specific physics involved. It is thus reasonable to assume that this distribution be available. The PDF p关x共t兲 兩 y共0 : t兲兴 can then be obtained recursively by prediction through the dynamical equation 共1兲 and likelihood correction through the observational equation 共2兲. In particular, given the PDF p关x共tk−1兲 兩 y共0 : tk−1兲兴 at time tk−1, the prediction step uses the dynamic equation 共1兲 to obtain the prior PDF of the state at time t via the Chapman-Kolmogorov equation p关x共t兲兩y共0:tk−1兲兴 =
冕
共3兲
where p关x共t兲 兩 x共tk−1兲 , y共0 : tk−1兲兴 = p关x共t兲 兩 x共tk−1兲兴 is used. At time t, a new measurement y共t兲 becomes available, which can be used to correct the prior PDF via the Bayes rule
f共x兲p关x兩y共0:t兲兴dx = 兺 wi共t兲f关xi共t兲兴. i
The weights are chosen using the principle of importance sampling 关22兴. In particular, given an arbitrary PDF p共x兲, it may be difficult to draw samples. Suppose for an alternative PDF q共x兲 samples can be drawn relatively easily. Letting xi ⬃ q共x兲 共i = 1 , . . . , N兲 be samples drawn from some q共·兲, the importance density, we obtain the following weighted approximation: N
p共x兲 ⯝ 兺 wi␦共x − xi兲, i=1
where wi ⬀ p共xi兲 / q共xi兲 is the normalized weight of the ith sample. Now consider the joint probability p关x共0 : t兲 兩 y共0 : t兲兴. In the case of independent noise samples, we can write
p关y共t兲兩x共t兲兴p关x共t兲兩y共0:tk−1兲兴 , p关y共t兲兩y共0:tk−1兲兴
冕
p关x共0:t兲兩y共0:t兲兴 ⬀ p关x共0兲兩y共0兲兴 兿 p关y共t j兲兩x共t j兲兴p关x共t j兲兩x共t j−1兲兴. j=1
Thus p关x共0:t兲兩y共0:t兲兴 = p关x共t兲,x共0:tk−1兲兩y共t兲,y共0:tk−1兲兴 =
共4兲
where p关y共t兲兩y共0:tk−1兲兴 =
冕
k
dx共tk−1兲p关x共t兲兩x共tk−1兲兴p关x共tk−1兲兩y共0:tk−1兲兴,
p关x共t兲兩y共0:t兲兴 =
具f关x共t兲兴典 =
p关y共t兲兩x共t兲兴p关x共t兲兩y共0:tk−1兲兴dx
depends on the likelihood function p关y共t兲 兩 x共t兲兴. The recurrence relations 共3兲 and 共4兲 form the basis for the optimal Bayesian solution. For Gaussian noise, when f and g are linear functions, the recurrence relation can be solved analytically, which is the classical Kalman filter. For nonlinear functions f and g, a linearization technique is viable which leads to the so-called extended Kalman filter 关20兴. An unscented Kalman filter deliberately selects a set of points and propagates them through nonlinearity to estimate the Gaussian approximation 关21兴, while for more general cases, the approach of sequential Monte Carlo simulations are desirable 关14–17兴. N denote a random measure that characLet 兵xi共t兲 , wi共t兲其i=1 terizes the posterior PDF p关x共t兲 兩 y共0 : t兲兴, where 兵xi共t兲 , i = 1 , . . . , N其 is a set of support points with associated weights 兵wi共t兲 , i = 1 , . . . , N其. The weights are normalized that 兺iwi共t兲 = 1. The posterior PDF can be approximated as
⫻p关x共0:tk−1兲兩y共0:tk−1兲兴. Assume that the posterior distribution p关x共0 : tk−1兲 兩 y共0 : tk−1兲兴 N is approximated by 兵xi共0 : tk−1兲 , wi共tk−1兲其i=1 ; given a new observation y共t兲, the objective is to obtain an approximation N for p关x共0 : t兲 兩 y共0 : t兲兴, such that the estima兵xi共0 : t兲 , wi共t兲其i=1 tion of quantities of interest at time t can be calculated. The sequential Monte Carlo scheme is to generate a sample xi共t兲 and append it to xi共0 : tk−1兲 to form xi共0 : t兲, and update the weight wi共tk−1兲 to wi共t兲. If the importance function q关x共0 : t兲 兩 y共0 : t兲兴 can be factorized as q关x共0:t兲兩y共0:t兲兴 = q关x共t兲兩x共0:tk−1兲,y共0:t兲兴q关x共0:tk−1兲兩y共0:tk−1兲兴, and xi共t兲 is sampled from q关x共t兲 兩 xi共0 : tk−1兲 , y共0 : t兲兴, the weight of the trajectory xi共0 : t兲 is wi共t兲 ⬀ =
p关xi共0:t兲兩y共0:t兲兴 q关xi共0:t兲兩y共0:t兲兴 p关y共t兲兩xi共t兲兴p关xi共t兲兩xi共tk−1兲兴 q关xi共t兲兩xi共0:tk−1兲,y共0:t兲兴p关y共t兲兩y共0:tk−1兲兴 ⫻
N
p关x共t兲兩y共0:t兲兴 ⯝ 兺 wi共t兲␦„x共t兲 − xi共t兲…,
⬀
i=1
where ␦共x兲 is the Dirac delta function such that ␦共x兲 = 0 if x ⫽ 0 and 兰xx2␦共x兲dx = 1 if 共x1 , x2兲 contains 0. The average of 1 an arbitrary function f共x兲 can be simplified as
p关y共t兲兩x共t兲兴p关x共t兲兩x共tk−1兲兴 p关y共t兲兩y共0:tk−1兲兴
p关xi共0:tk−1兲兩y共0:tk−1兲兴 q关xi共0:tk−1兲兩y共0:tk−1兲兴
p关y共t兲兩xi共t兲兴p关xi共t兲兩xi共tk−1兲兴 wi共tk−1兲, q关xi共t兲兩xi共0:tk−1兲,y共0:t兲兴
where p关y共t兲 兩 y共0 : tk−1兲兴 is omitted since it is common to all samples. A convenient choice for the importance density is the following prior importance density 关16,17兴:
056705-2
PHYSICAL REVIEW E 75, 056705 共2007兲
SEQUENTIAL MONTE CARLO SCHEME FOR BAYESIAN…
q关x共t兲 兩 xi共0 : tk−1兲 , y共0 : t兲兴 = p关x共t兲 兩 xi共tk−1兲兴, with which the weight updating equation becomes wi共t兲 ⬀ wi共tk−1兲p关y共t兲兩xi共t兲兴,
共5兲
and the posterior filtered density p关x共t兲 兩 y共0 : t兲兴 can be approximated as N
p关x共t兲兩y共0:t兲兴 ⯝ 兺 wi共t兲␦关x共t兲 − xi共t兲兴.
共6兲
i=1
From a numerical point of view, the above analysis can be implemented as follows. First generate N samples 兵xi共0兲 兩 i = 1 , . . . , N其 from the distribution of y共0兲 as given in Eq. 共2兲. Each sample has a weight of 1 / N. Each sample xi共0兲 then evolves according to the dynamical equation 共1兲 by considering the noise v to get the value at time t1—e.g., xi共t1兲—and the weights are updated via Eq. 共5兲. The estimation of the N wi共t1兲xi共t1兲. During the evolustate at time t1 is 具x共t1兲典 = 兺i=1 tion, it may occur that there are disproportionally fewer samples about xi than determined by the weight wi. To avoid this, a sample importance resampling procedure 关16兴 can be applied. That is, we can generate a new set of samples N N from the samples 兵xi , wi其i=1 with probability being 兵x*i , w*i 其i=1 their weights; i.e., each time, the probability to draw sample xi is its weight wi 共note that the weights are normalized so that 兺iwi = 1兲. The weights w*i for the new samples are then set as 1 / N. As a result of this resampling procedure, the weight wi of a sample is represented by the number of duplications of the sample, and thus the statistics of the samples—e.g., mean value, covariance, etc.—are unchanged in the large-N limit. The resampling step automatically concentrates the samples in the regions of interest and effectively discards samples with low weight. However, this may result in overlaps for some samples. For example, if one sample has a very large weight, after resampling, it may have many duplications, which leads to a degeneration problem. To overcome this difficulty, a regularization process can be applied: A small random vector is added to each sample as a perturbation: xi ← x*i + hD⑀i, where ⑀i follows the standard normal distribution and D is such that DDT = S 共DT is the transpose of D兲. The matrix S is the empirical covariance matrix of the samples before resampling, and the quantity h is a regularization parameter 关16,23兴. The samples again propagate via the dynamical equation 共1兲 to yield the values at the next time step. The process continues until a desired time span for estimation is reached.
III. NOISE DEPENDENCE OF THE ESTIMATION ERROR
When noise of the system is stationary—i.e., the covariance matrices ⌺v and ⌺e for the process noises v and e in Eqs. 共1兲 and 共2兲 are constant in time—the samples can evolve into a “steady” state and their covariance matrix can be obtained, which is proportional to the estimation error. Suppose that at time tk−1 the covariance matrix of the samples is ⌺x共tk−1兲, which is unknown. Since the dynamical equation f is known, after propagating through Eq. 共1兲, the covariance matrix ⌺ f of the samples at time tk can be ex-
pressed in terms of ⌺x共tk−1兲 and ⌺v, which reads ⌺ f (⌺x共tk−1兲 , ⌺v). To make use of the correction step 关Eq. 共4兲兴, we solve x from Eq. 共2兲: x = g−1共y , e兲. Therefore, for a given observation y共t兲, the covariance matrix for x共t兲, from the observational point of view, can be obtained as ⌺s关y共t兲 , ⌺e兴. Usually, ⌺s depends mainly on ⌺e and has little dependence on y共t兲; thus, ⌺s is merely constant in time and can be calculated using the initial observation y共0兲. The correction procedure is equivalent to a modulation posted by a distribution with covariance matrix ⌺s on a distribution with covariance matrix ⌺ f . Suppose both distributions are Gaussian; the resulting distribution is also Gaussian, but with covariance ma−1 −1 trix 兵⌺−1 f + ⌺s 其 . The resampling step does not change the covariance matrix, and the regularization step simply adds a −1 −1 2 factor of 1 + h2. Thus we have ⌺x共t兲 = 兵关⌺−1 f + ⌺s 兴其 共1 + h 兲. In the steady state, we have ⌺x共t兲 ⯝ ⌺x共tk−1兲, which leads to the following self-consistent equation: −1 −1 2 ⌺−1 f + ⌺s = 共1 + h 兲⌺x ,
共7兲
which determines the covariance matrix of the samples, or the posterior PDF p关x共t兲 兩 y共0 : t兲兴, for given dynamical and observational noise levels. Note that ⌺ f is a function of ⌺x and ⌺v. For certain cases, ⌺ f can be expressed explicitly in terms of ⌺x and ⌺v, which can be used to further simplify the above equation. For example, for linear dynamical systems f = 冑ax + 冑bv and ⌺ f = a⌺x + b⌺v, Eq. 共7兲 becomes 共a⌺x + b⌺v兲−1 + ⌺s−1 = 共1 + h2兲⌺−1 x .
共8兲
From Eq. 共7兲, the dependence of ⌺x on ⌺v and ⌺e can be obtained, which can be used to find out the “leading term” of the noise source—i.e., which noise term has the most influence on ⌺x and therefore on the estimation precision. This information can be useful for improving the estimation precision by suppressing the leading noise source. In practice, due to the nonlinearity of the function g, an explicit expression of ⌺s is not always possible and a Monte Carlo scheme is viable: i.e., draw a set of samples 兵ei其 from the distribution of e 关Eq. 共2兲兴; for each sample ei, calculate xi as xi = g−1(y共0兲 , ei), then ⌺s can be approximated by the covariance matrix of the samples 兵xi其. IV. ROBUST SEQUENTIAL MONTE CARLO SCHEME FOR MITIGATING OUTLIERS
The above scheme of sequential Monte Carlo simulations works well for stationary noise. In the presence of nonstationary disturbances—e.g., outliers—the weight-updating scheme needs to be improved. To be concrete, we treat outliers in the observation, which can lead to a larger covariance matrix ⌺s. This will cause a larger estimation error 关Eq. 共7兲兴. Thus, if the outliers can be detected and then discarded, the elements of the covariance matrix of the observations can be reduced. Our idea is to first calculate the empirical distribution of the Monte Carlo samples and then compare the observation with this distribution. If the prediction of the observation is close to the center of the samples, the observation is likely to be true and it should be accounted for in the estimation of the state. However, if the prediction de-
056705-3
PHYSICAL REVIEW E 75, 056705 共2007兲
LIANG HUANG AND YING-CHENG LAI
˜ i共t兲 wi共t兲 = 共1 − ␣兲wi共tk−1兲 + ␣w
˜ j共t兲. w
2 1
共9兲
j
Generally, the optimal value of ␣ depends on the distribution of the samples and on the prediction of the observation in a sophisticated way. Our strategy for choosing ␣ is the following. After propagating the samples through the dynamical equation, we calculate ⌺x. The covariance matrix ⌺v of the dynamical noise and ⌺e of the observational noise are assumed to be known. Define  ⬅ 冑Tr共⌺v兲 / Tr共⌺e兲 and ⌬x ⬅ 共xLS − 具x典兲 / 冑Tr共⌺x兲, where 具x典 is the average of the samples and xLS is the least-squares estimation of the state, which minimizes the square error of the observations 共this is the case when the number of observations is more than the number of unknowns兲 关25兴. We propose the following criterion for choosing ␣:
␣=
冦
1, 共1 − 兲

冉
c0 c1 − 储⌬x储 储⌬x储 c1 − c0
冉
c1 c2 − 储⌬x储 储⌬x储 c2 − c1
0,
冊
冊
储⌬x储 艋 c0 , 2
+  , c0 ⬍ 储⌬x储 艋 c1 ,
2
,
c1 ⬍ 储⌬x储 艋 c2 , c2 ⬍ 储⌬x储,
冧
where c0 ⬃ 1, c1 ⬃ 3.5, and c2 ⬃ 7, and the optimal values can vary for different situations. Note that 储⌬x储 is the distance between the estimation xLS obtained from the observations and the mean value of the samples 具x典, normalized by the “standard deviation.” If 储⌬x 储 ⬍ 1, the estimation is within the range of the standard deviation and is reliable. If 储⌬x储 is in the range of one standard deviation to three standard deviations, the observation is less reliable. Since there is noise in the dynamics, the samples may themselves contain some error. The quantity  is introduced to account for such uncertainties. If 储⌬x储 is even larger, the weight for the observation decreases, and at a certain point—say, beyond seven standard deviations—the observation is deemed as outliers and the weight ␣ is set to zero. V. NUMERICAL SUPPORT
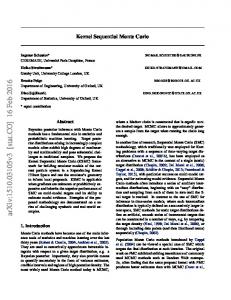
To substantiate our ideas, we consider a synthetic twodimensional positioning problem of moving object—say, a car—by using GPS observations 共see Fig. 1兲. The origin is the center of the Earth, and the car is originally located at the surface of the Earth—共0 , Re兲 in an Earth centered coordinate, where Re = 6357 km is the radius of the Earth—which is assumed to be unknown. The velocity can be read from the velocimeter and has a constant true value of 70 mph, or 31.3 m / s. The velocity is assumed to have a Gaussian measurement error with covariance matrix ⌺v = 2v diag关1 1兴, where v is regarded as an adjustable parameter. The direction of the velocity changes in time. The car is equipped with
(a) 3 Satellites
4
1
10000 8000
Car
0
2
Earth
6000
−1
4000
−2
2000 −2
−1
(b)
12000
2
x (m)
冒兺
10
x 10
x2 (m)
viates from the center of the samples, it is less reliable and should therefore be counted less 关24兴. Quantitatively, it is convenient to introduce a contribution factor ␣ to character˜ i共t兲 = wi共tk−1兲p关y共t兲 兩 xi共t兲兴. We modify Eq. ize this effect. Let w 共5兲 as
0 1 x1 (m)
0
2
0
2000
10
x 10
4000 x (m)
6000
8000
1
FIG. 1. 共Color online兲 Setup of the numerical problem. 共a兲 The tracks of the satellites and the car for the simulation time 共500 s兲. The satellites move counterclockwise. 共b兲 The track of the car, where the origin is shifted to the original position of the car.
a GPS receiver. Four visible satellites 共ns = 4兲 are located at the altitude of 20 200 km above the Earth’s surface with initial angles / 5, 7 / 24, 4 / 7, and 2 / 3 共in Earth-centered coordinates兲. The satellites orbit the Earth at a period of 12 h. The receiver on the car can receive GPS signals from each satellite at the frequency of 1 Hz 共⌬t = tk − tk−1 = 1 s兲, from which the distances from the satellites to the car, Pk 共pseudoranges兲, can be measured. Assuming that the receiver has no clock offset and the satellites are not correlated, we can write the covariance matrix of the pseudoranges as ⌺ p = 2pIns, where Ins is the identity matrix of order ns. A motion model which is linear in the state dynamics and nonlinear in the measurements is 关12兴 x共t兲 = x共tk−1兲 + v共tk−1兲⌬t, y共t兲 = g关x共t兲兴 + e p共t兲, where y is the pseudorange measurements y = 关P1 P2 ¯ Pns兴T. The measurement function is g共x兲 = 关R1R2 ¯ Rns兴T, where R j = 储X j − x储 is the Euclidean distance from the car’s position x to the jth satellite X j and e p is the pseudorange observational noise. The covariance matrices for v and e p are ⌺v and ⌺ p, respectively. Figure 2 shows the dependence of ⌺x on ⌺v when ⌺s is given, which can be obtained numerically from the distribution of the pseudoranges 共⌺ p兲. The symbols are obtained from direct simulations; the curves are from our theory Eq. 共8兲. They agree quite well. To test the robustness of our Monte Carlo strategy, we add 15 random outliers of 30 m to the measured pseudoranges of the second satellite in a time span of 500 s with measurement frequency 1Hz. The result of the position estimation is shown in Fig. 3. Three cases are presented for comparison. Figure 3共a兲 shows the prediction error of x1 if we only know the initial position and the measured velocity, with a standard deviation v = 0.5. There is a systematic drift of errors. Figure 3共b兲 shows the prediction error of the least-squares method 关25兴 if only the measured GPS pseudoranges are available 共standard deviation p = 2.5 for each satellite兲. Figure 3共c兲 is the estimation error from our proposed Monte Carlo strategy, which apparently contains no systematic error and exhibits much smaller statistical errors.
056705-4
PHYSICAL REVIEW E 75, 056705 共2007兲
SEQUENTIAL MONTE CARLO SCHEME FOR BAYESIAN… (a) Error (m)
1.6 1.4
σx
1.2
0 −10 −20
1
0
σ of x
Error (m)
1
σ of x (elevation) x
0.4 0
0.5
1
1.5 σ
2
2
2.5
3
v
FIG. 2. 共Color online兲 For the two-dimensional positioning problem, dependence of the standard deviations of the samples x for the two coordinates on the standard deviation of the velocity v. The standard deviation of the pseudoranges is p = 2.5, the number of samples is N = 1000, and h = 0.3. Symbols are obtained from numeric simulations, where each data point is the average of 10 runs, and 100 different time steps for each run are used. The curves are from our theoretical prediction, Eq. 共8兲.
Next, we study the cases with non-Gaussian noise in the GPS pseudorange observations. This might be the case when the car is moving in a city or in the forests, where the GPS signal may be blocked by buildings or trees, causing difficulty in distinguishing multipath signals from the original signal, which may introduce systematic biases 关26兴. Furthermore, because of the complexity of the environment, at certain moments the original signal may be unavailable. We assume that the distribution of noise in the pseudoranges consists of two Gaussians with different mean values. The probability density function is
Error (m)
(a) 0 −10 0
100
200
Error (m)
400
500
300
400
500
300
400
500
0 −10 0
100
200 Time (s)
(c) Error (m)
300 Time (s)
(b)
−20
0 −10 −20
0
200 300 Time (s)
400
500
100
200 300 Time (s)
400
500
100
200 300 Time (s)
400
500
100
200 Time (s)
FIG. 3. 共Color online兲 A comparison of the errors of the first coordinate x1 of the position prediction by velocity information only 共a兲, by least squares estimation of GPS distances with outliers only 共b兲, and by our strategy 共c兲. The parameter values used in the simulation are v = 0.5, p = 2.5, c0 = 0.7, c1 = 4.2, c2 = 7, N = 1000, and h = 0.3.
0 −10 −20
0
(c) Error (m)
x
0.6
−20
100
(b)
0.8
0 −10 −20
0
FIG. 4. 共Color online兲 A comparison of the errors of the second coordinate x2 of the position prediction only by least squares estimation of GPS distances with outliers 共a兲, by regularized sequential Monte Carlo simulation without the robust strategy 共b兲, and by our strategy 共c兲. The parameter values used in the simulation are v = 1, p = 2.5, c0 = 1.5, c1 = 4.2, c2 = 8, N = 1000, and h = 0.3.
f共x兲 = b
1
冑21
e−x
2/22 1
+ 共1 − b兲
1
冑22
e−共x − x0兲
2/22 2
, 共10兲
where b is a weight factor and we take b = 0.6 in our simulation. Other parameters are 1 = p = 2.5, 2 = 1, and x0 = 8. Again, to test the robustness of our algorithm, we add outliers to the GPS pseudorange observations: 20 outliers of 40 m are added to satellite 2 randomly. Figure 4 compares the errors in position estimation by three methods: the leastsquares estimation from the GPS pseudoranges with outliers 共a兲, the estimation by the regularized sequential Monte Carlo scheme 共b兲, and the estimation by our robust sequential Monte Carlo scheme 共c兲. The least-squares estimation from the pseudoranges has large errors and can have systematic deviations 共the average of the error is not zero兲, as shown in Fig. 4共a兲. The regularized sequential Monte Carlo scheme can remove these systematic deviations caused by the nonGaussian distribution but is affected by the outliers, which can be seen from the spikes in Fig. 4共b兲. Our robust sequential Monte Carlo scheme can recover from both the systematic deviations and the outliers 关Fig. 4共c兲兴. In fact, the average absolute value of the errors can be 30% smaller. The current robust scheme deals with observational outliers. If there are dynamical outliers—e.g., the outliers appearing in v—the current scheme needs to be modified to cope with the problem. Observations after such an event will be needed to identify an outlier.
056705-5
LIANG HUANG AND YING-CHENG LAI
PHYSICAL REVIEW E 75, 056705 共2007兲
VI. CONCLUSIONS
merically. Sequential Monte Carlo simulations have begun to be used widely in various estimation problems in science and engineering. Our contribution provides a robust strategy for improving the estimation precision when experimental observations are nonstationary or even temporally interrupted.
In conclusion, we have obtained a self-consistent equation for the estimation precision of the Bayesian inference in terms of the dynamical noise and the observational noise levels. The equation may provide insights into designing improved sequential Monte Carlo simulations with higher precision. We have also proposed a strategy to deal with sudden, large disturbances that are inevitable in physical observations. The effectiveness of our method has been tested nu-
This work is supported by AFOSR under Grants Nos. FA9550-04-1-0115 and FA9550-06-1-0024.
关1兴 A. Silberfarb, P. S. Jessen, and I. H. Deutsch, Phys. Rev. Lett. 95, 030402 共2005兲. 关2兴 E. Bagan, M. A. Ballester, R. Muñoz-Tapia, and O. RomeroIsart, Phys. Rev. Lett. 95, 110504 共2005兲. 关3兴 J. P. M. Heald and J. Stark, Phys. Rev. Lett. 84, 2366 共2000兲. 关4兴 R. Meyer and N. Christensen, Phys. Rev. E 65, 016206 共2001兲. 关5兴 P. Crotty, J. García-Bellido, J. Lesgourgues, and A. Riazuelo, Phys. Rev. Lett. 91, 171301 共2003兲. 关6兴 M. Wyman, L. Pogosian, and I. Wasserman, Phys. Rev. D 72, 023513 共2005兲. 关7兴 N. Christensen and R. Meyer, Phys. Rev. D 64, 022001 共2001兲. 关8兴 N. J. Cornish and J. Crowder, Phys. Rev. D 72, 043005 共2005兲. 关9兴 W. Rieping, M. Habeck, and M. Nilges, Science 309, 303 共2005兲. 关10兴 V. Baldazzi, S. Cocco, E. Marinari, and R. Monasson, Phys. Rev. Lett. 96, 128102 共2006兲. 关11兴 R. Jansen et al., Science 302, 449 共2003兲. 关12兴 F. Gustafsson, F. Gunnarsson, N. Bergman, U. Forssell, J. Jansson, R. Karlsson, and P.-J. Nordlund, IEEE Trans. Signal Process. 50, 425 共2002兲. 关13兴 E. T. Jaynes, in Probability Theory: The Logic of Science, edited by G. L. Bretthorst 共Cambridge University Press, New York, 2003兲.
关14兴 W. Gilks, S. Richardson, and D. Spiegelhalter, Markov Chain Monte Carlo in Practice 共Chapman and Hall, London, 1996兲. 关15兴 Sequential Monte Carlo Methods in Practice, edited by A. Doucet, N. de Freitas, and N. Gordon 共Springer-Verlag, New York, 2001兲. 关16兴 S. Arulampalam, S. Maskell, N. Gordon, and T. Clapp, IEEE Trans. Signal Process. 50, 174 共2002兲. 关17兴 P. M. Djuric, J. H. Kotecha, J. Zhang, Y. Huang, T. Ghirmai, M. F. Bugallo, and J. Miguez, IEEE Signal Process. Mag. 20共3兲, 19 共2003兲. 关18兴 L. Fahrmeir and R. Künstler, Metrika 49, 173 共1999兲. 关19兴 T. Proietti, J. Time Ser. Anal. 24, 221 共2003兲. 关20兴 A. H. Jazwinsky, Stochastic Processes and Filtering Theory 共Academic Press, New York, 1970兲. 关21兴 E. A. Wan and R. Van der Merwe, in Kalman Filtering and Neural Networks 共Wiley, New York, 2001兲, Chap. 7. 关22兴 A. Doucet, S. Godsill, and C. Andrieu, Stat. Comput. 10, 197 共2000兲. 关23兴 C. Musso, N. Oudjane, and F. LeGland, in Sequential Monte Carlo Methods in Practice, edited by A. Doucet, N. de Freitas, and N. Gordon 共Springer, New York, 2001兲. 关24兴 Y. Yang, H. He, and G. Xu, J. Geod. 75, 109 共2001兲. 关25兴 G. Strang and K. Borre, Linear Algebra, Geodesy, and GPS 共Wellesley-Cambridge Press, Wellesley, MA, 1997兲. 关26兴 B. Hofmann-Wellenhof, H. Lichtenegger, and J. Collins, GPS: Theory and Practice 共Springer-Verlag, Wien, 2001兲.
ACKNOWLEDGMENT
056705-6