Segmenting visitors of cultural events by motivation: a sequential non-linear clustering analysis of Italian Christmas Market visitors
Juan Gabriel Brida, Marta Disegna and Linda Osti Competence Centre in Tourism Management and Tourism Economics (TOMTE) Free University of Bozen-Bolzano, School of Economics and Management via Sernesi 1, I-39100 Bolzano, Italy Email addresses:
[email protected];
[email protected];
[email protected] Note: Authors are listed in alphabetical order since they all have contributed equally to the work. Abstract: Considering the importance of market segmentation as a marketing tool to determine promotional policies, this paper aims, through an empirical application, to determine the optimal way to choose both the best cluster algorithm and the best cluster partition. For this purpose, an empirical study was conducted interviewing tourists who visited three different Christmas Markets in Northern Italy. The methodology is based on two clustering techniques in sequence: a Self-Organizing Map (SOM) followed by a clustering algorithm based on the Silhouette index. This analysis identified three cluster segments and demonstrated the suitability to the Silhouette index as it reduces biases due to subjective preferences of the researchers. In the discussion of the results, marketing and managerial implications are also highlighted. Keywords: Cultural Event, Motivation, Self-Organizing Map, Silhouette index, Segmentation, Authenticity. Acknowledgements: Our research was supported by the Autonomous Province of BolzanoBozen (Italy), project: “Tourism, growth, development and sustainability - The case of the South Tyrolean region” and the Free University of Bolzano project: “Cultural Authenticity of Tourism Events”.
1 Electronic copy available at: http://ssrn.com/abstract=1825371
1. Introduction
The management and marketing of events has been acknowledged as an area of extreme importance to academic researchers and event practitioners (Allen, O'Toole, Harris and McDonnell, 2008; Getz, 2008) and, in this context, it is necessary to develop a profile for attendees through market segmentation that can guide marketing and managerial decision making (Lee, Lee and Wicks, 2004). A review of the marketing literature indicates that there is no one correct way to segment a market (Kotler, Bowen and Makens, 2010; Dolnicar, 2008; Beane & Ennis, 1987). However, customer clustering is one of the most important techniques used to identify segments (Saarenvirta, 1998). Boone and Roehm (2002) point out that there are over 50 clustering methods that can be applied to deal with market segmentation problems, so marketing strategists often face the problem of selecting the most appropriate technique or methodology. When discussing the need for an in-depth knowledge of tourists' behaviour patterns and therefore the need to use clustering techniques, Bloom (2004) points out the necessity to overcome the limitations deriving from linear techniques; hence he proposes the application of non-linear techniques such as Neural Networks (NNs) algorithms. NNs have been used to segment markets in different fields including the tourist market. In tourism research Mazanec (1992) appears to be one of the first scholars to use NNs and he used a NN to conduct a market segmentation analysis of Austrian tourists in the “Euro-Sports Region”. Dolnicar (1997) used a further form of non-linear techniques -the Kohonen SelfOrganizing Map (Kohonen, 1984)- to identifying the characteristics of summer tourists visiting Austria. This last method was also used to, for example: identify strategic groups of UK hotels (Curry et al., 2001); segment senior travellers in Western Australia (Kim, Wei and Ruys, 2003); segment the international tourist market in Cape Town, South Africa (Bloom, 2005). According to Bloom (2004), non-linear techniques, and in particular the Kohonen SelfOrganizing Map (SOM), have overcome some of the limitations of the hierarchical clustering methods as they are more robust and are not significantly affected by missing data; they do not require any prior assumptions about the underlying distribution of the data; and they are appropriate also when the sample size is large. With respect the most popular non-hierarchical clustering methods, the k-means algorithm, the SOM do not require knowledge of the precise number of segments being targeted, i.e. the network assign an incoming signal to the segment having the nearest weight vector only if the distance falls within a predetermined limit,
2 Electronic copy available at: http://ssrn.com/abstract=1825371
otherwise a new segment is created (Venegopal and Baets, 1994). However, a fundamental question remains in terms of the best cluster algorithm to choose and the cluster partition to select. The primary aim of this study is to provide an answer to this crucial problem and to conduct a segmentation analysis through a sequential use of different clustering techniques and, in particular, the second stage of this analysis will use a non-subjective criterion to choose both the second cluster algorithm and the best cluster partition. In particular, in tourism research it is still common practice to carry out non-hierarchical clusters where the number of clusters is decided by the researcher based on practicality and subjective preference (Choi, 2011; Konu, Laukkanen and Komppula, 2010; Albalate and Bel, 2010; Pérez and Nadal, 2005) or the number of clusters is derived from a hierarchical cluster method (Claver-Cortés, Molina-Azorín and Pereira-Moliner, 2007; Bigné and Andreu, 2004; Chen and Hsu, 1999). Through the implementation of a sequential non-linear clustering analysis to tourists visiting three Christmas Market in the North-East of Italy we would like to contribute to tourism literature with an alternative and effective method to conduct cluster analyses. Taken a dataset of 1193 tourists we first conducted a SOM and then processed the SOM results with another clustering algorithm based on the Silhouette index (Rousseeuw, 1987) in order to provide reliable and non-subjective segments of Christmas Market visitors. These segments can be then used for the creation of management and marketing strategies to improve the event and attract more visitors. The paper is organized as follows. First we present the function and characteristics of SOM and the Silhouette index, we then apply the two algorithms to the data collected at three Italian Christmas Markets. The paper continues with the outcomes of the empirical results and finishes with a discussion of the results, including practical applications of the sequential analysis, limitations of the research and future perspectives.
2. Methodology The SOM algorithm is a feedforward NN, which produces a non-linear projection of the observed points from the input space to the output space (the map) of lower dimensions. In the input space the j-th observation is described by a p-dimensional vector, called input node; the output space consists of M nodes (or neurons) usually structured in a bi-dimensional grid with a hexagonal or rectangular lattice. Two vectors describe each node of the output space: a
3
p-dimensional vector called prototype, which represents all input nodes associated with it, and a q-dimensional vector (with q < p) ri of coordinates that identify its position on the map. Schematically the SOM procedure consists of the following five stages: 1) Initialization: the M prototype vectors are initialized (Kohonen, 1984). 2) Competition: each input node, xj, is compared with each prototypes, mi, to find the node of output, c(j), that is more close, in terms of distance, to xj. The distance measure typically used is the Euclidian distance. The winning node c(j), which is called Best-Matching Unit (BMU), is identified through the following rule:
{
}
(1)
c( j) = arg min x j # mi , j = 1,…,N 1"i"M
3) Cooperation: in this stage it is necessary to define a neighbourhood function that allows
!
to identify the output nodes close to the BMU, c(j), to be updating in the next step. The most widely used neighbourhood function in the literature, hc(j),i, is the Gaussian function: $ & rc( j ) " ri hc ( j ), i (k) = exp& " 2# 2 (k) %
2
' ) ) (
$k' where #(k) = #0 exp& ) % t1 (
(2)
where k =0,…,K is the iteration step, σ0 is the initial value of σ which represents the !
radius, or the width, of the neighbourhood and t1 is a temporal constant (typically equal to 1000). It is important to note that hc(j),i is a decreasing function of step k and so the area of neighbourhood shrinks over time, i.e. the radius decreases with increasing of k. 4) Updating: the prototypes of nodes close to the BMU, as well as the prototype of the winner itself, are updated according to the following rule:
[
mi (k +1) = mi (k) + " (k)hc ( j ), i (k) x j # mi (k)
]
$k' where " (k) = " 0exp& ) % t2 (
(3)
where α(k) is the learning rate factor, α0 is the initial value of α (usually set equal to 0.1) !
and t2 is a temporal constant (typically equal to 1000). The Batch version of the SOM algorithm (Kohonen, 1995) is computationally more efficient. In this version, the prototypes are updated according to all input nodes, simultaneously presented to the algorithm, related to him or linked to neighbour output nodes as follows:
4
N
"h * i
m (k +1) =
c(j),i
(k)x j
(4)
j=1 N
"h
c(j),i
(k)
j=1
In the batch algorithm, the learning rate α(k) is no longer needed. 5) Convergence and visualisation: stages (2), (3) and (4) are repeated until the algorithm
!
converges. The results of the SOM can be displayed using mainly two types of graph: the Umatrix and the component plane. The U-matrix is built on the bases of the distance matrix calculated between neighbourhood nodes on the whole output map. Within each output node are placed the input nodes for which it turned out to be the winner. Each U-matrix unit is assigned a colour that displays its distances from the other nodes. This allows, to some extent, a visual identification of how the observations can be naturally grouped based on their similarity, and therefore the definition of the clusters and their borders. The component plane is composed of as many maps as variables used in the SOM algorithm. Each map of the component plane is a share of the U-matrix that makes it possible to display the location for each variable and the modality held by each node of the map and, therefore, for each input observation. In addition, the maps of the component plane can be overlapped in order to reconstruct the original data matrix. Each node of a single map is assigned a colour that displays its modality for the particular variable observed. Comparing the colour gradient of the maps it is possible to discover some correlation patterns among the variables: similar colour areas on different maps indicate positive correlation. When working with micro data, most of the times the SOM algorithm cannot find an appropriate number of well defined clusters because there are too many groups of units with similar characteristics that form too many clusters that are not easy to interpret. Therefore, it is necessary to segment the SOM results again with a further cluster technique. To find the best clustering technique, between hierarchical and non-hierarchical, and to select the best cluster partition, i.e. the best number of clusters, we can use one of the existing internal validity measures (as suggested by Handl, Knowles and Kell, 2005). An internal validity measure takes a clustering and the underlying dataset as the input, and use information intrinsic to the data to assess the quality of the clustering. These measures can be grouped into three types on the basis of what they analysed of the cluster partitions: 1. Compactness. Validation measures of this type assessing cluster homogeneity or compactness, usually by looking at the intra-cluster variance;
5
2. Connectedness. Validation measures of this type assessing how well a given partitioning agrees with the concept of connectedness, i.e. to what observations are placed in the same cluster as their nearest neighbours in the data space; 3. Separation. Validation measures of this type quantify the degree of separation between clusters. The literature provides a number of different methods that combine measures of the above three types. In this respect, since compactness and separation demonstrate opposing trends (compactness increases with the number of clusters but separation decreases), linear and nonlinear combinations of these types of measure are popular. The most popular non-linear combinations are the Dunn Index (Dunn, 1974), the Davies-Bouldin Index (Davies and Bouldin, 1979) or the Silhouette index (Rousseeuw, 1987). In this study we have decided to assess the quality of classification through the Silhouette index because it seems to produce a reasonably conclusion under SOM also without discovering any clear cluster structure in the data (Handl, Knowles and Kell 2005). This measure lies in the interval [-1, 1], and should be maximized. In particular, wellclustered observations having values near 1 and poorly clustered observations having values near −1. The Silhouette index for the i-th observation of the k-th cluster is defined as:
s(i, k) =
bi,k ! ai,k max(bi,k , ai,k )
(5)
where ai,k is the average distance between i and the remaining (nk -1) observations of the kth cluster, while bi,k is the minimum average distance between i and all other observations to the nearest neighbouring cluster, i.e. not the k-th cluster. In this case the distance measure used is the Euclidean distance. The best clustering technique and the best cluster partition is the one that allows you to maximize the average Silhouette index calculated as follow: n
s=
1 K 1 k ! ! s(i, k) K k=2 nk i=1
(6)
3. Application of the sequential analysis 3.1. Data and structure of the questionnaire The sequential analysis was applied to primary data collected at three different Christmas Markets in northern Italy. The survey was conducted during the four weeks of advent in
6
December 2008 and 2009 and althogher 1193 visitors were interviewed in three different North Italian cities: Trento, Bolzano and Brunico. Interviews were made in the most visited areas of the three Christmas Markets in selected working and week-end days and, in particular, during late afternoon and early evenings. The questionnaires were selfadministrated and anonymity was guaranteed. A convenience sampling method was used as it was not physically possible to employ a random sampling approach in an open venue. Furthermore, we have interviewed only one person for each household or travelling group passing through the selected interviewing spots. The questionnaire was divided in 3 sections (see Table 1). Table 1: Description of the questionnaire structure. Sections A
Object Trip information
B
Christmas Market information
C
Interviewed profile
Description whether s/he is a tourist, day-visitor or local resident; number of nights and type of accommodation used by tourists; expenditure per night for accommodation and expenditure per day for food and drinks; factors that motivated the trip*. factors that motivated the visit to the Christmas market*; authenticity*; expected shopping expenditure; cultural characteristics of the Christmas market*. socio-demographic and economic characteristics of interviewees and their families; means of transport.
Note: *Rating on a Likert scale (Likert, 1931) from 1 to 6 has been used.
3.2. Results The first step of this analysis consisted of a SOM algorithm in its Batch version and arranged the nodes in a hexagonal grid. The initial values of mi were chosen using a linear initialization procedure and the number of nodes in the output space is M =5
N (Sang et al.,
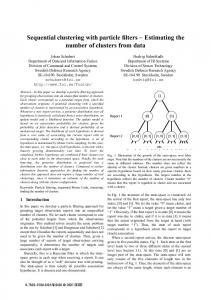
2008). The variables used to segment tourists visiting the Christmas Market are the motives of the trip and the motives that lead to the visit of the event (see list in table 3). The U-matrix is ! displayed in figure 1: the dark shading represents a large distance between neighbouring nodes, and therefore indicates cluster borders; the light shading represents neighbouring neurons with similar characteristics. From figure 1, it is evident that in our case there are several groups of observations with similar characteristics and that the borders of these groups are not precisely identified so it is necessary to process this results with another clustering technique.
7
Figure 1: U-matrix. At this stage, in tourism literature it is most common to choose the algorithm and the partition on a subjective way. However, this approach produces biases and can cause unreliable results. In our case we have decided to overcome these limitations calculating the Silhouette index to both different hierarchical algorithms (Single, Complete, Average, Ward) and the k-means method for all cluster partitions from 2 to 10 (see table 2). We have seen in the methodology section that there are three different non-linear indexes and that the literature suggests the Silhouette index to be the most suitable for this case. In fact, we have also calculated the Dunn and Davies-Bouldin indexes and found that the former is not able to find a cluster solution, while the latter produces results similar to the Silhouette index. Table 2: Average Silhouette index. k 2 3 4 5 6 7 8 9 10
Single 0.4469 0.1459 0.1913 0.0914 0.0724 0.0795 0.0683 0.0628 0.0184
Hierarchical algorithms Complete Average 0.3532 0.3532 0.2451 0.2459 0.1985 0.2585 0.2292 0.2493 0.2154 0.2370 0.2005 0.2318 0.1954 0.2210 0.1970 0.2007 0.1968 0.2149
Ward 0.2346 0.2127 0.2064 0.1794 0.2022 0.2110 0.2171 0.2209 0.2315
k-means 0.2613 0.2813 0.2431 0.2386 0.2283 0.2500 0.2629 0.2395 0.2651
Generally, a good classification is identify by a value of the Silhouette index greater than 0.65 (Liu et al., 2003). It is necessary to remember that, in our study, the index is calculated on the SOM results and so the Silhouette index takes values lower than those required and we
8
simply choose the method and the partition that allow us to obtain the maximum value of the index. As we can see from table 2, Single algorithm with two clusters gives the best partition, but this method produced a cluster with only one node containing 13 observations and a cluster with the remaining observations, so we have not considered this solution. Using the Complete and Average method we will choose the partition with two clusters but also in this case we obtain a cluster with only 60 observations (5% of the sample). We than chose the best partition obtain from the k-means algorithm, i.e. three clusters. Figure 2 represents the final clustering partition in the U-matrix figure.
Figure 2: Best clustering structure according to the Silhouette index. The component plane (figure 3) allows us to identify the characteristics of the respondent included in each cluster in terms of motives of the trip and motives that lead to the visit of the event (see table 2 for the mean and standard deviation values): dark-coloured (light-coloured) nodes identify high (low) value of each statement for all observations in the node. Table 3 provides the mean value (standard deviation) calculated for each variable used in the algorithm and the Cronbach's alpha coefficient (Cronbach, 1951), a measure of internal consistency used to evaluate the reliability of scales. The range of values for this coefficient is [0, 1] and, in exploratory research, we have an acceptable level of internal consistency when the coefficient is higher than 0.6 (Burgess and Steenkamp, 2006; Field, 2005; Hair, Anderson, Tatham and Black, 1998). This is the case of the coefficient for both two blocks of questions. Of the three clusters, cluster 1 contains 150 (16.2%) tourists, more than half of tourists are grouped in cluster 2 (486 tourists corresponding to 52.4% of the sample), and the rest of the tourists compose cluster 3 (292 tourists equal to 31.4%). If we compare the mean values of the different variables for each cluster (Table 3), we can observe that:
9
- cluster 1 is composed by visitors that are business men/women who do not consider important visiting the town and/or the Christmas Market. Their motivation to visit the Christmas Market is related to the fact that they are nearby and/or they have nothing else to do at the time. This cluster can be named “Business people”; - cluster 2 comprises visitors that engage in the trip because they want to visit the Christmas Market and, consequently, they are mainly interesting in experiencing the Christmas atmosphere, tasting local food and drinks, enjoying/relaxing and shopping. This cluster can be named “Christmas fans”; - cluster 3 is composed by visitors that engage in the trip for a variety of reasons; first of all they want to relax and second they want to visit the Christmas Market. However, strong pulling factors for the trip are also the town itself and the region (Trentino – South Tyrol). Therefore, when in town, the members of this cluster, visit the Christmas Market mainly to experience the Christmas atmosphere, to taste local food and drinks, but also to experience something different. This cluster can be named “General tourists”.
Figure 3: Component plane. The legend of the variables is reported in table 3. To profile each group socio-demographic characteristics, type of tourist, city visits, perception of cultural characteristics and authenticity of the Christmas Market were used (see Appendix A for the complete list of variables). Significant dependence emerged between clusters and some profiling variables, suggesting that the motives of the trip and the motives
10
that lead to the visit of the event are either influenced by or they are a function of the profiling variables (see Appendix A). As regards the type of visitors and the visited city, we note that: - “Business people” have the largest proportion (41.9%) of day visitors (against 40% of “Christmas fans” and 29.4% of “General tourists”) and the largest proportion of visitors in Trento (35.3%, against 30.7% of “Christmas fans” and 34.6% of “General tourists”); - “Christmas fans” present the largest proportion of tourists that visit Bolzano (63%, against 47.3% of “Business people” and 46% of “General tourists”) and the lowest proportion of tourists that visit Brunico (6.4%, against 17.3% of “Business people” and 19.9% “General tourists”), perhaps because this city is not easy to reach and is the heart of a skiing resort. Table 3: Mean value (standard deviation). Sample How important are the following factors for this trip? a1 To visit the town 4.17 (1.56) a2 To visit museums and historic sites 2.90 (1.71) a3 To visit the Christmas Market 4.95 (1.38) a4 To do sport activities 2.00 (1.73) a5 To enjoy the nature 3.29 (1.92) a6 To visit Trentino -South Tyrol 3.50 (1.90) a7 To visit friends and relatives 1.98 (1.80) a8 This is a business 1.49 (1.37) a9 To relax 4.68 (1.78)
Business people
Christmas fans
General tourists
2.67 (1.34) 2.04 (1.35) 3.17 (1.55) 2.66 (2.12) 2.98 (1.97) 2.47 (1.62) 2.45 (2.03) 2.19 (1.95) 4.07 (1.93)
4.10 (1.44) 2.43 (1.41) 5.35 (0.93) 1.36 (1.03) 2.57 (1.62) 2.98 (1.73) 1.50 (1.31) 1.13 (0.71) 4.52 (1.83)
5.06 (1.19) 4.14 (1.67) 5.21 (1.18) 2.72 (2.02) 4.65 (1.62) 4.91 (1.45) 2.53 (2.13) 1.73 (1.64) 5.27 (1.42)
How important are the following factors in your visit to the Christmas Market? b1 Shopping 3.97 (1.71) 2.58 (1.52) 4.18 (1.59) b2 Socializing 3.03 (2.03) 2.63 (1.80) 2.54 (1.87) b3 Enjoying/relaxing 4.78 (1.48) 3.70 (1.69) 4.74 (1.43) b4 Meeting new people 2.81 (1.90) 2.13 (1.53) 2.08 (1.48) b5 Experiencing something different 3.89 (1.84) 2.57 (1.58) 3.62 (1.79) b6 Being nearby/having nothing else to do 1.57 (1.33) 2.67 (1.88) 1.16 (0.67) b7 Staying with the partner/family 3.38 (2.13) 2.97 (2.00) 2.88 (2.02) b8 Giving support to a community event 2.35 (1.79) 1.74 (1.33) 1.72 (1.32) b9 Tasting local food and drinks 4.91 (1.45) 3.39 (1.78) 4.98 (1.26) b10 Experiencing the Christmas atmosphere 5.02 (1.46) 2.86 (1.67) 5.33 (1.01) Note: One-way ANOVA test is significant at p ≤ 0.01.
Cronbach’s alpha 0.6134
0.6904 4.34 (1.65) 4.05 (2.05) 5.41 (1.05) 4.37 (1.76) 5.02 (1.38) 1.69 (1.47) 4.43 (1.99) 3.70 (1.93) 5.57 (0.87) 5.62 (0.84)
As regards the socio-demographic characteristics, we observed that overall “Business people” are mainly men (61.5%), “Christmas fans” are mainly women (51.9%) and “General tourists” are equally divided between the two genders. More than half of the “Business people” and “Christmas fans” are young and less than 33 years old (62.3% and 60% respectively), while “General tourists” are mainly more mature (54% of them are more than
11
33 years old). “Business people” own a higher income (15.3% of this group members have more than €55,000 of annual income, against around 12% observed in the other two groups), “General tourists” have a lower income (57.2% of them have less than €28,000 annual income, against 53% of “Business people” and 48% of “Christmas fans”) while “Christmas fans” have the highest percentage of tourists (31.9%) in the annual income class €28,000 to €55,000 (against 24% of “Business people” and 21% of “General tourists”). Finally, “Business people” come mainly from the North-East of Italy (48.63%) and present the highest percentage (12.3%) of tourists from abroad (against 4.8% of “Christmas fans” and 11.7% of “General tourists”), “Christmas fans” mainly come from the North-West of Italy (38.4%), while “General tourists” are fairly equally divided between the three macro-regions of Italy (North-East, North-West and Centre-South) and present the highest percentage of tourists come from the Centre and the South of Italy (about 28%, against 20.3% of “Christmas fans” and 17.8% of “Business people”). The percentage of tourists that consider the Christmas Market authentic (table 4) is much higher in the “General tourists” and “Christmas fans” (88.7% and 81.9% respectively) than in the “Business people” (48.7%). Also, the general perceptions about the Christmas Markets representing an authentic experience are higher for “Christmas fans” and “General tourists” than for “Business people”. Although “Christmas fans” and “General tourists” have similar opinions on the cultural characteristics of the Christmas markets, some underlying differences can be noted: first of all, “General tourists” have a higher perception that the Christmas market offers represent a local historical tradition and the local culture, however, they also have a stronger perception that the Christmas market is a purely tourist event: on a scale from 1 to 6, where 1 is do not agree and 6 is highly agree “General tourists” scored a mean of 4.21, while “Christmas fans” scored a mean of 3.86. Table 4: Percentage, mean value (standard deviation).
4.45 (1.28) 21.32% 78.68%
Business people 3.47 (1.44) 51.35% 48.65%
Christmas fans 4.52 (1.13) 18.14% 81.86%
4.18 (1.48) 4.34 (1.47) 4.31 (1.39) 4.02 (1.48) 3.19 (1.61) 2.90 (1.64) 3.96 (1.63)
3.02 (1.47) 3.30 (1.49) 3.42 (1.26) 2.87 (1.33) 2.32 (1.30) 2.26 (1.29) 3.83 (1.64)
4.11 (1.36) 4.31 (1.36) 4.25 (1.33) 3.93 (1.34) 3.02 (1.48) 2.63 (1.45) 3.86 (1.58)
Sample Authenticity Not authentic (from 0 to 3) (%) Authenitc (from 4 to 6) (%) Characteristics of Christmas Market: Local culture Local historical tradition Authentic products Experience local culture Learn local customs Interact with local people Purely tourist event
General Cronbach’s tourists alpha 4.85 (1.18) 11.34% 88.66% 0.7850 4.88 (1.27) 4.91 (1.33) 4.86 (1.31) 4.77 (1.37) 3.92 (1.67) 3.69 (1.81) 4.21 (1.69)
12
Unique in Italy 2.49 (1.67) Note: One-way ANOVA test is significant at p ≤ 0.01.
1.90 (1.29)
2.51 (1.63)
2.76 (1.82)
4. Discussion and Conclusions The segmentation of Christmas markets can be a useful tool for event planners and destination managers and marketers to identify effective marketing activities and business strategies. Toward this end, this study conducted a combined process of clustering (SOM and k-means algorithms) based on the motivation variables. In contrast with the other segmentation methods used in the tourism literature based on factor analysis (as a conglomerated variables) follow by a cluster method (hierarchical or non-hierarchical), this study consider the original set of variables using all available information. As underlined by Chen et al. (1999), there are two main reasons to use all variables: first, results of the factor analysis could be different when researcher uses different rotation methods; second, the original variables may be more interpretable than derived constructs with factor labels because the naming and the interpretation of the construct involve personal judgment that we wanted to avoid. The use of the SOM and the Silhouette index to select both the best cluster algorithm and the best partition has resulted to be suitable techniques. So far, tourism research practice has used subjective measurers to determine both the number and the algorithm of the clusters. The application of the Silhouette index reduces biases due to subjective preferences of the researchers and, sometimes, explanatory constraints. The analyses reveal three different segments: “Business people”, “Christmas fans” and “General tourists”. “Business people” are not interested to visit the city and the Christmas Market, because the Market and Christmas atmosphere are not important factors and do not represent an authentic experience for them. On the other side, “Christmas fans” are enthusiastic about Christmas and the Christmas atmosphere created by the Christmas Market, and these are the main pulling factor for the trip. This is the biggest cluster and represents more than half of the sample. “General tourists” are those who undertake the trip to relax and when they are in town they are enthusiastic by the city itself and its attractions, the market and the Christmas atmosphere it creates. For example, advertising campaigns about the Christmas Market should take place mainly in the North of Italy; while the city, all of its attractions and
13
amenities, and the opportunities it offers to relax and disconnect from the daily life should be advertised in the centre and south of Italy, and internationally. Our analysis suggests that in order to attract more “Business people” event marketers should organize new entertainment activities linked to relaxation and local foods and drinks. “General tourists” appear to be strongly attracted by the event, however they are also keen to fully experience the destination with all its cultural and natural attractions. For this reason it is necessary to market to them a bundle of services that cover the entire destination. With respect to “Christmas fans”, event managers must perform a control of the quality of the products and activities offered at the event, specifically in terms of authenticity, so that the Christmas atmosphere and the local products satisfy the need for authenticity for this group of visitors. As expected, the results obtained in this research are consistent with other cultural events studies and recommend event planners and marketers to consider the issue of authenticity with particular attention when organizing event activities. This study has some limitations: the segmentation analysis is based on a non-random sampling technique. Thus, to verify if the results of this research are valid for other cultural events, a future study will be required in other cultural events, in other years, and/or other towns. Finally, this research could be extended in the future by comparing SOM with other segmentation techniques, both linear and non-linear techniques, evaluating which of them is better for segmenting Christmas Market visitors.
14
References Albalate, D., & Bel, G. (2010) Tourism and urban public transport: Holding demand pressure under supply constraints. Tourism Management, 31(3), 425-433. Allen, J., O’Toole, W., Harris, R., & McDonnell, I. (2008). Festival & special event management. Milton, QLD: John Wiles & Sons Australia, Ltd. Beane, T.T., & Ennis, D.M. (1987). Market segmentation: a review. European Journal of Marketing, 21(5), 20-42. Bigné, J.E., & Andreu, L. (2004). Emotions in Segmentation. An Empirical Study. Annals of Tourism Research, 31(3), 682-696. Bloom, J.Z. (2004). Tourist market segmentation with linear and non-linear techniques. Tourism Management, 25 723–733. Bloom, J.Z. (2005). Market Segmentation: A Neural Network Application. Annals of Tourism Research, 32(1), 93-111. Boone, D., & Roehm, M. (2002). Retail segmentation using artificial neural networks. International Journal of Research in Marketing, 19(3), 287-310. Burgess, S. & Steenkamp, J., (2006). Marketing renaissance: how research in emerging markets advances marketing science and practice. International Journal of Research Marketing, 23(4), 337-356. Chen, J.S., & Hsu C.H.C. (1999). The use of logit analysis to enhance market segmentation methodology. Journal of Hospitality & Tourism Research, 23(3), 268-283. Choi, A.S. (2011). Implicit prices for longer temporary exhibitions in a heritage site and a test of preference heterogeneity: A segmentation-based approach. Tourism Management, 32, 511-519. Claver-Cortés, E., Molina-Azorín, J.F. and Pereira-Moliner, J. (2007). Competitiveness in mass tourism. Annals of tourism Research, 34(3), 727-745. Cronbach, L. J. (1951). Coefficient alpha and the internal structure of tests. Psychometrika, 16(3), 297-334. Curry, B., Davies, F., Phillips, P., Evans, M., & Moutinho, L. (2001). The Kohonen selforganizing map: an application to the study of strategic groups in the UK hotel industry. Expert Systems, 18(1), 19-31. Davies, D.L. & Bouldin, D.W. (1979). A cluster separation measure. IEEE Trans. Pattern Anal. Machine Intell., 1, 224–227.
15
Dolnicar, S. (1997). The use of neural network in marketing: Market segmentation with self organizing feature maps. WSOM’97, Helsinki University of Technology, Espoo, Finland 4-6 june 1997. Dolnicar, S. (2008). Market segmentation in tourism. In A. Woodside, & D. Martin (Eds.), Tourism management, analysis, behaviour and strategy (129-150). Cambridge: CABI. Dunn, J.C. (1974). Well separated clusters and fuzzy partitions. J. Cybernet., 4, 95–104. Field, (2005). Discovering Statistics using SPSS. Sage Publication, California. Getz, D. (2007). Event studies: Theory, research and policy for planned events. Oxford, UK: Butterworth-Heinemann. Getz, D. (2008). Event tourism: definition, evolution and research. Tourism Management, 29(3), 403-428. Hair, J.F., Anderson, R.E., Tatham, R.L., & Black, W.C. (1998). Multivariate data analysis (5th ed.). Upper Saddle River, New Jersey: Prentice Hall. Handl, J., Knowles, J., & Kell, D.B. (2005). Computational Cluster Validation in PostGenomic Data Analysis. Bioinformatics, 21(15), 3201–3212. Kim, J., Wei, S., & Ruys, H. (2003). Segmenting the Market of West Australian Senior Tourists. Using an Artificial Neural Network. Tourism Management, 24(1), 25-34. Kohonen, T. (1984). Self-organizing and Associative Memory (3rd edition 1989). Berlin, Heidelberg, Germany: Springer-Verlag. Kohonen, T. (1995). Self-Organizing Maps. Springer Series in Information Sciences 30, Springer, Berlin, Heidelberg, New York. Konu, H., Laukkanen, T., Komppula, R., (2010). Using ski destination choice criteria to segment
Finnish
ski
resort
customers.
Tourism
Management,
doi:
10.1016/j.tourman.2010.09.010. Kotler, P., Bowen, J.T., & Makens, J.C. (2010). Marketing for hospitality and tourism (5th ed.). Upper Saddle River, New Jersey: Pearson Prentice Hall. Lee, C.K., Lee, Y.K., & Wicks, B.E. (2004). Segmentation of festival motivation by nationality and satisfaction. Tourism Management, 25(1), 61-70. Likert R. (1932). A technique for the measure of attitudes. Archives of Psychology, 140, 5-55. Mazanec, J.A. (1992). Classifying tourists into market segments: A neural network approach. Journal of Travel & Tourism Marketing, 1(1), 39-59. Pérez, E.A., & Nadal, J.R. (2005). Host Community Perceptions. A Cluster Analysis. Annals of Tourism Research, 32(4), 925-941.
16
Rousseeuw, P.J. (1987). Silhouettes: A Graphical Aid to the Interpretation and Validation of Cluster Analysis. Journal of Computational and Applied Mathematics, 20, 53–65. Saarenvirta, G. (1998). Mining customer data. DB2 Magazine, 3(3), 10-20. Venugopal, V., & Baets, W., (1994). Neural networks and statistical techniques in marketing research: A conceptual comparison. Marketing Intelligence and Planning, 12(7), 30-38.
17
Appendix A: Comparisons among clusters (%) Demographic characteristic Town Visits Brunico Bolzano Trento Type of tourist day visitor tourist Gender Female Male Age 15-|25 25-|33 33-|45 >45
Business people N = 150 (16.3%)
Christmas fans N = 486 (52.4%)
General tourists N = 292 (31.4%)
12.39 54.96 32.65
17.33 47.33 35.33
6.38 62.96 30.66
19.86 45.55 34.59
χ2 = 43.505 p = 0.000**
36.98 63.02
41.89 58.11
40 60
29.41 70.59
χ2 = 10.533 p = 0.005**
48.86 51.14
38.51 61.49
51.85 48.15
49.14 50.86
χ2 = 8.091 p = 0.018*
23.33 32.56 20.11 0.24
25.34 36.99 13.70 23.97
25.42 34.53 19.49 20.55
18.79 26.95 24.47 29.79
χ2 = 19.808 p = 0.003**
53.34 24.00 15.33 7.33
47.95 31.89 11.52 8.64
57.19 20.89 11.65 10.27
χ2 = 14.423 p = 0.025*
48.63 21.23 12.33 5.48 12.33
36.48 38.36 14.26 6.08 4.82
30.74 29.33 16.61 11.66 11.66
χ2 = 47.393 p = 0.000**
Sample
Annual income 0-|28,000 51.72 28,000-|55,000 27.16 >55,000 12.18 Missing value 8.94 Origin North-East of Italy 36.64 North-Weast of Italy 32.78 Centre of Italy 14.68 South of Italy 7.73 Abroad 8.16 ** Significant at p ≤ 0.01, * Significant at p ≤ 0.05.
Significance
18