PhoneFactor dialer to make the call out to the PSTN, and a database server ... to lease outgoing voice circuits for connectivity to its access. PSTN provider.
Proc. IFIP/IEEE International Symposium on Integrated Network Management (IM'2009), New York, June 2009
Service Management Architecture and System Capacity Design for PhoneFactorTM—A Two-Factor Authentication Service Haiyang Qian1 , Chandra Sekhar Surapaneni2 , Stephen Dispensa2 , Deep Medhi1 1 University of Missouri–Kansas City, USA 2 PhoneFactor, Inc., USA
Abstract—PhoneFactorTM is a token-less two-factor authentication service for user remote logons [13]. This allows users of an organization to be authenticated through an automated phone call to the user’s phone before access is allowed. In this paper, we present the service management architecture of PhoneFactor that depends on both the Internet and the public switched telephone network (PSTN), and we identify two key quality of service parameters, the system response time and call blocking probability, where the latter can impact the former. Furthermore, through traffic analysis of the measurement data from the deployed PhoneFactor service, we found that the inter-arrival time of requests follows the Generalized Pareto distribution while the system response time and the call duration (for the authentication part through the phone call) follow the lognormal distribution. Given these distributions, we then present system capacity design methodologies by comparing them to known results for systems that are analytically derivable. Index Terms—Token-less Two-factor Authentication Service; System Management; System Capacity Design; Traffic Analysis.
I. I NTRODUCTION Authentication services are important services for user authentication in network-based applications. The basic form of authentication, in practice, is often a single-factor authentication, such as entering a password along with a username. In general, strong authentication relies on the following factors: 1) something you know, 2) something you have, and 3) something you are; these three are formally related to knowledge-based authenticators, object-based authenticators, and ID-based authenticators, respectively [11]. The username/password approach falls in the first category. For the second category, a physical device that a user carries is a factor, while for the third category, a user’s fingerprint is an example. Due to the inherent limitation of a single-factor authentication, multi-factor authentication has become increasingly important in order to provide added access protection. In particular, we consider here two-factor authentication services consisting of the first two factors: something you know and something you have. There are a number of two-factor authentication mechanisms that are being productized. For example, while the username/password falls in the first factor, for the second factor, a physical device is a common approach. In this
scenario, the physical device generates a new password every minute or so (“token”) that is to be entered when logging onto a system. There are a number of authentication services based on such two-factor authentication; for example, see [1], [3], [5], [13], [15]. A recently introduced two-factor authentication service is P HONE FACTORTM [13]. This is a token-less scheme in which something you have is a phone (typically, a mobile phone). When the user enters her username and the password for the first factor (for example, to logon to a remote computer system), the backend system for PhoneFactor generates a phone call to the user’s phone; the user needs to accept the call and enter “#” (or a PIN number). This is then authenticated. If this succeeds, then the user is given access to the remote computer system. From a user’s point of view, this approach does not require any token. Usually, a user’s phone, especially a mobile phone, is almost always with the user. If some intruder is trying to access it by typing her username and password, the user will hear a ring and does not need to respond so that the intruder’s access is blocked. Furthermore, this approach does not require a new password to be entered every time unlike a token-based approach. From a systems network management point of view, this service requires interworking between the Internet for user access for the service and the public switched telephone network (PSTN) for the phone call generated. Because of this being a service, there are three different entities involved: a provider for the service, an organization (“customer”) that requires this service, and the users of this organization who use this access mode to gain entry to the organization’s remote computing systems. Certainly, different organizations may have different requirements that the PhoneFactor provider must be able to provide as service features. For example, while one organization might want “#” to be entered, another might prefer that a PIN be entered. Furthermore, there are qualityof-service requirements that must be met by the provider; for example, the response time since the user entered the username/password to the time the user is allowed access to have an acceptable time bound. Similarly, there must be enough voice circuits to accommodate requests when the requests come in.
The scope of this paper is multi-fold. First, we present the PhoneFactor service and the backend service management architecture, and the issues involved. Secondly, given the quality of service requirements, we study the actual measurement data for the deployed service to infer on statistical characteristics. This is then followed by an approach to system capacity design to address quality of service requirements. Currently, there is no systems study for any of the token-based twofactor authentication schemes. Our goal is to shed some light into such services through the study of PhoneFactor and its systems issues. Through traffic analysis of measured data, we found that the traffic does not follow conventional distributions requiring us to develop a system capacity design methodology based on approximation. Finally, we note that the comparison of different two-factor authentication schemes or their service architecture is outside the scope of this paper. The rest of the paper is organized as follows. In Section II, we present the PhoneFactor service management architecture. In Section III, we present data measurement Then, in Section IV, we present traffic analysis based on collected data for the PhoneFactor service; Finally, we present system capacity design methodologies based on traffic studies and systems requirements in Section V. II. P HONE FACTOR : T HE S ERVICE M ANAGEMENT A RCHITECTURE , AND T HE Q UALITY OF S ERVICE R EQUIREMENTS PhoneFactor [13] was launched as a token-less two-factor authentication service for remote logons in May 2007 [14] and has now been operational for more than a year. In this service, when the user enters her username and password to access a remote computer system, the backend system for PhoneFactor
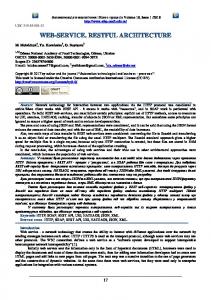
Fig. 1. PhoneFactor Service Management Architecture: A typical sequence of functions, starting with the computer (phone factor agent)
generates a phone call to the user’s phone; the user then needs to accept the call and enter “#” (or a PIN number). This is then authenticated; if this succeeds, then the user is given access to the remote computer system. Thus, the basic service view is simple. To provide this service, there are several entities involved: a PhoneFactor agent (PFA), a PhoneFactor daemon (PFD), a PhoneFactor dialer to make the call out to the PSTN, and a database server (Figure 1). The PhoneFactor agent works as the starting point for the service, which resides at the user’s computer. From there, the user’s request is sent to the PhoneFactor daemon; this entity then takes charge of accounting for the overall request. Note that the username and the password entered by the user remain the function of the organization to verify as is typical with any basic logon service, and is not forwarded to the PFD. The PFD may do additional authentication for the customer if needed, and then contacts the PhoneFactor dialer to make the call while keeping the request on hold; it also logs the request information in the database server. Once the dialer returns back with the user accepting the call and entering “#” (or PIN number), then it reports to the PhoneFactor daemon about the status. The PhoneFactor daemon, in turn, then communicates to the PhoneFactor agent the result of the call (accepted or not accepted). On receiving this status, the PhoneFactor agent allows the user to logon to the remote system. The sequence of functions in a PhoneFactor request is also shown in Figure 1. In addition to the entities discussed above, there is also a PhoneFactor web interface. This is for end-user organizations to change any requirement for users and for distributed service handling; this is not shown in this figure as this is not pertinent to the scope of this paper. It may be noted that the PhoneFactor dialer involves an Internet-to-PSTN interfacing for the call flow. In fact, on the Internet side of it, the call is generated through the session initiation protocol (SIP) thatis translated to the SS7 ISUP signaling message at the IP-PSTN gateway. Thus, the gateway also performs signal translation functions. For the PhoneFactor provider, there are two main quality of service requirements. The first is the response time—from the instant the user enters the username/password to the time this is accepted. This duration, which will be referred to as the system response time (SRT), should be acceptable to the customers. This is also the one that is visible to the customer, especially its users. As we see from the above description of the backend architecture, the request results in a call set up to the PSTN network. Thus, the PhoneFactor provider needs to lease outgoing voice circuits for connectivity to its access PSTN provider. During the request, if a circuit cannot be found in this group of outgoing circuits, then the call would be blocked. As a result, the user will see this as an access denial while in fact the denial is not due to any authentication failure; rather, it is due to the nonavailability of circuits. Therefore, a second important quality of service requirement is that
there must be enough circuits leased so that the call blocking probability is very low, say 0.1% blocking—a threshold that is commonly used in the PSTN network, which is what the PhoneFactor service also wants to use. In other words, the system must be architected so that these two QoS factors are met. We note that there are, however, factors that can play a role, which is outside the PhoneFactor system. For example, the user may be located in a physical area where the mobile phone reception is poor, and thus, may not receive the call, although the call was made from the PhoneFactor system. We do not consider such external factors in our study. III. DATA M EASUREMENT In order to design the system to meet quality of service requirements, we collected data from the user requests that have been logged at the PhoneFactor daemon. It may be noted that a request is known only when it arrives at the PhoneFactor daemon; there is no way to know the latency from the PhoneFactor agent to the PhoneFactor daemon— we assume this quantity to be negligible. Thus, for every request, we have the timestamp of when a request arrives at the PhoneFactor daemon and the timestamp of when the response after the phone authentication is sent back to the user—we refer to this time difference as the measured system response time (MSRT). There are also intermediate points when a request is measured to understand the progress of the request, as allowed by the overall architecture of the system. In order to understand the measurements, we first articulate several key events during the life of a request and what these events are. Figure 2 shows these events and when they take place. At the top, we show the time window for the measured system response time. During this entire time, after the request is stamped, the initial call set up is activated, followed by the SIP server response and the phone ring. The user picks up the call, and responds with “#”. As soon as the PFD notes this, it lets the PFA know; therefore, this is the end point of the response time. The user may take a few more moments to hang up the phone call (‘call hangup time’), which occurs after the response is received at the terminal by the user. To study the system behavior, we collected data over several weeks that spanned a six-month period. For the purpose of discussion here, we will use the data set for four consecutive weeks during June 2008. Briefly, we have the following information: the timestamp of the request arrivals at the PhoneFactor daemon, the measured system response time, time until pick up, and the duration after call pick up. In Figure 2, we marked the measured quantities by listing them in bold-italics fonts. Due to internal verification and systems consideration, the timestamp to initiate the call is not available at the PFD. It may be noted that the call setup time in this part means the phase that starts from the Internet side all the way to when the call rings at the PSTN side. From the measurement at the dialer, we can obtain the time that is marked as ‘time until
pick up’, but not exactly when the call ringing starts. We can also obtain the actual duration of the call from the timestamp at the dialer. Implications of these measurements and event time will be further explored in the following discussion on traffic analysis and system design. IV. T RAFFIC A NALYSIS A. Request Arrival First, we discuss the arrival frequency of requests at the PhoneFactor daemon by breaking the four weeks into daily data, and summing up the requests over every five minute window; this is shown in Figure 3. We can clearly see that arrivals have daily cycles, where weekends have much less traffic. During the weekdays, patterns are very similar while Tuesdays and Wednesdays appear to show most arrival traffic. It may be noted that while request arrivals are due to human users (not automated requests), some weekly patterns are possible as some requests are generated once a week due to the use of the logon service by customers for certain weekly transactions. Nevertheless, it is clear that to provide quality of service, we must consider traffic data for weekdays and especially around the peak time; in most cases, the peak time falls in the mid morning time frame. Since the weekday traffic is significantly more than weekend traffic, we base our traffic characterization from weekday data during the four week period. We consider next the inter-arrival time of requests. Based on the measured data, we use the Maximum Likelihood Estimation (MLE) method to fit the data into distributions. We found that the distribution of inter-arrival time between requests is best fitted by Generalized Pareto, with k �= 0 as the shape parameter, ζ as the scale parameter, and θ as the threshold parameter, where the cumulated distribution function (CDF) is given by: k(t − θ) −1/k ) . ζ
P (T < t) = 1 − (1 +
(1)
We chose the threshold parameter by making the mean and the variance as close to the measured mean and the measured Time
Measured system response time Call setup time Call cycle Initial duration at PFD
Request timestamp
Time until pick up
SIP server response Initiate call
Fig. 2.
Duration after user picks up
Call pickup Call ring starts
Call hang up ‘#’ response timestamp
PhoneFactor Event diagram
1st Week
0.02 Inter−arrival Time Generalized Pareto
0.018 0.016
2nd Week
0.014
Number of Arrivals
Density
0.012
3rd Week
0.01 0.008 0.006 0.004
4th Week
0.002 0
0
500
1000
1500
Time (second)
Sun.
Fig. 3.
Mon.
Tue.
Wed. Thu. 5 Minutes Window
Fri.
Sat.
Fig. 5.
Number of Arrivals of 5 Minutes Window for 4 Weeks
Probability Density Function of Inter-arrival Time
TABLE II I NTER - ARRIVAL TIME : M EAN AND VARIANCE OF THE MEASUREMENT
TABLE I PARAMETERS OF FITTED G ENERALIZED PARETO DISTRIBUTION
Parameter k ζ θ
Estimat 0.335537 38.5967 -0.000001
Std.Err. 0.00732712 0.354336 0
M ean V ar
variance as possible. The estimated parameters of the Generalized Pareto distribution and their standard errors are given in Table I. Since θ is predefined, its standard error is always equal to 0. Certainly, the inter-arrival time cannot be less than 0 in reality; therefore, we round up all values less than 0 in the fitted distribution to 0. Figure 4 and Figure 5 show how the cumulative distribution function and the probability density function fit the inter-arrival time of the PhoneFactor requests, respectively. The mean and the variance of the fitted distribution along with the ones from the measurement are given in Table II. 1 Inter−arrival Time Generalized Pareto
0.9 0.8 Cumulative probability
AND FITTED DISTRIBUTION
0.7 0.6 0.5 0.4 0.3
M easurement 59.4988 12981
F itted GP D 58.0871 10258
generated, not machine generated. Often, such user arrival tends to follow the Poisson process (i.e., the inter-arrival time is exponentially distributed) as is commonly observed for call arrivals in the telephone network and also for session arrivals in the Internet [12]. However, we found that for PhoneFactor requests, the inter-arrival time is Generalized Pareto distributed, not exponentially distributed. This is a significant observation as this impacts system design implications that we will discuss later. B. System Response Time As noted earlier, we have also collected the data for the measured system response time for every request. We can see from Figure 2 that this quantity involves several internal steps. Assuming this to be a blackbox system, we still want to understand the characteristics of the measured system response time. We found that the measured system response time is fitted by the log-normal distribution, with γ as the mean and � as the standard deviation, for which the probability density function is given by: � � (ln(t) − γ)2 1 √ exp − . (2) f (t) = 2�2 t� 2π
0.2 0.1 0
0
500
1000
1500
Time (second)
Fig. 4.
Cumulative Distribution Function of Inter-arrival Time
Note that the request arrivals for PhoneFactor are human
The estimated parameters of the log-normal distribution and their standard errors are given in Table III, which were derived using the Maximum Likelihood Estimation (MLE) method. The mean and the variance of the measurement and the fitted distribution are listed in Table IV. Although the variance of the fitted data is off from the measured data, this still provides us with a reasonable approximation since the
C. Call Duration Time
1 PFD SRT Lognormal
0.9
Cumulative probability
0.8 0.7 0.6 0.5 0.4 0.3 0.2 0.1 0
0
Fig. 6.
100
200
300 Time (second)
400
500
Cumulative Distribution Function of System Response Time
PFD SRT Lognormal
0.07 0.06
Besides the system response time, another important information is the call duration time—the time starting with the call ring until the user hangs up the phone. It may be noted from Figure 2, we cannot directly measure this information as the voice circuits do not belong to the PhoneFactor provider. Instead, we can measure the ‘duration after user picks up’, which is the time since the call is picked up by the user until she hangs up. While there is a time gap between the time the call rings and the time when the user picks up the phone, this gap is negligible in this system since the user is already anticipating on hearing her phone ring; therefore, in almost all cases, the user will pickup the phone as soon as it rings. Consequently, for all practical purposes, ‘duration after user picks up’ effectively captures the call duration time. From analyzing the ‘duration after user picks up’, we found that the call duration time is approximately fitted by the log-normal distribution; note that usually, human conversation is found to be exponentially distributed for the call duration time, while recently it was reported that the duration
0.04
1
0.03
0.9
0.02
0.8
0.01 0
0
Fig. 7.
100
200
300 Time (second)
400
500
Cumulative probability
Density
0.05
Probability Density Function of System Response Time
Holding Time Lognormal
0.7 0.6 0.5 0.4 0.3 0.2 0.1
TABLE III PARAMETERS OF FITTED LOG - NORMAL DISTRIBUTION FOR THE
0
MEASURED SYSTEM RESPONSE TIME
Parameter γ �
Estimat 2.69284 0.4899
Std.Err. 0.00287629 0.0020339
Fig. 8.
OF THE MEASUREMENT AND THE FITTED DISTRIBUTION
Fitted log-normal 16.6571 75.2613
100
150 Time (second)
200
250
Cumulative Distribution Function of Call Duration Time
Holding Time Lognormal
0.04
Density
Measurement 16.7618 113.6379
50
0.05
TABLE IV M EASURED SYSTEM RESPONSE TIME ( IN SEC ): M EAN AND VARIANCE
M ean V ar
0
0.03
0.02
0.01
mean is quite close. Furthermore, from Figure 6 and Figure 7, which show how the cumulative distribution function and the probability density function fit the measured system response time, we believe we have found a reasonable match.
0
0
Fig. 9.
50
100
150 Time (second)
200
250
Probability Density Function of Call Duration Time
TABLE V PARAMETERS OF FITTED LOG - NORMAL DISTRIBUTION FOR CALL DURATION TIME
Parameter γ �
Estimate 3.06324 0.524942
Std. Err. 0.00308204 0.00217938
TABLE VI C ALL DURATION TIME ( IN SEC ): M EAN AND VARIANCE OF THE MEASUREMENT AND THE FITTED DISTRIBUTION
M ean V ar
Measurement 24.4513 199.5741
Fitted log-normal 24.5576 191.34
follows the log-normal distribution for GSM networks [8]. The estimated parameters of this log-normal distribution and their standard errors are given in Table V, and the mean and the variance of the measurement and the fitted distribution are shown in Table VI, which were obtained using the MLE method. Finally, the cumulative distribution function and the probability density function are shown in Figure 8 and Figure 9, respectively. V. S YSTEM C APACITY D ESIGN M ETHODOLOGIES FOR Q UALITY OF S ERVICE
We therefore resorted to a series of tests on different service time distributions and service rates to check whether we can find a match for the system response time. Note that for general independent arrival and general service time distribution, i.e., for the GI/G/1 system, there is no simple formula for the mean response time. Thus, our experimentation was based entirely on a series of simulations. Through this process, we found that for the service time also, the lognormal distribution is a good fit. Furthermore, if we use mean γ = 13 and variance � = 6.8 for the log-normal service time distribution, then it yields a response time distribution with mean 16.7822 and variance 113.3083, which is very close to the observed mean and variance of the measured system response time (see Table IV). Thus, our inference is that the system is well approximated as a GP/L/1 system (where GP stands for the Generalized Pareto distribution, and L for the log-normal distribution). Since there is no analytical formula for computing the response time of a GP/L/1 system, we compared simulation of this system against other similar queueing systems for which we know the formula or can derive the formula. Secondly, we are also interested in determining if an equivalent Poisson load can be used for approximating the system. Before we discuss our results, we first summarize the various results that are used in the comparison. In our case, we considered the following queueing systems M/M/1, M/L/1, GI/M/1 for which analytical results are available.
As we discussed earlier, there are two QoS factors to consider: the systems response time and the call blocking probability. In this section, we present our approach taking into consideration the traffic characteristics learned from the measurements.
In an M/M/1 system, with exponential distribution for inter-arrival time (with mean 1/λ) and exponential distribution for service time (with mean 1/μ), the CDF of the system response time (for ρ = λ/μ < 1) is given by
A. Maintaining Acceptable System Response Time
and the average response time is given by 1 . T = μ−λ
From traffic characterization, we found the inter-arrival time distribution to be Generalized Pareto, and the measured system response time distribution to be log-normal. Our main interest is to determine the service time distribution of the system. While the system has several subcomponents with the PhoneFactor daemon being the main handler, we approximate it as a single-server blackbox system. In this regard, our interest is to find an abstract notion of the service time to understand the system capacity requirement. The major difficultly is, however, due to the observation on traffic characteristics. Given the inter-arrival time to be Generalized Pareto and the system response time to be log-normal, there is no simple relation on what should be the distribution of the service time, nor their mean rate. As a comparison, if the inter-arrival time were exponential, and the service time were also exponential, then the system is commonly written as the M/M/1 system for which the response time distribution is also known to be exponential; in this case, if the mean arrival rate, λ, and the mean system response time, T , were known, then the unknown service rate can be simply determined as μ = 1/T + λ.
P (T < t) = 1 − e−(μ−λ)t ,
(3)
(4)
In an M/G/1 system, with mean arrival rate is λ, service rate of μ, utilization ρ = μλ , we denote the Laplace-Stieltjes ˜ The Laplace-Stieltjes transform of service time CDF by B. transform of the CDF of response time is the well-known Pollaczek-Kinchin formula [2]: ˜ (1 − ρ)B(s)s ˜ S(s) = , ρ < 1. (5) ˜ λB(s) +s−λ The mean system response time is then given by the PollaczekKinchin mean value formula: 1 λX¯2 + , ρ < 1, (6) T = 2(1 − ρ) μ where X¯2 is the second moment of the service time distribution. Then, for the log-normal service time, we can derive the mean response time of the M/L/1 as follows: 2
T =
2
2eγ+� /2 − λe2γ+� , 2(1 − λeγ+�2 /2 )
(7)
where γ and � are the mean and the standard deviation of the service time’s log-normal distribution.
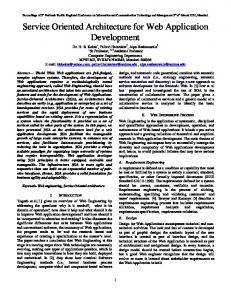
110 M/M/C/C-A-0.1% GP/L/C/C-S-0.1% M/M/C/C-A-0.01% GP/L/C/C-S-0.01%
100 90
−μ(1−r)t
P (T < t) = 1 − e
, t ≥ 0,
(8)
where r is the only root [2] in the range (0,1) of equation ˜ − μr) r = A(μ
80
Number of Circuits
In a GI/M/1 system, the system respond time is exponentially distributed with parameter μ(1 − r), i.e., its CDF is given by:
70 60 50 40 30
(9)
20
and A˜ is the Laplace-Stieltjes transform of the inter-arrival time CDF. The mean response time is given by:
10
T =
1 . (1 − r)μ
(10)
However, the Laplace-Stieltjes transform of the Generalized Pareto distribution does not have a closed form expression. There are methods to approximate the Laplace-Stieltjes transform of GP distribution. For example, a technique called the Transform Approximation Method (TAM) and its associated numeric procedure called the TAM Recursion Method (TRM) [6] can be employed. Application of these methods is beyond the scope of this paper. Instead, we provide simulation results for GP/M/1 in this paper. 80
70
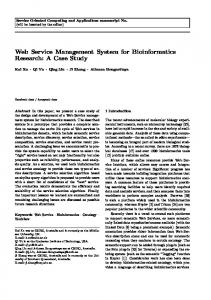
GP/M/1-S GP/L/1-S 1.05M/M/1-S M/M/1-A M/L/1-A M/L/1-S
60
0
10
20
30
40
50
60
70
Erlang Load
Fig. 11. Required Capacity for Certain Quality of Service of M/M/c/c and GP/L/c/c System
Poisson mean arrival rate that may approximate the GP/L/1 system. We found that if we assume the arrival rate to be 1.05λ, then (1.05)M/M/1 approximated the GP/L/1 system very closely. This means that we can use the M/M/1 analytical result for system capacity design, if we were to use the mean arrival rate to be 1.05λ, instead of λ. In other words, we can say that we have found an equivalent Poisson arrival rate for the system. While this is not based on rigorous analytical methods, this is still an important guideline for system capacity design for the abstracted system. In other words, we can use Figure 10 to set the acceptable response time if we were to assume the arrival rate to be 5% more than estimated and still use the M/M/1 system result. B. Determining Acceptable Number of Voice Circuits
Delay
50
In this section, we discuss the voice circuit dimensioning problem. This is important for the PhoneFactor provider in order to determine the number of access voice circuits to lease from the PSTN provider. We address this problem here by taking into account the traffic analysis of the measured data.
40
30
20
10 0.05
0
0.1
0.15
0.2
0.25
0.3
0.35 0.4 0.45 Utilization
0.5
0.55
0.6
0.65
0.7
0.75
Fig. 10. System Response Time of Different System with Same Means (S indicated simulation-based, while A indicates analytical result)
In Figure 10, we plot the response time for different combinations of distributions. It may be noted that we have plotted the result up to 75% utilization. This is because from the system capacity design point of view, utilization, on average, is not acceptable to exceed more than 75%. In the graph, we compared the M/M/1 and M/L/1 analytical results with the simulation results for GP/L/1, GP/M/1, M/L/1. First, we note that the simulation results for M/L/1 matched with the analytical results. These two curves are below the M/M/1 curve. We observed that GP/M/1 is the topmost curve, followed by GP/L/1 (the system we are interested in). Clearly, M/M/1 and M/L/1 underestimate the systems response time of the target system GP/L/1, while GP/M/1 overestimates the system response time. We also considered a special case of the M/M/1 system where we tried to determine an equivalent
Traditionally, Poisson arrivals and exponential call duration times are assumed for voice circuit capacity design (dimensioning) in the telephone network, where the wellknown Erlang-B loss formula [7] is useful and the system is considered as the loss system, M/M/c/c. Through our traffic analysis discussed earlier, we found that the call duration time follows the log-normal distribution. Since the Erlang-B loss formula also holds for general service time distribution [4] while the arrival is still assumed to be Poisson, it is tempting to use this formula. On the other hand, from the analysis of the inter-arrival time of requests, we found that the arrival process does not follow a Poisson process. Rather, the inter-arrival time of request arrivals was found to follow the Generalized Pareto distribution. It is important to note from Figure 2 that the access voice circuit from the PSTN is invoked a few moments after the request arrival. In particular, as of now, we do not have the ability to measure ‘initial duration at PFD’ and the circuit is grabbed right before the phone starts ringing; therefore, the distribution for this lag time is not known.
However, it is unlikely that the request inter-arrivals that follow the Generalized Pareto distribution will be smoothed by this unknown distribution to result in an exponential distribution by the time the voice circuit is needed. Therefore, we still consider that the inter-arrival time at the time of the voice circuit request to be Generalized Pareto distributed. In other words, the loss system considered here is GP/L/c/c. There is, however, no derivable analytical formula for determining call blocking for this system. As a consequence, we simulate the GP/L/c/c system to determine call blocking probability. Note that we are interested in maintaining the call blocking to be low for the requests; i.e., for a specific call blocking QoS, we want to determine the voice circuits needed for a given offered traffic load. For the M/M/c/c system, we determine this quantity for circuits using an iterative algorithm that uses the Erlang-B loss formula [10] (other methods, such as the one described in [9] can also be used). For the GP/L/c/c system, simulation is repeatedly conducted to determine the number of circuits that meets the specific quality of service. In Figure 11, we plot circuits required for different given offered load values for GP/L/c/c and M/M/c/c systems for two different values of call blocking quality-of-service. We choose 0.1% and 0.01% call blocking QoS since we do not want the circuits to be the main bottleneck in the overall PhoneFactor architecture. We observe an interesting phenomenon from the plot. For the lower offered load, the GP/L/c/c system requires more circuits than the M/M/c/c system, while for a higher load, it is the other way around. To our knowledge, this difference in the behavior of a general arrival system compared to M/M/c/c in terms of meeting QoS has not been reported before. In particular, at 0.1% blocking, the cross-over point is around 50 Erlangs of offered load, while for 0.01% blocking, the cross-over point is around 58 Erlangs of offered load. Another way to view this is that for lower offered load, the M/M/c/c approach underestimates the circuit required while for higher offered loads it serves as an upper bound. To put this in perspective, since the average call duration was found to be 24.4513 sec (see Table VI), then 50 Erlangs of offered load (which is the cross-over load for 0.1% blocking) translates to about 122.69 arrivals per minute, or 7,362 arrivals per hour. VI. S UMMARY AND F UTURE W ORK PhoneFactorTM is a token-less two-factor authentication service for user remote logons. In this paper, we discuss how a simple token-less authentication service leads to an inter-relation between the Internet and the PSTN. We then present a service management architecture for this service that needs to have the ability to place a call generated from the Internet to the PSTN. We also identified two key qualityof-service parameters for a PhoneFactor provider to address. Furthermore, through traffic analysis of the actual measurement data from the deployed PhoneFactor service, we found that the inter-arrival time of requests follows the Generalized Pareto distribution and the system response time and the call duration (for the authentication part through the phone call)
follow the log-normal distribution. For the session duration, it is perhaps not as surprising to find that it follows the log-normal distribution; recently, it was reported that the call duration in GSM networks are found to follow the log-normal distribution [8]. On the other hand, while the inter-arrival time for phone calls is typically assumed to be exponentially distributed, it was rather surprising for us to find that the inter-arrival time of the PhoneFactor requests are Generalized Pareto distributed. For these combination of the inter-arrival time and the session duration, there is, however, no known analytical results that can be used for the system capacity design. Therefore, based on approximation and simulation, we developed system capacity design methodologies by comparing them to known results for systems that are analytically derivable. In particular, we have identified the possibility of using an equivalent Poisson traffic load for the PhoneFactor daemon system, and for the voice circuit determination, where and how the Erlang-B formula might be indirectly applicable. As future work, we plan to consider classification of the basic service to different classes of services. For example, a customer might want to use simply ’#’ for its users to enter, while another customer might want its users to enter a PIN; naturally, the latter takes more time, which would then require classification of service durations to different classes. Secondly, different customers may want different levels of service guarantee. Such issues would require the development of a good request allocation scheme, which needs to be scalable as the service grows. We plan to address these issues in our future research. R EFERENCES [1] ActiveIdentity. http://www.ActivIdentity.com [2] I. Adan and J. Resing, Queueing Theory, unpublished manuscript, 2001. http://www.win.tue.nl/∼iadan/queueing.pdf [3] Aladdin. http://www.aladdin.com/ [4] D. Y. Burman, J. P. Lehoczky, and Y. Lim, “Insensitivity of blocking probabilities in a circuit-switching network,” Journal of Applied Probability, vol. 21, no. 4, pp. 850–859, December 1984. [5] Comodo. http://www.comodo.com/ [6] M. J. Fischer, D. M. B. Masi, D. Gross, and J. F. Shortle, “Oneparameter Pareto, two-parameter Pareto, three-parameter Pareto: is there a modeling difference?” The Telecommunication Review, vol. 16, pp. 79–92, 2005. [7] A. Girard, Routing and Dimensioning in Circuit-Switched Networks. Addison-Wesley, 1990. [8] J. Guo, F. Liu, and Z. Zhu, “Estimate the call duration distribution parameters in GSM system based on K-L divergence method,” in Proc. International Conference on Wireless Communications, Networking and Mobile Computing, 2007 (WiCom 2007), 2007, pp. 2988–2991. [9] D. L. Jagerman, “Methods in traffic calculations,” AT&T Bell Labs Technical Journal, vol. 63, pp. 1283–1303, 1984. [10] D. Medhi and K. Ramasamy, Network Routing: Algorithms, Protocols, and Architectures. Morgan Kaufmann Publishers, 2007. [11] L. O’Gorman, “Comparing passwords, tokens, and biometrics for user authentication,” Proceedings of the IEEE, vol. 91, no. 12, pp. 2021– 2040, December 2003. [12] V. Paxson and S. Floyd, “Wide-area traffic: The failure of Poisson modeling,” IEEE/ACM Trans. on Networking, vol. 3, pp. 226–244, 1995. [13] PhoneFactor, Inc. http://www.PhoneFactor.com [14] PhoneFactor, Inc., “PhoneFactor–A token-less two-factor authentication scheme (patent application pending).” [15] Verisign, “Unified authentication OTP services.” http://www.verisign. com/authentication/enterprise-authentication/enterprise-otp/